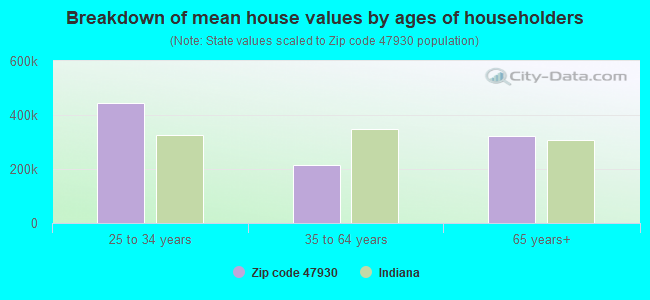
Estimated median house/condo value in 2022: $204,608
47930:
$204,608
Indiana:
$208,700
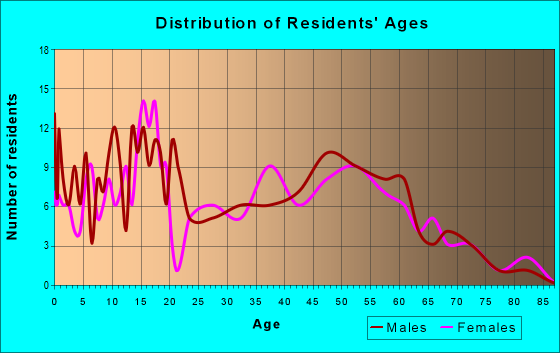
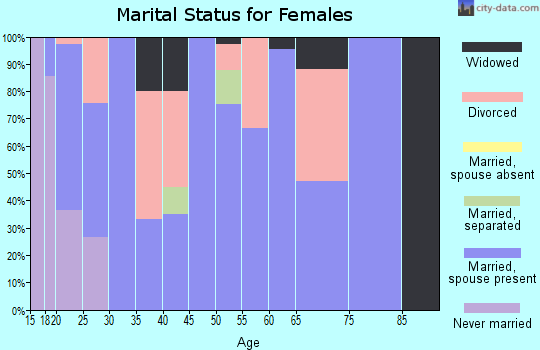
Median resident age:
This zip code:
34.3 years
Indiana median age:
38.2 years
Average household size:
This zip code:
2.5 people
Indiana:
2.4 people
Averages for the 2020 tax year for zip code 47930, filed in 2021:
Average Adjusted Gross Income (AGI) in 2020: $57,278 (Individual Income Tax Returns)
Here:
$57,278
State:
$64,978
Salary/wage: $54,235 (reported on 79.6% of returns)
Here:
$54,235
State:
$55,245
(% of AGI for various income ranges: 972.7% for AGIs below $25k, 3768.3% for AGIs $25k-50k, 6531.7% for AGIs $50k-75k, 9747.5% for AGIs $75k-100k, 24777.5% for AGIs $100k-200k)
Taxable interest for individuals: $843 (reported on 25.9% of returns)
This zip code:
$843
Indiana:
$1,351
(% of AGI for various income ranges: 11.8% for AGIs below $25k, 19.2% for AGIs $25k-50k, 98.3% for AGIs $50k-75k, 57.5% for AGIs $100k-200k)
Ordinary dividends: $2,317 (reported on 11.1% of returns)
Here:
$2,317
State:
$5,827
(% of AGI for various income ranges: 82.5% for AGIs $25k-50k, 100.0% for AGIs $100k-200k)
Net capital gain/loss in AGI: +$7,000 (reported on 11.1% of returns)
Here:
+$7,000
State:
+$17,730
(% of AGI for various income ranges: 153.3% for AGIs $25k-50k, 590.0% for AGIs $75k-100k)
Profit/loss from business: +$3,300 (reported on 5.6% of returns)
Here:
+$3,300
State:
+$12,144
(% of AGI for various income ranges: 165.0% for AGIs $50k-75k)
Taxable individual retirement arrangement distribution: $8,950 (reported on 7.4% of returns)
47930:
$8,950
Indiana:
$18,302
(% of AGI for various income ranges: 298.3% for AGIs $25k-50k)
Earned income credit: $1,533 (reported on 16.7% of returns)
Here:
$1,533
State:
$2,298
(% of AGI for various income ranges: 55.5% for AGIs below $25k, 64.2% for AGIs $25k-50k)
Percentage of individuals using paid preparers for their 2020 taxes: 92.6%
Here:
93%
State:
94%
(% for various income ranges: 93.8% for AGIs below $25k, 93.8% for AGIs $25k-50k, 100.0% for AGIs $50k-75k, 83.3% for AGIs $75k-100k, 87.5% for AGIs $100k-200k)
Averages for the 2012 tax year for zip code 47930, filed in 2013:
Average Adjusted Gross Income (AGI) in 2012: $50,091 (Individual Income Tax Returns)
Here:
$50,091
State:
$52,932
Salary/wage: $43,457 (reported on 89.1% of returns)
Here:
$43,457
State:
$45,173
(% of AGI for various income ranges: 76.5% for AGIs below $25k, 80.6% for AGIs $25k-50k, 79.2% for AGIs $50k-75k, 82.0% for AGIs $75k-100k, 73.1% for AGIs $100k-200k)
Taxable interest for individuals: $546 (reported on 23.6% of returns)
This zip code:
$546
Indiana:
$1,311
(% of AGI for various income ranges: 0.5% for AGIs below $25k, 0.1% for AGIs $25k-50k, 0.5% for AGIs $50k-75k, 0.3% for AGIs $75k-100k, 0.2% for AGIs $100k-200k)
Ordinary dividends: $1,633 (reported on 10.9% of returns)
Here:
$1,633
State:
$4,690
Net capital gain/loss in AGI: +$2,367 (reported on 5.5% of returns)
Here:
+$2,367
State:
+$10,406
Profit/loss from business: +$5,180 (reported on 9.1% of returns)
Here:
+$5,180
State:
+$11,105
Taxable individual retirement arrangement distribution: $7,975 (reported on 7.3% of returns)
47930:
$7,975
Indiana:
$13,841
Total itemized deductions: $18,469 (17% of AGI, reported on 23.6% of returns)
Here:
$18,469
State:
$20,913
Here:
17.5% of AGI
State:
18.2% of AGI
(% of AGI for various income ranges: 6.3% for AGIs $25k-50k, 8.0% for AGIs $50k-75k, 10.1% for AGIs $75k-100k, 11.8% for AGIs $100k-200k)
Charity contributions: $4,411 (reported on 16.4% of returns)
Here:
$4,411
State:
$4,697
(% of AGI for various income ranges: 2.8% for AGIs $50k-75k, 2.5% for AGIs $100k-200k)
Taxes paid: $6,454 (reported on 23.6% of returns)
47930:
$6,454
State:
$7,456
(% of AGI for various income ranges: 1.1% for AGIs $25k-50k, 2.4% for AGIs $50k-75k, 3.3% for AGIs $75k-100k, 4.9% for AGIs $100k-200k)
Earned income credit: $2,355 (reported on 20.0% of returns)
Here:
$2,355
State:
$2,265
(% of AGI for various income ranges: 8.0% for AGIs below $25k, 1.0% for AGIs $25k-50k)
Percentage of individuals using paid preparers for their 2012 taxes: 58.2%
Here:
58%
State:
53%
(% for various income ranges: 50.0% for AGIs below $25k, 60.0% for AGIs $25k-50k, 71.4% for AGIs $50k-75k, 60.0% for AGIs $75k-100k, 66.7% for AGIs $100k-200k)
Averages for the 2004 tax year for zip code 47930, filed in 2005:
Average Adjusted Gross Income (AGI) in 2004: $41,447 (Individual Income Tax Returns)
Here:
$41,447
State:
$44,790
Salary/wage: $38,649 (reported on 89.9% of returns)
Here:
$38,649
State:
$39,615
(% of AGI for various income ranges: 105.8% for AGIs below $10k, 77.7% for AGIs $10k-25k, 87.2% for AGIs $25k-50k, 85.6% for AGIs $50k-75k, 81.8% for AGIs $75k-100k, 80.3% for AGIs over 100k)
Taxable interest for individuals: $673 (reported on 40.3% of returns)
This zip code:
$673
Indiana:
$1,535
(% of AGI for various income ranges: 2.9% for AGIs below $10k, 1.6% for AGIs $10k-25k, 0.9% for AGIs $25k-50k, 0.4% for AGIs $50k-75k, 0.5% for AGIs $75k-100k, 0.2% for AGIs over 100k)
Taxable dividends: $779 (reported on 15.6% of returns)
Here:
$779
State:
$2,998
(% of AGI for various income ranges: 1.2% for AGIs below $10k, 0.2% for AGIs $25k-50k, 0.3% for AGIs $50k-75k, 0.3% for AGIs $75k-100k, 0.4% for AGIs over 100k)
Net capital gain/loss: +$1,068 (reported on 11.9% of returns)
Here:
+$1,068
State:
+$8,619
(% of AGI for various income ranges: 1.6% for AGIs $25k-50k, -0.1% for AGIs $50k-75k, 0.2% for AGIs $75k-100k, -0.4% for AGIs over 100k)
Profit/loss from business: +$3,289 (reported on 7.7% of returns)
Here:
+$3,289
State:
+$10,071
Total itemized deductions: $16,008 (20% of AGI, reported on 26.7% of returns)
Here:
$16,008
State:
$17,065
Here:
20.1% of AGI
State:
19.5% of AGI
(% of AGI for various income ranges: 7.1% for AGIs $10k-25k, 7.0% for AGIs $25k-50k, 11.2% for AGIs $50k-75k, 12.3% for AGIs $75k-100k, 13.8% for AGIs over 100k)
Charity contributions deductions: $2,366 (3% of AGI, reported on 20.4% of returns)
Here:
$2,366
State:
$3,550
Here:
2.7% of AGI
State:
3.8% of AGI
(% of AGI for various income ranges: 0.7% for AGIs $25k-50k, 1.3% for AGIs $50k-75k, 1.0% for AGIs $75k-100k, 2.3% for AGIs over 100k)
Total tax: $4,792 (reported on 72.9% of returns)
47930:
$4,792
State:
$6,914
(% of AGI for various income ranges: 1.2% for AGIs below $10k, 3.5% for AGIs $10k-25k, 6.2% for AGIs $25k-50k, 8.1% for AGIs $50k-75k, 11.0% for AGIs $75k-100k, 11.9% for AGIs over 100k)
Earned income credit: $1,721 (reported on 17.4% of returns)
Here:
$1,721
State:
$1,685
Percentage of individuals using paid preparers for their 2004 taxes: 59.9%
Here:
60%
State:
59%
(% for various income ranges: 49.5% for AGIs below $10k, 60.0% for AGIs $10k-25k, 62.5% for AGIs $25k-50k, 64.5% for AGIs $50k-75k, 65.0% for AGIs $75k-100k, 64.5% for AGIs over 100k)
Household received Food Stamps/SNAP in the past 12 months: 16 Household did not receive Food Stamps/SNAP in the past 12 months: 440
Women who had a birth in the past 12 months: 10 (8 now married, 2 unmarried) Women who did not have a birth in the past 12 months: 197 (135 now married, 62 unmarried)
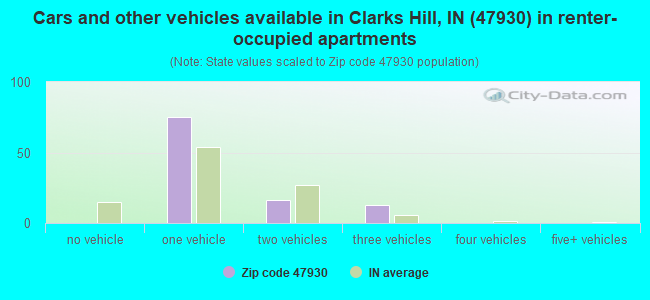
Housing units in zip code 47930 with a mortgage: 235 (16 second mortgage, 14 both second mortgage and home equity loan) Houses without a mortgage: 6
Median monthly owner costs for units with a mortgage: $1,272 Median monthly owner costs for units without a mortgage: $492
Residents with income below the poverty level in 2022:
This zip code:
4.9%
Whole state:
12.6%
Residents with income below 50% of the poverty level in 2022:
This zip code:
1.4%
Whole state:
6.3%
Median number of rooms in houses and condos:
Here:
6.9
State:
6.6
Median number of rooms in apartments:
Here:
5.6
State:
4.3
Notable locations in this zip code not listed on our city pages
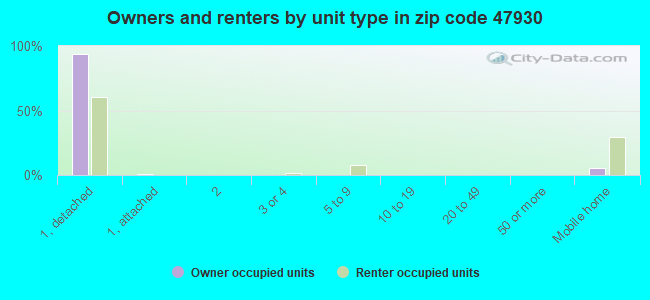
Size of family households: 100 2-persons, 45 3-persons, 125 4-persons, 25 5-persons, 5 7-or-more-persons
Size of nonfamily households: 123 1-person, 28 2-persons
242 married couples with children.
50 single-parent households (7 men, 43 women).
98.0% of residents of 47930 zip code speak English at home.
0.8% of residents speak Spanish at home (38% very well, 62% not well).
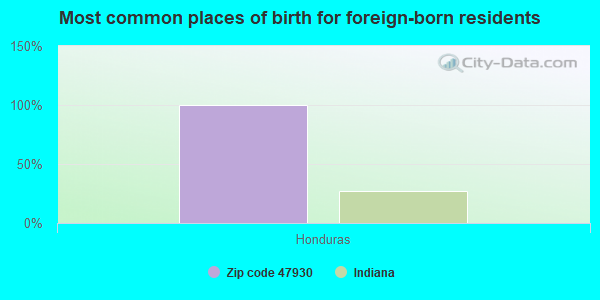
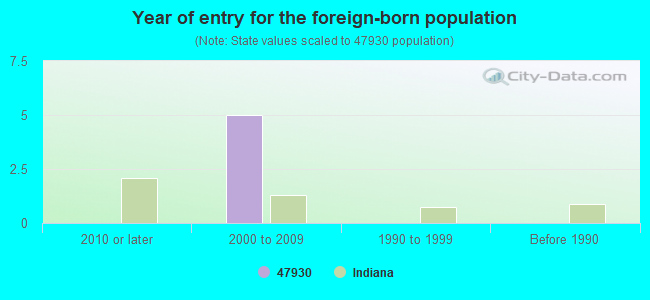
Foreign born population: 5 (0.5%) (0.0% of them are naturalized citizens)
:
0.5%
Whole state:
6.1%
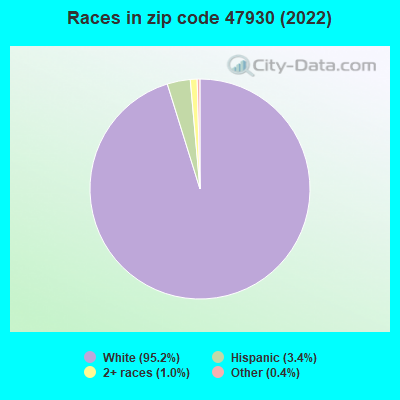
100%Honduras
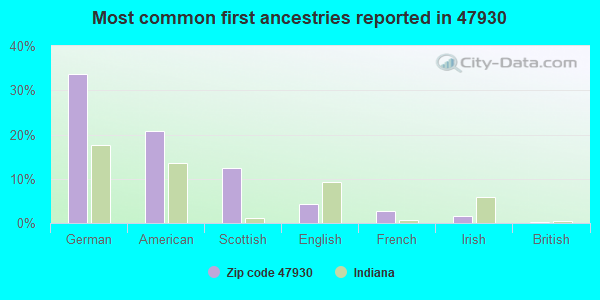
34%German
21%American
12%Scottish
4%English
3%French
2%Irish
0%British
Year of entry for the foreign-born population
02010 or later
52000 to 2009
01990 to 1999
0Before 1990
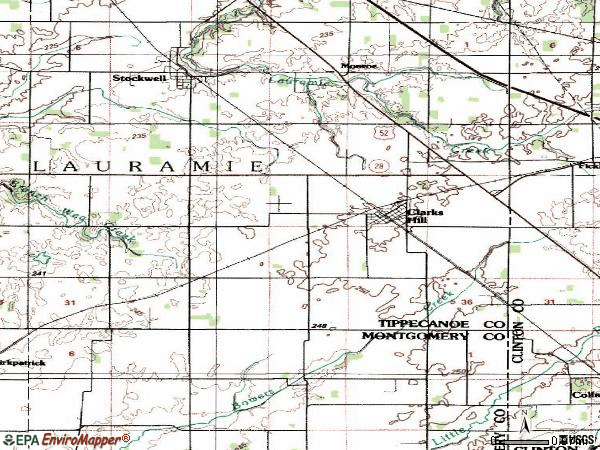
Facilities with environmental interests located in this zip code:
CROPMATE FERTILIZER CO (9220 E 1175 S in CLARKS HILL, IN)
STATE MASTER (Indiana facility tracking) - CRTK-7072, EPCRA COMPLIANCE ACTIVITY (Tracking inspections of insecticide, fungicide, and rodenticide, and toxic substances) (Resource Conservation and Recovery Act (tracking hazardous waste)) Organizations: DIENER PAUL (CONTACT/OWNER)
Alternative names: CROP MATE CO, D & B FARM SERVICE
AMOCO FERTILIZER PLT (S OF CLARKS HILL OFF RT 2 in CLARKS HILL, IN)
STATE MASTER (Indiana facility tracking) (Resource Conservation and Recovery Act (tracking hazardous waste))
CLARKS HILL MUNICIPAL STP (9221 E SR 28 in CLARKS HILL, IN)
STATE MASTER (Indiana facility tracking) National Pollutant Discharge Elimination System NON-MAJOR (Tracking pollutant discharge elimination systems) - permit Business SIC classification: SEWERAGE SYSTEMS Organizations: ALOYSIUS THOMPSON PROVIS (CONTACT/OPERATOR)
, TOWN COUNCIL PRESIDENT (CONTACT/OWNER)
Alternative names: CLARKS HILL MUNICIPAL Sewage treatment plant, CLARKS HILL MUNICIPAL WWTP
Housing units lacking complete plumbing facilities: 2.1% Housing units lacking complete kitchen facilities: 1.8%
73.5%Bottled, tank, or LP gas
20.1%Electricity
2.7%Utility gas
2.3%Fuel oil, kerosene, etc.
2.0%Wood
Population in 1990: 2,119.
Place of birth for U.S.-born residents:
This state: 1,021
Northeast: 5
Midwest: 32
South: 41
West: 11
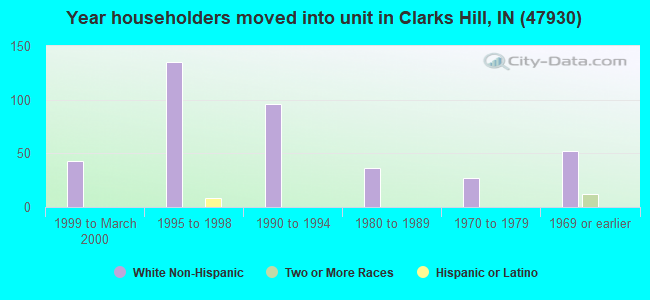
60% of the 47930 zip code residents lived in the same house 5 years ago. Out of people who lived in different houses, 60% lived in this county. Out of people who lived in different counties, 50% lived in Indiana.
92% of the 47930 zip code residents lived in the same house 1 year ago. Out of people who lived in different houses, 38% moved from this county. Out of people who lived in different houses, 46% moved from different county within same state. Out of people who lived in different houses, 17% moved from different state.
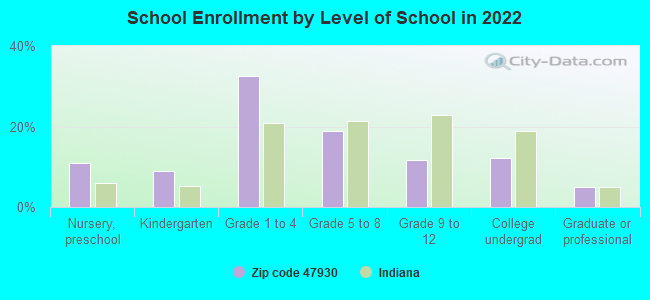
Private vs. public school enrollment:
Students in private schools in grades 1 to 8 (elementary and middle school): 13
Here:
14.6%
Indiana:
14.9%
Students in private schools in grades 9 to 12 (high school): 11
Here:
55.8%
Indiana:
11.4%
Students in private undergraduate colleges: 3
Here:
17.4%
Indiana:
22.3%
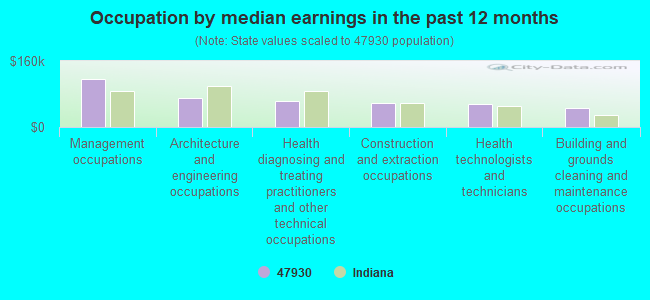
Occupation by median earnings in the past 12 months ($)
115,639Management occupations
70,985Architecture and engineering occupations
63,069Health diagnosing and treating practitioners and other technical occupations
57,129Construction and extraction occupations
56,114Health technologists and technicians
46,961Building and grounds cleaning and maintenance occupations
Top industries in this zip code by the number of employees in 2005:
Construction: Other Building Finishing Contractors (10-19 employees: 1 establishment)
Construction: Site Preparation Contractors (10-19: 1)
Accommodation and Food Services: Full-Service Restaurants (5-9: 1, 1-4: 1)
Other Services (except Public Administration): Religious Organizations (5-9: 1)
Administrative and Support and Waste Management and Remediation Services: Janitorial Services (1-4: 1)
Professional, Scientific, and Technical Services: Process, Physical Distribution, and Logistics Consulting Services (1-4: 1)
Fatal accident statistics in 2011:
Fatal accident count: 1
Vehicles involved in fatal accidents: 2
Fatal accidents caused by drunken drivers: 0
Fatalities: 1
Persons involved in fatal accidents: 3
Pedestrians involved in fatal accidents: 0
Fatal accident statistics in 2010:
Fatal accident count: 1
Vehicles involved in fatal accidents: 2
Fatal accidents caused by drunken drivers: 0
Fatalities: 2
Persons involved in fatal accidents: 4
Pedestrians involved in fatal accidents: 0
Home Mortgage Disclosure Act Aggregated Statistics For Year 2009 (Based on 2 partial tracts)
A) FHA, FSA/RHS & VA Home Purchase Loans
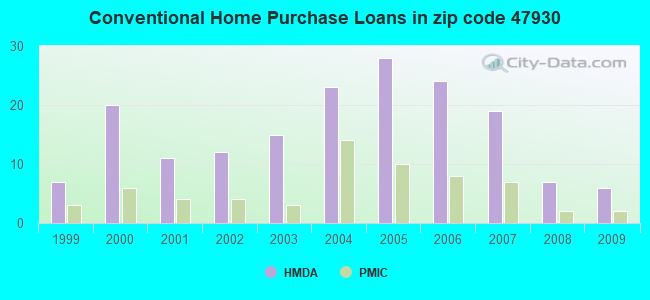
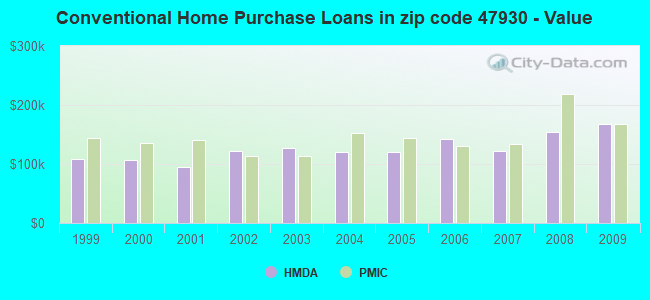
B) Conventional Home Purchase Loans
C) Refinancings
D) Home Improvement Loans
F) Non-occupant Loans on < 5 Family Dwellings (A B C & D)
G) Loans On Manufactured Home Dwelling (A B C & D)
Number
Average Value
Number
Average Value
Number
Average Value
Number
Average Value
Number
Average Value
Number
Average Value
LOANS ORIGINATED
6
$105,117
6
$168,252
35
$142,713
1
$112,960
2
$46,905
2
$78,880
APPLICATIONS APPROVED, NOT ACCEPTED
0
$0
1
$176,580
4
$159,460
0
$0
0
$0
0
$0
APPLICATIONS DENIED
4
$66,950
3
$87,860
16
$129,191
1
$6,170
1
$127,240
1
$15,910
APPLICATIONS WITHDRAWN
2
$108,255
1
$219,430
7
$180,849
0
$0
0
$0
1
$69,460
FILES CLOSED FOR INCOMPLETENESS
1
$15,260
0
$0
1
$196,380
0
$0
0
$0
0
$0
Aggregated Statistics For Year 2008 (Based on 2 partial tracts)
A) FHA, FSA/RHS & VA Home Purchase Loans
B) Conventional Home Purchase Loans
C) Refinancings
D) Home Improvement Loans
F) Non-occupant Loans on < 5 Family Dwellings (A B C & D)
G) Loans On Manufactured Home Dwelling (A B C & D)
Number
Average Value
Number
Average Value
Number
Average Value
Number
Average Value
Number
Average Value
Number
Average Value
LOANS ORIGINATED
3
$113,827
7
$154,000
21
$133,596
4
$82,285
2
$80,990
3
$92,510
APPLICATIONS APPROVED, NOT ACCEPTED
1
$95,430
0
$0
3
$139,793
0
$0
0
$0
1
$49,990
APPLICATIONS DENIED
3
$108,523
2
$111,500
15
$105,560
2
$55,670
0
$0
3
$84,397
APPLICATIONS WITHDRAWN
1
$62,320
2
$197,520
11
$128,955
1
$112,960
1
$48,370
1
$123,350
FILES CLOSED FOR INCOMPLETENESS
0
$0
0
$0
2
$125,295
0
$0
0
$0
0
$0
Aggregated Statistics For Year 2007 (Based on 2 partial tracts)
A) FHA, FSA/RHS & VA Home Purchase Loans
B) Conventional Home Purchase Loans
C) Refinancings
D) Home Improvement Loans
F) Non-occupant Loans on < 5 Family Dwellings (A B C & D)
G) Loans On Manufactured Home Dwelling (A B C & D)
Number
Average Value
Number
Average Value
Number
Average Value
Number
Average Value
Number
Average Value
Number
Average Value
LOANS ORIGINATED
4
$89,670
19
$122,391
19
$140,329
5
$35,186
4
$99,248
2
$90,400
APPLICATIONS APPROVED, NOT ACCEPTED
0
$0
2
$80,500
5
$108,416
1
$26,620
0
$0
1
$26,290
APPLICATIONS DENIED
1
$31,490
6
$84,450
24
$115,706
6
$46,688
1
$14,930
2
$46,580
APPLICATIONS WITHDRAWN
0
$0
3
$126,270
9
$121,328
3
$38,087
0
$0
0
$0
FILES CLOSED FOR INCOMPLETENESS
0
$0
1
$135,030
2
$96,405
0
$0
0
$0
0
$0
Aggregated Statistics For Year 2006 (Based on 2 partial tracts)
A) FHA, FSA/RHS & VA Home Purchase Loans
B) Conventional Home Purchase Loans
C) Refinancings
D) Home Improvement Loans
F) Non-occupant Loans on < 5 Family Dwellings (A B C & D)
G) Loans On Manufactured Home Dwelling (A B C & D)
Number
Average Value
Number
Average Value
Number
Average Value
Number
Average Value
Number
Average Value
Number
Average Value
LOANS ORIGINATED
5
$110,170
24
$141,715
26
$94,633
5
$46,872
3
$98,680
5
$59,466
APPLICATIONS APPROVED, NOT ACCEPTED
0
$0
2
$98,840
4
$126,918
1
$67,190
1
$44,790
0
$0
APPLICATIONS DENIED
0
$0
8
$117,180
23
$121,414
6
$37,058
2
$81,960
5
$61,610
APPLICATIONS WITHDRAWN
1
$81,150
3
$130,923
10
$93,193
3
$64,703
0
$0
1
$54,860
FILES CLOSED FOR INCOMPLETENESS
0
$0
1
$92,190
3
$112,853
0
$0
0
$0
0
$0
Aggregated Statistics For Year 2005 (Based on 2 partial tracts)
A) FHA, FSA/RHS & VA Home Purchase Loans
B) Conventional Home Purchase Loans
C) Refinancings
D) Home Improvement Loans
F) Non-occupant Loans on < 5 Family Dwellings (A B C & D)
G) Loans On Manufactured Home Dwelling (A B C & D)
Number
Average Value
Number
Average Value
Number
Average Value
Number
Average Value
Number
Average Value
Number
Average Value
LOANS ORIGINATED
3
$116,530
28
$119,754
34
$100,893
3
$71,413
5
$64,920
3
$59,617
APPLICATIONS APPROVED, NOT ACCEPTED
0
$0
3
$102,250
5
$111,338
1
$17,850
0
$0
0
$0
APPLICATIONS DENIED
1
$59,080
5
$81,864
30
$116,380
5
$31,032
1
$77,900
2
$58,755
APPLICATIONS WITHDRAWN
1
$62,650
2
$120,265
12
$132,248
2
$206,285
1
$93,480
0
$0
FILES CLOSED FOR INCOMPLETENESS
0
$0
1
$163,920
10
$140,876
0
$0
0
$0
0
$0
Aggregated Statistics For Year 2004 (Based on 2 partial tracts)
A) FHA, FSA/RHS & VA Home Purchase Loans
B) Conventional Home Purchase Loans
C) Refinancings
D) Home Improvement Loans
F) Non-occupant Loans on < 5 Family Dwellings (A B C & D)
G) Loans On Manufactured Home Dwelling (A B C & D)
Number
Average Value
Number
Average Value
Number
Average Value
Number
Average Value
Number
Average Value
Number
Average Value
LOANS ORIGINATED
4
$130,327
23
$120,935
39
$120,460
5
$59,922
3
$75,523
2
$78,715
APPLICATIONS APPROVED, NOT ACCEPTED
0
$0
4
$117,100
7
$124,924
0
$0
0
$0
0
$0
APPLICATIONS DENIED
1
$90,240
4
$109,228
28
$112,590
4
$39,845
2
$57,615
4
$64,433
APPLICATIONS WITHDRAWN
0
$0
3
$114,477
13
$119,552
1
$45,440
0
$0
0
$0
FILES CLOSED FOR INCOMPLETENESS
0
$0
0
$0
6
$154,618
0
$0
0
$0
0
$0
Aggregated Statistics For Year 2003 (Based on 2 partial tracts)
A) FHA, FSA/RHS & VA Home Purchase Loans
B) Conventional Home Purchase Loans
C) Refinancings
D) Home Improvement Loans
F) Non-occupant Loans on < 5 Family Dwellings (A B C & D)
Number
Average Value
Number
Average Value
Number
Average Value
Number
Average Value
Number
Average Value
LOANS ORIGINATED
5
$70,632
15
$127,135
85
$116,577
4
$54,775
3
$54,533
APPLICATIONS APPROVED, NOT ACCEPTED
0
$0
2
$89,265
11
$100,921
0
$0
0
$0
APPLICATIONS DENIED
1
$82,450
4
$98,840
29
$97,671
2
$47,230
0
$0
APPLICATIONS WITHDRAWN
0
$0
2
$140,225
11
$97,941
0
$0
1
$40,900
FILES CLOSED FOR INCOMPLETENESS
0
$0
2
$68,165
1
$89,590
0
$0
0
$0
Aggregated Statistics For Year 2002 (Based on 2 partial tracts)
A) FHA, FSA/RHS & VA Home Purchase Loans
B) Conventional Home Purchase Loans
C) Refinancings
D) Home Improvement Loans
F) Non-occupant Loans on < 5 Family Dwellings (A B C & D)
Number
Average Value
Number
Average Value
Number
Average Value
Number
Average Value
Number
Average Value
LOANS ORIGINATED
3
$111,447
12
$122,699
59
$112,944
1
$25,640
2
$117,670
APPLICATIONS APPROVED, NOT ACCEPTED
0
$0
1
$49,010
8
$107,930
1
$12,980
1
$49,010
APPLICATIONS DENIED
1
$86,990
1
$46,090
26
$102,224
1
$36,030
1
$52,590
APPLICATIONS WITHDRAWN
0
$0
1
$99,650
11
$90,593
0
$0
0
$0
FILES CLOSED FOR INCOMPLETENESS
0
$0
0
$0
4
$84,152
0
$0
0
$0
Aggregated Statistics For Year 2001 (Based on 2 partial tracts)
A) FHA, FSA/RHS & VA Home Purchase Loans
B) Conventional Home Purchase Loans
C) Refinancings
D) Home Improvement Loans
F) Non-occupant Loans on < 5 Family Dwellings (A B C & D)
Number
Average Value
Number
Average Value
Number
Average Value
Number
Average Value
Number
Average Value
LOANS ORIGINATED
3
$91,537
11
$94,517
46
$111,670
5
$24,994
4
$57,618
APPLICATIONS APPROVED, NOT ACCEPTED
0
$0
0
$0
7
$106,469
1
$17,530
0
$0
APPLICATIONS DENIED
1
$72,710
6
$52,910
31
$81,695
3
$28,240
1
$38,630
APPLICATIONS WITHDRAWN
0
$0
2
$92,350
9
$81,980
1
$22,720
0
$0
FILES CLOSED FOR INCOMPLETENESS
0
$0
0
$0
2
$65,730
0
$0
0
$0
Aggregated Statistics For Year 2000 (Based on 2 partial tracts)
A) FHA, FSA/RHS & VA Home Purchase Loans
B) Conventional Home Purchase Loans
C) Refinancings
D) Home Improvement Loans
F) Non-occupant Loans on < 5 Family Dwellings (A B C & D)
Number
Average Value
Number
Average Value
Number
Average Value
Number
Average Value
Number
Average Value
LOANS ORIGINATED
5
$75,892
20
$105,933
17
$83,747
6
$18,665
2
$93,485
APPLICATIONS APPROVED, NOT ACCEPTED
1
$83,750
3
$99,653
6
$66,760
2
$19,315
0
$0
APPLICATIONS DENIED
2
$69,300
6
$57,670
17
$59,994
7
$18,966
0
$0
APPLICATIONS WITHDRAWN
0
$0
2
$155,160
8
$58,266
1
$47,720
0
$0
FILES CLOSED FOR INCOMPLETENESS
0
$0
1
$71,090
1
$142,820
0
$0
0
$0
Aggregated Statistics For Year 1999 (Based on 1 partial tract)
Detailed PMIC statistics for the following Tracts:0110.00
2002 - 2017 National Fire Incident Reporting System (NFIRS) incidents
Based on the data from the years 2002 - 2017 the average number of fires per year is 9. The highest number of reported fire incidents - 32 took place in 2009, and the least - 0 in 2014. The data has a decreasing trend.
When looking into fire subcategories, the most incidents belonged to: Structure Fires (44.1%), and Outside Fires (42.7%).
Fire incident types reported to NFIRS in Zip Code 47930
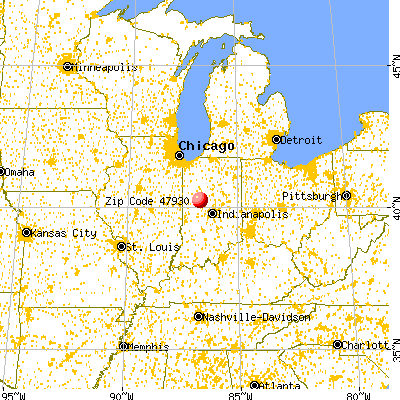


 Nearest zip codes: 47983, 46035, 47940, 47955, 47941, 46058.
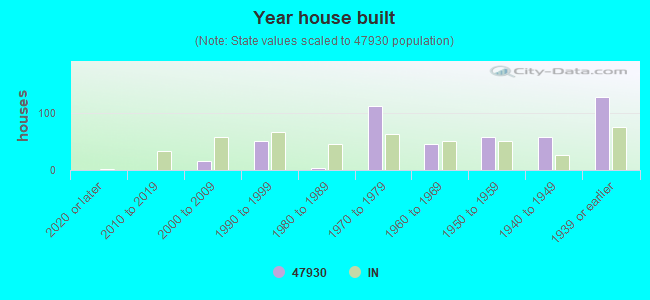


 Based on the data from the years 2002 - 2017 the average number of fires per year is 9. The highest number of reported fire incidents - 32 took place in 2009, and the least - 0 in 2014. The data has a decreasing trend.
 When looking into fire subcategories, the most incidents belonged to: Structure Fires (44.1%), and Outside Fires (42.7%).