Estimated zip code population in 2022: 3,342 Zip code population in 2010: 3,408 Zip code population in 2000: 3,575
Houses and condos: 1,845 Renter-occupied apartments: 135
% of renters here:
10%
State:
27%
March 2022 cost of living index in zip code 49249: 78.9 (low, U.S. average is 100)
Land area: 32.0 sq. mi. Water area: 1.5 sq. mi.
Population density: 104 people per square mile
(very low).
OSM Map
General Map
Google Map
MSN Map
OSM Map
General Map
Google Map
MSN Map
OSM Map
General Map
Google Map
MSN Map
OSM Map
General Map
Google Map
MSN Map
Please wait while loading the map...
Real estate property taxes paid for housing units in 2022:
This zip code:
0.9% ($2,092)
Michigan:
1.2% ($2,746)
Median real estate property taxes paid for housing units with mortgages in 2022: $2,004 (0.8%) Median real estate property taxes paid for housing units with no mortgage in 2022: $2,325 (1.0%)
Business Search- 14 Million verified businesses
Males: 1,807
(54.1%)
Females: 1,534
(45.9%)
For population 25 years and over in 49249:
High school or higher: 91.9%
Bachelor's degree or higher: 24.8%
Graduate or professional degree: 8.9%
Unemployed: 6.5%
Mean travel time to work (commute): 36.4 minutes
For population 15 years and over in 49249:
Never married: 20.1%
Now married: 57.4%
Separated: 1.4%
Widowed: 5.4%
Divorced: 15.8%
Zip code 49249 compared to state average:
Black race population percentage significantly below state average.
Hispanic race population percentage significantly below state average.
Median age significantly above state average.
Foreign-born population percentage significantly below state average.
Renting percentage significantly below state average.
Length of stay since moving in significantly above state average.
Averages for the 2020 tax year for zip code 49249, filed in 2021:
Average Adjusted Gross Income (AGI) in 2020: $67,836 (Individual Income Tax Returns)
Here:
$67,836
State:
$68,945
Salary/wage: $57,525 (reported on 73.9% of returns)
Here:
$57,525
State:
$57,142
(% of AGI for various income ranges: 756.0% for AGIs below $25k, 2975.2% for AGIs $25k-50k, 5838.9% for AGIs $50k-75k, 7782.0% for AGIs $75k-100k, 15196.5% for AGIs $100k-200k, 53360.0% for AGIs over 200k)
Taxable interest for individuals: $1,016 (reported on 33.3% of returns)
This zip code:
$1,016
Michigan:
$1,630
(% of AGI for various income ranges: 20.7% for AGIs below $25k, 31.0% for AGIs $25k-50k, 46.1% for AGIs $50k-75k, 77.3% for AGIs $75k-100k, 74.1% for AGIs $100k-200k, 380.0% for AGIs over 200k)
Ordinary dividends: $3,656 (reported on 20.6% of returns)
Here:
$3,656
State:
$6,972
(% of AGI for various income ranges: 25.3% for AGIs below $25k, 41.6% for AGIs $25k-50k, 40.0% for AGIs $50k-75k, 117.3% for AGIs $75k-100k, 315.9% for AGIs $100k-200k, 1265.0% for AGIs over 200k)
Net capital gain/loss in AGI: +$14,331 (reported on 19.4% of returns)
Here:
+$14,331
State:
+$20,064
(% of AGI for various income ranges: 0.3% for AGIs below $25k, 26.5% for AGIs $25k-50k, 113.9% for AGIs $50k-75k, 158.0% for AGIs $75k-100k, 203.5% for AGIs $100k-200k, 18575.0% for AGIs over 200k)
Profit/loss from business: +$10,109 (reported on 13.9% of returns)
Here:
+$10,109
State:
+$11,172
(% of AGI for various income ranges: 89.7% for AGIs below $25k, 56.8% for AGIs $25k-50k, 303.3% for AGIs $50k-75k, 784.7% for AGIs $100k-200k)
Taxable individual retirement arrangement distribution: $17,148 (reported on 15.2% of returns)
49249:
$17,148
Michigan:
$19,803
(% of AGI for various income ranges: 111.0% for AGIs below $25k, 199.4% for AGIs $25k-50k, 252.8% for AGIs $50k-75k, 623.3% for AGIs $75k-100k, 1144.7% for AGIs $100k-200k)
Total itemized deductions: $25,910 (reported on 6.1% of returns)
Here:
$25,910
State:
$34,117
(% of AGI for various income ranges: 468.3% for AGIs $50k-75k, 574.7% for AGIs $100k-200k, 3855.0% for AGIs over 200k)
Charity contributions: $9,414 (reported on 4.2% of returns)
Here:
$9,414
State:
$13,548
(% of AGI for various income ranges: 26.1% for AGIs $25k-50k, 158.8% for AGIs $100k-200k, 1540.0% for AGIs over 200k)
Taxes paid: $7,450 (reported on 6.1% of returns)
49249:
$7,450
State:
$7,972
(% of AGI for various income ranges: 114.4% for AGIs $50k-75k, 189.4% for AGIs $100k-200k, 1085.0% for AGIs over 200k)
Earned income credit: $2,194 (reported on 9.7% of returns)
Here:
$2,194
State:
$2,251
(% of AGI for various income ranges: 59.3% for AGIs below $25k, 55.8% for AGIs $25k-50k)
Percentage of individuals using paid preparers for their 2020 taxes: 93.3%
Here:
93%
State:
93%
(% for various income ranges: 93.3% for AGIs below $25k, 92.5% for AGIs $25k-50k, 92.0% for AGIs $50k-75k, 90.5% for AGIs $75k-100k, 96.4% for AGIs $100k-200k, 100.0% for AGIs over 200k)
Averages for the 2012 tax year for zip code 49249, filed in 2013:
Average Adjusted Gross Income (AGI) in 2012: $51,424 (Individual Income Tax Returns)
Here:
$51,424
State:
$55,609
Salary/wage: $45,002 (reported on 79.2% of returns)
Here:
$45,002
State:
$46,782
(% of AGI for various income ranges: 63.3% for AGIs below $25k, 65.0% for AGIs $25k-50k, 77.4% for AGIs $50k-75k, 68.1% for AGIs $75k-100k, 94.2% for AGIs $100k-200k)
Taxable interest for individuals: $771 (reported on 35.7% of returns)
This zip code:
$771
Michigan:
$1,491
(% of AGI for various income ranges: 1.5% for AGIs below $25k, 0.7% for AGIs $25k-50k, 0.3% for AGIs $50k-75k, 0.6% for AGIs $75k-100k, 0.4% for AGIs $100k-200k)
Ordinary dividends: $3,282 (reported on 18.2% of returns)
Here:
$3,282
State:
$6,225
(% of AGI for various income ranges: 1.5% for AGIs below $25k, 1.5% for AGIs $25k-50k, 1.0% for AGIs $50k-75k, 1.2% for AGIs $75k-100k, 1.4% for AGIs $100k-200k)
Net capital gain/loss in AGI: +$3,230 (reported on 14.9% of returns)
Here:
+$3,230
State:
+$9,326
(% of AGI for various income ranges: 0.3% for AGIs $25k-50k, 3.7% for AGIs $100k-200k)
Profit/loss from business: +$8,105 (reported on 13.0% of returns)
Here:
+$8,105
State:
+$11,523
(% of AGI for various income ranges: 7.7% for AGIs below $25k, 0.7% for AGIs $25k-50k, 1.2% for AGIs $50k-75k, 1.3% for AGIs $75k-100k, 3.2% for AGIs $100k-200k)
Taxable individual retirement arrangement distribution: $16,186 (reported on 13.6% of returns)
49249:
$16,186
Michigan:
$15,298
(% of AGI for various income ranges: 5.0% for AGIs below $25k, 4.1% for AGIs $25k-50k, 3.0% for AGIs $50k-75k, 5.1% for AGIs $75k-100k, 6.3% for AGIs $100k-200k)
Total itemized deductions: $18,394 (21% of AGI, reported on 31.2% of returns)
Here:
$18,394
State:
$21,628
Here:
21.3% of AGI
State:
18.4% of AGI
(% of AGI for various income ranges: 5.6% for AGIs below $25k, 9.7% for AGIs $25k-50k, 10.6% for AGIs $50k-75k, 12.1% for AGIs $75k-100k, 13.7% for AGIs $100k-200k, 10.7% for AGIs over 200k)
Charity contributions: $2,897 (reported on 22.1% of returns)
Here:
$2,897
State:
$4,225
(% of AGI for various income ranges: 1.0% for AGIs $25k-50k, 1.1% for AGIs $50k-75k, 1.3% for AGIs $75k-100k, 2.3% for AGIs $100k-200k)
Taxes paid: $5,965 (reported on 31.2% of returns)
49249:
$5,965
State:
$8,327
(% of AGI for various income ranges: 1.1% for AGIs below $25k, 2.5% for AGIs $25k-50k, 3.1% for AGIs $50k-75k, 3.5% for AGIs $75k-100k, 5.0% for AGIs $100k-200k, 5.5% for AGIs over 200k)
Earned income credit: $2,133 (reported on 13.6% of returns)
Here:
$2,133
State:
$2,306
(% of AGI for various income ranges: 4.9% for AGIs below $25k, 1.0% for AGIs $25k-50k)
Percentage of individuals using paid preparers for their 2012 taxes: 61.0%
Here:
61%
State:
57%
(% for various income ranges: 56.4% for AGIs below $25k, 61.1% for AGIs $25k-50k, 59.3% for AGIs $50k-75k, 72.2% for AGIs $75k-100k, 75.0% for AGIs $100k-200k)
Averages for the 2004 tax year for zip code 49249, filed in 2005:
Average Adjusted Gross Income (AGI) in 2004: $47,028 (Individual Income Tax Returns)
Here:
$47,028
State:
$48,204
Salary/wage: $44,704 (reported on 82.7% of returns)
Here:
$44,704
State:
$42,791
(% of AGI for various income ranges: 83.5% for AGIs below $10k, 62.4% for AGIs $10k-25k, 75.2% for AGIs $25k-50k, 82.0% for AGIs $50k-75k, 85.0% for AGIs $75k-100k, 77.7% for AGIs over 100k)
Taxable interest for individuals: $1,179 (reported on 50.4% of returns)
This zip code:
$1,179
Michigan:
$1,725
(% of AGI for various income ranges: 6.7% for AGIs below $10k, 4.0% for AGIs $10k-25k, 2.0% for AGIs $25k-50k, 0.8% for AGIs $50k-75k, 0.6% for AGIs $75k-100k, 0.6% for AGIs over 100k)
Taxable dividends: $1,880 (reported on 22.8% of returns)
Here:
$1,880
State:
$3,420
(% of AGI for various income ranges: 2.3% for AGIs below $10k, 2.2% for AGIs $10k-25k, 1.2% for AGIs $25k-50k, 0.4% for AGIs $50k-75k, 0.7% for AGIs $75k-100k, 0.9% for AGIs over 100k)
Net capital gain/loss: +$4,632 (reported on 17.7% of returns)
Here:
+$4,632
State:
+$8,532
(% of AGI for various income ranges: 2.4% for AGIs below $10k, 0.2% for AGIs $10k-25k, 0.0% for AGIs $25k-50k, 0.8% for AGIs $50k-75k, 0.3% for AGIs $75k-100k, 5.0% for AGIs over 100k)
Profit/loss from business: +$6,810 (reported on 15.8% of returns)
Here:
+$6,810
State:
+$9,547
(% of AGI for various income ranges: 10.5% for AGIs below $10k, 5.3% for AGIs $10k-25k, 1.9% for AGIs $25k-50k, 0.3% for AGIs $50k-75k, -0.1% for AGIs $75k-100k, 4.5% for AGIs over 100k)
IRA payment deduction: $2,760 (reported on 1.6% of returns)
49249:
$2,760
Michigan:
$2,875
Total itemized deductions: $15,918 (20% of AGI, reported on 38.2% of returns)
Here:
$15,918
State:
$18,509
Here:
20.1% of AGI
State:
20.7% of AGI
(% of AGI for various income ranges: 24.5% for AGIs below $10k, 10.2% for AGIs $10k-25k, 13.9% for AGIs $25k-50k, 12.3% for AGIs $50k-75k, 15.0% for AGIs $75k-100k, 11.4% for AGIs over 100k)
Charity contributions deductions: $2,062 (2% of AGI, reported on 30.3% of returns)
Here:
$2,062
State:
$3,365
Here:
2.4% of AGI
State:
3.6% of AGI
(% of AGI for various income ranges: 0.6% for AGIs $10k-25k, 1.1% for AGIs $25k-50k, 1.3% for AGIs $50k-75k, 1.4% for AGIs $75k-100k, 1.7% for AGIs over 100k)
Total tax: $6,812 (reported on 77.8% of returns)
49249:
$6,812
State:
$7,691
(% of AGI for various income ranges: 3.7% for AGIs below $10k, 3.8% for AGIs $10k-25k, 6.6% for AGIs $25k-50k, 8.5% for AGIs $50k-75k, 10.0% for AGIs $75k-100k, 19.7% for AGIs over 100k)
Earned income credit: $1,621 (reported on 10.5% of returns)
Here:
$1,621
State:
$1,737
Percentage of individuals using paid preparers for their 2004 taxes: 63.4%
Here:
63%
State:
60%
(% for various income ranges: 54.6% for AGIs below $10k, 63.1% for AGIs $10k-25k, 66.2% for AGIs $25k-50k, 61.0% for AGIs $50k-75k, 69.6% for AGIs $75k-100k, 74.8% for AGIs over 100k)
Likely homosexual households (counted as self-reported same-sex unmarried-partner households)
Lesbian couples: 0.4% of all households
Gay men: 0.0% of all households
Household received Food Stamps/SNAP in the past 12 months: 168 Household did not receive Food Stamps/SNAP in the past 12 months: 1,224
Women who had a birth in the past 12 months: 55 (56 now married, 0 unmarried) Women who did not have a birth in the past 12 months: 462 (193 now married, 268 unmarried)
Housing units in zip code 49249 with a mortgage: 757 (45 second mortgage, 38 both second mortgage and home equity loan) Median monthly owner costs for units with a mortgage: $1,426 Median monthly owner costs for units without a mortgage: $499
Residents with income below the poverty level in 2022:
This zip code:
8.8%
Whole state:
13.4%
Residents with income below 50% of the poverty level in 2022:
This zip code:
6.2%
Whole state:
6.9%
Median number of rooms in houses and condos:
Here:
6.3
State:
6.5
Median number of rooms in apartments:
Here:
5.8
State:
4.3
Notable locations in this zip code not listed on our city pages
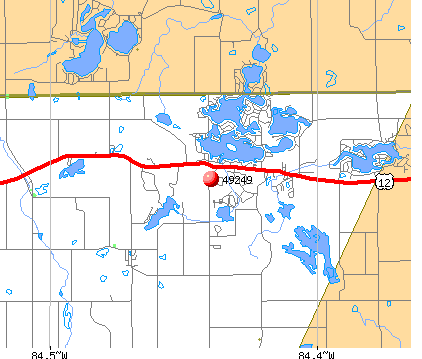
Lakes and reservoirs: Perch Lake (A), Lake Le Ann (B), Mirror Lake (C), Mercer Lakes (D), Grand Lake (E), Goose Lake (F), Braxee Lake (G), Mill Pond (H). Display/hide their locations on the map
In group quarters: 2 (-1 institutionalized population)
Size of family households: 488 2-persons, 282 3-persons, 140 4-persons, 44 5-persons, 16 7-or-more-persons
Size of nonfamily households: 376 1-person, 37 2-persons, 7 4-persons
367 married couples with children.
177 single-parent households (141 men, 36 women).
98.2% of residents of 49249 zip code speak English at home.
0.7% of residents speak other Indo-European language at home (100% very well).
1.1% of residents speak other language at home (100% very well).
Foreign born population: 30 (0.9%) (30.1% of them are naturalized citizens)
This zip code:
0.9%
Whole state:
6.9%
61%Uruguay
23%Sweden
19%United Kingdom, excluding England and Scotland
19%France
29%English
16%German
13%Italian
10%American
9%Irish
5%Lebanese
2%Scottish
Year of entry for the foreign-born population
02010 or later
02000 to 2009
121990 to 1999
14Before 1990
Facilities with environmental interests located in this zip code:
MI DEPT/ENVIRONMENTAL QUALITY (859 WALWORTH RD in JEROME, MI)
Conditionally Exempt Small Quantity Generators, less than 100 kg/month of hazardous waste (Resource Conservation and Recovery Act (tracking hazardous waste)) Organizations: MI DEPT/ENVIRONMENTAL QUALITY STD (CONTACT/OPERATOR)
Alternative names: JEROME COUNTY MARKET
Housing units lacking complete plumbing facilities: 3.1%
47.9%Utility gas
39.5%Bottled, tank, or LP gas
6.0%Wood
5.1%Electricity
1.2%Fuel oil, kerosene, etc.
0.5%No fuel used
Population in 1990: 2,686. Population change in the 1990s: +889 (+33.1%).
Place of birth for U.S.-born residents:
This state: 2,561
Northeast: 27
Midwest: 594
South: 115
West: 12
65% of the 49249 zip code residents lived in the same house 5 years ago. Out of people who lived in different houses, 25% lived in this county. Out of people who lived in different counties, 50% lived in Michigan.
93% of the 49249 zip code residents lived in the same house 1 year ago. Out of people who lived in different houses, 14% moved from this county. Out of people who lived in different houses, 62% moved from different county within same state. Out of people who lived in different houses, 27% moved from different state.
Private vs. public school enrollment:
Students in private schools in grades 1 to 8 (elementary and middle school): 2
Here:
1.7%
Michigan:
12.4%
Students in private schools in grades 9 to 12 (high school):
Here:
0.0%
Michigan:
9.8%
Students in private undergraduate colleges:
Here:
0.0%
Michigan:
14.9%
Occupation by median earnings in the past 12 months ($)
122,822Architecture and engineering occupations
95,174Business and financial operations occupations
90,503Health diagnosing and treating practitioners and other technical occupations
75,423Community and social service occupations
61,278Management occupations
58,210Production occupations
Top industries in this zip code by the number of employees in 2005:
Administrative and Support and Waste Management and Remediation Services: Janitorial Services (10-19 employees: 1 establishment)
Mining: Dimension Stone Mining and Quarrying (10-19: 1)
Administrative and Support and Waste Management and Remediation Services: Landscaping Services (5-9: 1)
Health Care and Social Assistance: Offices of Physicians (except Mental Health Specialists) (5-9: 1)
Other Services (except Public Administration): All Other Personal Services (1-4: 2)
Construction: Plumbing, Heating, and Air-Conditioning Contractors (1-4: 2)
Fatal accident statistics in 2010:
Fatal accident count: 1
Vehicles involved in fatal accidents: 1
Fatal accidents caused by drunken drivers: 0
Fatalities: 1
Persons involved in fatal accidents: 1
Pedestrians involved in fatal accidents: 2
2002 - 2018 National Fire Incident Reporting System (NFIRS) incidents
According to the data from the years 2002 - 2018 the average number of fires per year is 13. The highest number of fire incidents - 29 took place in 2004, and the least - 2 in 2013. The data has a dropping trend.
When looking into fire subcategories, the most incidents belonged to: Outside Fires (46.8%), and Structure Fires (39.1%).
Fire incident types reported to NFIRS in Zip Code 49249

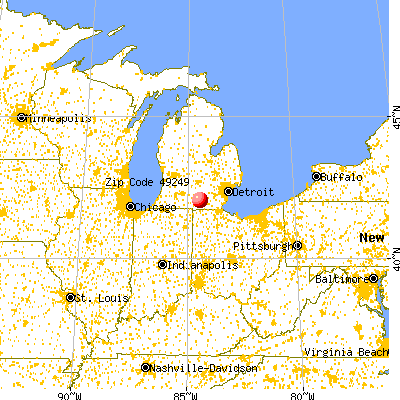


 Nearest zip codes: 49282, 49262, 49233, 49246, 49220, 49234.


 According to the data from the years 2002 - 2018 the average number of fires per year is 13. The highest number of fire incidents - 29 took place in 2004, and the least - 2 in 2013. The data has a dropping trend.
 When looking into fire subcategories, the most incidents belonged to: Outside Fires (46.8%), and Structure Fires (39.1%).