Estimated zip code population in 2022: 3,330 Zip code population in 2010: 2,942 Zip code population in 2000: 2,973
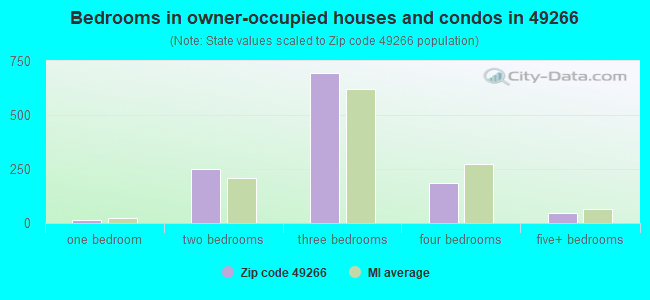
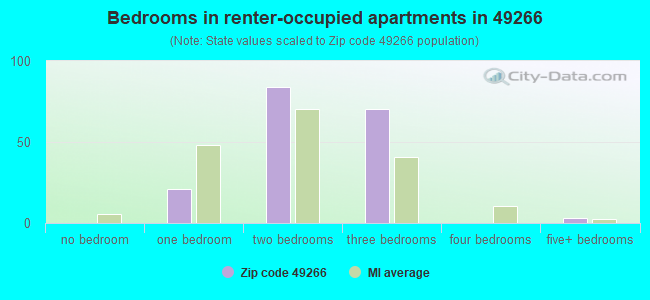
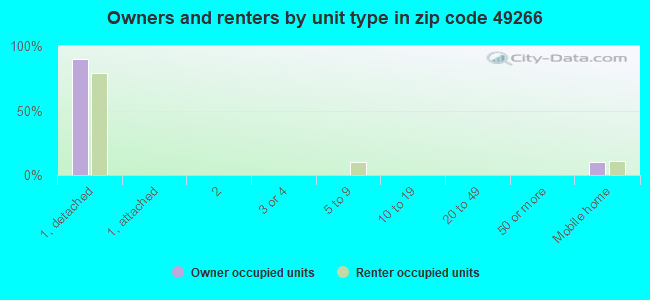
Houses and condos: 1,694 Renter-occupied apartments: 180
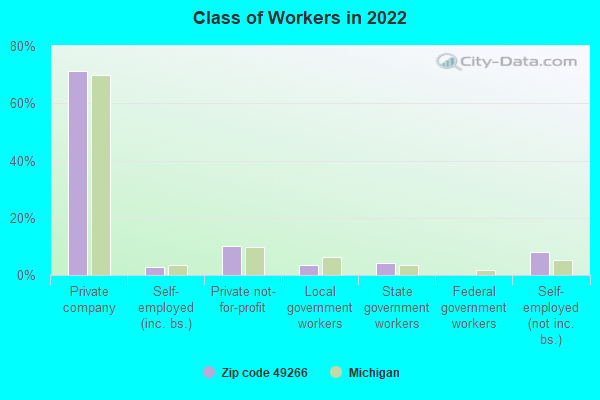
% of renters here:
13%
State:
27%
March 2022 cost of living index in zip code 49266: 80.6 (low, U.S. average is 100)
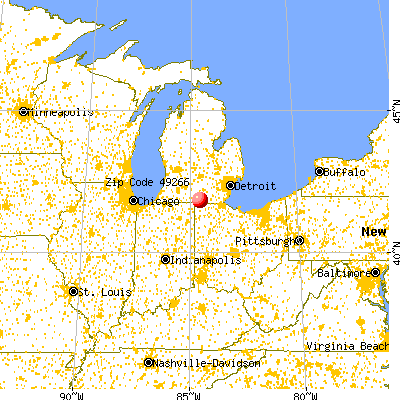
Land area: 44.2 sq. mi. Water area: 0.6 sq. mi.
Population density: 75 people per square mile
(very low).
OSM Map
General Map
Google Map
MSN Map
OSM Map
General Map
Google Map
MSN Map
OSM Map
General Map
Google Map
MSN Map
OSM Map
General Map
Google Map
MSN Map
Please wait while loading the map...
Real estate property taxes paid for housing units in 2022:
This zip code:
0.8% ($1,356)
Michigan:
1.2% ($2,746)
Median real estate property taxes paid for housing units with mortgages in 2022: $1,416 (0.9%) Median real estate property taxes paid for housing units with no mortgage in 2022: $1,308 (0.7%)
Business Search- 14 Million verified businesses
Males: 1,697
(51.0%)
Females: 1,633
(49.0%)
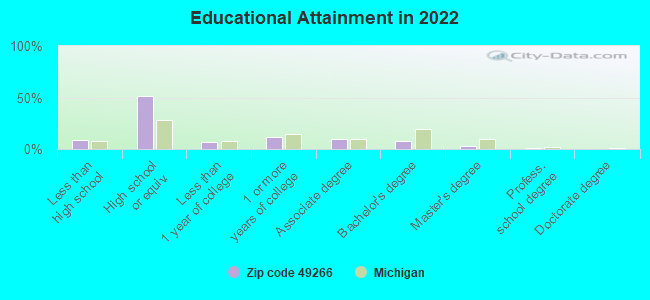
For population 25 years and over in 49266:
High school or higher: 90.1%
Bachelor's degree or higher: 12.0%
Graduate or professional degree: 3.9%
Unemployed: 2.9%
Mean travel time to work (commute): 28.5 minutes
For population 15 years and over in 49266:
Never married: 23.9%
Now married: 54.5%
Separated: 0.2%
Widowed: 8.9%
Divorced: 12.5%
Zip code 49266 compared to state average:
Black race population percentage significantly below state average.
Median age significantly above state average.
Foreign-born population percentage significantly below state average.
Renting percentage below state average.
Length of stay since moving in significantly above state average.
Number of college students below state average.
Percentage of population with a bachelor's degree or higher significantly below state average.
Averages for the 2020 tax year for zip code 49266, filed in 2021:
Average Adjusted Gross Income (AGI) in 2020: $48,358 (Individual Income Tax Returns)
Here:
$48,358
State:
$68,945
Salary/wage: $43,386 (reported on 76.5% of returns)
Here:
$43,386
State:
$57,142
(% of AGI for various income ranges: 989.7% for AGIs below $25k, 3189.2% for AGIs $25k-50k, 6733.1% for AGIs $50k-75k, 11038.8% for AGIs $75k-100k, 13818.8% for AGIs $100k-200k)
Taxable interest for individuals: $585 (reported on 25.0% of returns)
This zip code:
$585
Michigan:
$1,630
(% of AGI for various income ranges: 16.2% for AGIs below $25k, 14.4% for AGIs $25k-50k, 20.8% for AGIs $50k-75k, 62.5% for AGIs $75k-100k, 31.2% for AGIs $100k-200k)
Ordinary dividends: $2,367 (reported on 13.6% of returns)
Here:
$2,367
State:
$6,972
(% of AGI for various income ranges: 21.2% for AGIs below $25k, 23.6% for AGIs $25k-50k, 69.2% for AGIs $50k-75k, 103.8% for AGIs $75k-100k, 152.5% for AGIs $100k-200k)
Net capital gain/loss in AGI: +$3,744 (reported on 13.6% of returns)
Here:
+$3,744
State:
+$20,064
(% of AGI for various income ranges: 11.8% for AGIs below $25k, 23.6% for AGIs $25k-50k, 131.5% for AGIs $50k-75k, 217.5% for AGIs $75k-100k, 287.5% for AGIs $100k-200k)
Profit/loss from business: +$6,385 (reported on 15.2% of returns)
Here:
+$6,385
State:
+$11,172
(% of AGI for various income ranges: 142.9% for AGIs below $25k, 189.2% for AGIs $25k-50k, 38.5% for AGIs $50k-75k, 431.2% for AGIs $75k-100k)
Taxable individual retirement arrangement distribution: $12,529 (reported on 10.6% of returns)
49266:
$12,529
Michigan:
$19,803
(% of AGI for various income ranges: 135.6% for AGIs below $25k, 187.2% for AGIs $25k-50k, 116.9% for AGIs $50k-75k, 841.2% for AGIs $75k-100k)
Total itemized deductions: $28,200 (reported on 1.5% of returns)
Here:
$28,200
State:
$34,117
(% of AGI for various income ranges: 225.6% for AGIs $25k-50k)
Taxes paid: $6,700 (reported on 1.5% of returns)
49266:
$6,700
State:
$7,972
(% of AGI for various income ranges: 53.6% for AGIs $25k-50k)
Earned income credit: $2,405 (reported on 16.7% of returns)
Here:
$2,405
State:
$2,251
(% of AGI for various income ranges: 103.5% for AGIs below $25k, 70.8% for AGIs $25k-50k)
Percentage of individuals using paid preparers for their 2020 taxes: 95.5%
Here:
95%
State:
93%
(% for various income ranges: 94.3% for AGIs below $25k, 97.0% for AGIs $25k-50k, 94.7% for AGIs $50k-75k, 92.9% for AGIs $75k-100k, 100.0% for AGIs $100k-200k, 100.0% for AGIs over 200k)
Averages for the 2012 tax year for zip code 49266, filed in 2013:
Average Adjusted Gross Income (AGI) in 2012: $39,679 (Individual Income Tax Returns)
Here:
$39,679
State:
$55,609
Salary/wage: $35,793 (reported on 78.1% of returns)
Here:
$35,793
State:
$46,782
(% of AGI for various income ranges: 64.9% for AGIs below $25k, 75.2% for AGIs $25k-50k, 74.9% for AGIs $50k-75k, 74.2% for AGIs $75k-100k, 62.9% for AGIs $100k-200k)
Taxable interest for individuals: $697 (reported on 26.6% of returns)
This zip code:
$697
Michigan:
$1,491
(% of AGI for various income ranges: 1.6% for AGIs below $25k, 0.4% for AGIs $25k-50k, 0.2% for AGIs $50k-75k, 0.4% for AGIs $75k-100k, 0.2% for AGIs $100k-200k)
Ordinary dividends: $1,955 (reported on 15.6% of returns)
Here:
$1,955
State:
$6,225
(% of AGI for various income ranges: 1.5% for AGIs below $25k, 0.4% for AGIs $25k-50k, 0.3% for AGIs $50k-75k, 0.7% for AGIs $75k-100k, 1.2% for AGIs $100k-200k)
Net capital gain/loss in AGI: +$93 (reported on 11.7% of returns)
Here:
+$93
State:
+$9,326
(% of AGI for various income ranges: 0.4% for AGIs $100k-200k)
Profit/loss from business: +$7,032 (reported on 14.8% of returns)
Here:
+$7,032
State:
+$11,523
(% of AGI for various income ranges: 6.6% for AGIs below $25k, 2.0% for AGIs $25k-50k, 2.8% for AGIs $50k-75k, 4.4% for AGIs $75k-100k)
Taxable individual retirement arrangement distribution: $11,312 (reported on 13.3% of returns)
49266:
$11,312
Michigan:
$15,298
(% of AGI for various income ranges: 3.6% for AGIs below $25k, 4.0% for AGIs $25k-50k, 2.1% for AGIs $50k-75k, 13.1% for AGIs $75k-100k)
Total itemized deductions: $17,686 (23% of AGI, reported on 17.2% of returns)
Here:
$17,686
State:
$21,628
Here:
22.8% of AGI
State:
18.4% of AGI
(% of AGI for various income ranges: 4.8% for AGIs below $25k, 4.5% for AGIs $25k-50k, 6.0% for AGIs $50k-75k, 9.0% for AGIs $75k-100k, 12.6% for AGIs $100k-200k)
Charity contributions: $3,454 (reported on 10.2% of returns)
Here:
$3,454
State:
$4,225
(% of AGI for various income ranges: 0.7% for AGIs $25k-50k, 0.9% for AGIs $50k-75k, 1.4% for AGIs $75k-100k, 1.2% for AGIs $100k-200k)
Taxes paid: $5,262 (reported on 16.4% of returns)
49266:
$5,262
State:
$8,327
(% of AGI for various income ranges: 0.7% for AGIs below $25k, 1.0% for AGIs $25k-50k, 1.8% for AGIs $50k-75k, 2.8% for AGIs $75k-100k, 4.0% for AGIs $100k-200k)
Earned income credit: $2,054 (reported on 20.3% of returns)
Here:
$2,054
State:
$2,306
(% of AGI for various income ranges: 6.2% for AGIs below $25k, 1.1% for AGIs $25k-50k)
Percentage of individuals using paid preparers for their 2012 taxes: 69.5%
Here:
70%
State:
57%
(% for various income ranges: 65.5% for AGIs below $25k, 68.8% for AGIs $25k-50k, 75.0% for AGIs $50k-75k, 77.8% for AGIs $75k-100k, 77.8% for AGIs $100k-200k)
Averages for the 2004 tax year for zip code 49266, filed in 2005:
Average Adjusted Gross Income (AGI) in 2004: $32,786 (Individual Income Tax Returns)
Here:
$32,786
State:
$48,204
Salary/wage: $30,895 (reported on 82.3% of returns)
Here:
$30,895
State:
$42,791
(% of AGI for various income ranges: 89.9% for AGIs below $10k, 71.6% for AGIs $10k-25k, 80.9% for AGIs $25k-50k, 86.5% for AGIs $50k-75k, 83.0% for AGIs $75k-100k, 56.1% for AGIs over 100k)
Taxable interest for individuals: $869 (reported on 39.0% of returns)
This zip code:
$869
Michigan:
$1,725
(% of AGI for various income ranges: 7.1% for AGIs below $10k, 1.9% for AGIs $10k-25k, 0.9% for AGIs $25k-50k, 0.4% for AGIs $50k-75k, 0.4% for AGIs $75k-100k, 1.0% for AGIs over 100k)
Taxable dividends: $932 (reported on 16.1% of returns)
Here:
$932
State:
$3,420
(% of AGI for various income ranges: 3.6% for AGIs below $10k, 0.4% for AGIs $10k-25k, 0.5% for AGIs $25k-50k, 0.2% for AGIs $50k-75k, 0.2% for AGIs $75k-100k, 0.5% for AGIs over 100k)
Net capital gain/loss: +$3,374 (reported on 11.9% of returns)
Here:
+$3,374
State:
+$8,532
(% of AGI for various income ranges: -2.7% for AGIs below $10k, 0.2% for AGIs $10k-25k, 1.3% for AGIs $25k-50k, -0.0% for AGIs $50k-75k, 2.9% for AGIs $75k-100k, 3.4% for AGIs over 100k)
Profit/loss from business: +$4,440 (reported on 16.9% of returns)
Here:
+$4,440
State:
+$9,547
(% of AGI for various income ranges: 9.3% for AGIs below $10k, 6.6% for AGIs $10k-25k, 2.4% for AGIs $25k-50k, 1.2% for AGIs $50k-75k, 0.9% for AGIs $75k-100k)
IRA payment deduction: $2,632 (reported on 1.4% of returns)
49266:
$2,632
Michigan:
$2,875
Total itemized deductions: $14,203 (21% of AGI, reported on 17.6% of returns)
Here:
$14,203
State:
$18,509
Here:
21.0% of AGI
State:
20.7% of AGI
(% of AGI for various income ranges: 4.7% for AGIs $10k-25k, 6.4% for AGIs $25k-50k, 7.8% for AGIs $50k-75k, 10.6% for AGIs $75k-100k, 11.1% for AGIs over 100k)
Charity contributions deductions: $2,631 (4% of AGI, reported on 12.9% of returns)
Here:
$2,631
State:
$3,365
Here:
3.5% of AGI
State:
3.6% of AGI
(% of AGI for various income ranges: 0.3% for AGIs $10k-25k, 0.8% for AGIs $25k-50k, 0.8% for AGIs $50k-75k, 1.3% for AGIs $75k-100k, 2.6% for AGIs over 100k)
Total tax: $4,028 (reported on 70.4% of returns)
49266:
$4,028
State:
$7,691
(% of AGI for various income ranges: 3.2% for AGIs below $10k, 3.9% for AGIs $10k-25k, 6.3% for AGIs $25k-50k, 8.2% for AGIs $50k-75k, 10.5% for AGIs $75k-100k, 17.6% for AGIs over 100k)
Earned income credit: $1,571 (reported on 20.1% of returns)
Here:
$1,571
State:
$1,737
Percentage of individuals using paid preparers for their 2004 taxes: 74.4%
Here:
74%
State:
60%
(% for various income ranges: 71.3% for AGIs below $10k, 75.5% for AGIs $10k-25k, 74.9% for AGIs $25k-50k, 74.2% for AGIs $50k-75k, 81.2% for AGIs $75k-100k, 75.6% for AGIs over 100k)
Household received Food Stamps/SNAP in the past 12 months: 107 Household did not receive Food Stamps/SNAP in the past 12 months: 1,254
Women who had a birth in the past 12 months: 1 (1 now married, 0 unmarried) Women who did not have a birth in the past 12 months: 626 (300 now married, 324 unmarried)
Housing units in zip code 49266 with a mortgage: 589 (28 second mortgage, 29 both second mortgage and home equity loan) Houses without a mortgage: 25
Median monthly owner costs for units with a mortgage: $1,064 Median monthly owner costs for units without a mortgage: $429
Residents with income below the poverty level in 2022:
This zip code:
6.6%
Whole state:
13.4%
Residents with income below 50% of the poverty level in 2022:
This zip code:
3.8%
Whole state:
6.9%
Median number of rooms in houses and condos:
Here:
6.2
State:
6.5
Median number of rooms in apartments:
Here:
6.0
State:
4.3
Notable locations in this zip code not listed on our city pages
Churches in zip code 49266 include: Bird Lake Wesleyan Missionary Church (A), Osseo Free Will Baptist Church (B), Osseo Methodist Church (C), Osseo First Baptist Church (D). Display/hide their locations on the map
In group quarters: 7 (-1 institutionalized population)
Size of family households: 490 2-persons, 233 3-persons, 89 4-persons, 7 5-persons, 97 6-persons, 4 7-or-more-persons
Size of nonfamily households: 329 1-person, 117 2-persons
277 married couples with children.
5 single-parent households (5 men).
99.3% of residents of 49266 zip code speak English at home.
0.6% of residents speak Spanish at home (100% very well).
0.3% of residents speak other Indo-European language at home (100% very well).
Foreign born population: 0 (0.0%)
:
0.0%
Whole state:
6.9%
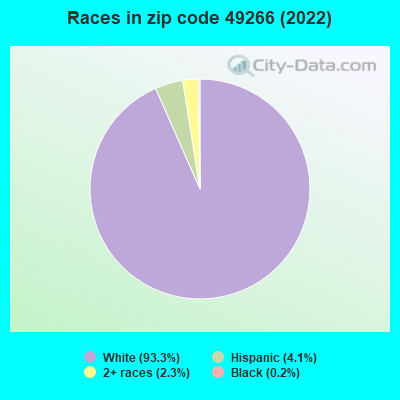
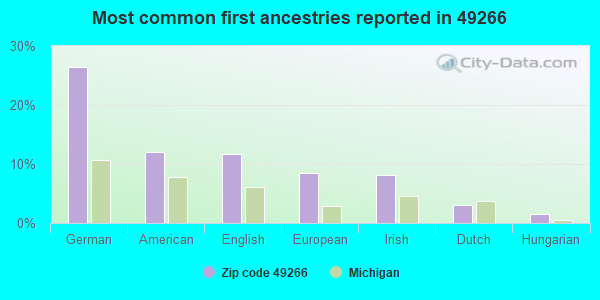
26%German
12%American
12%English
9%European
8%Irish
3%Dutch
2%Hungarian
Facilities with environmental interests located in this zip code:
BIO CENOTICS, INC (4880 HUDSON RD in OSSEO, MI)
COMPLIANCE ACTIVITY (Tracking inspections of insecticide, fungicide, and rodenticide, and toxic substances)
Housing units lacking complete plumbing facilities: 0.1% Housing units lacking complete kitchen facilities: 0.1%
52.8%Bottled, tank, or LP gas
28.6%Utility gas
9.4%Wood
6.1%Fuel oil, kerosene, etc.
2.8%Electricity
Population in 1990: 7,025.
Place of birth for U.S.-born residents:
This state: 2,361
Northeast: 47
Midwest: 535
South: 265
West: 126
64% of the 49266 zip code residents lived in the same house 5 years ago. Out of people who lived in different houses, 67% lived in this county. Out of people who lived in different counties, 50% lived in Michigan.
96% of the 49266 zip code residents lived in the same house 1 year ago. Out of people who lived in different houses, 55% moved from this county. Out of people who lived in different houses, 6% moved from different county within same state. Out of people who lived in different houses, 49% moved from different state.
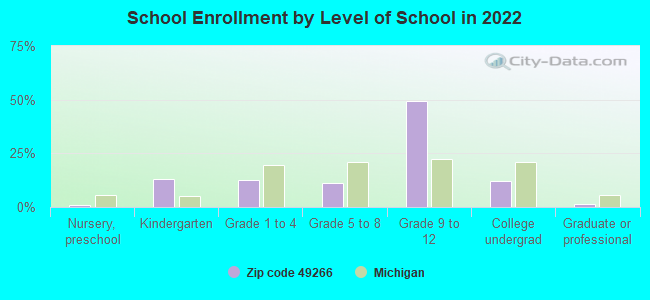
Private vs. public school enrollment:
Students in private schools in grades 1 to 8 (elementary and middle school): 32
Here:
31.6%
Michigan:
12.4%
Students in private schools in grades 9 to 12 (high school): 21
Here:
10.4%
Michigan:
9.8%
Students in private undergraduate colleges: 11
Here:
23.1%
Michigan:
14.9%
Occupation by median earnings in the past 12 months ($)
74,822Architecture and engineering occupations
51,835Management occupations
44,614Office and administrative support occupations
44,448Material moving occupations
42,024Installation, maintenance, and repair occupations
38,804Production occupations
Top industries in this zip code by the number of employees in 2005:
Wholesale Trade: Construction and Mining (except Oil Well) Machinery and Equipment Merchant Wholesalers (10-19 employees: 1 establishment)
Other Services (except Public Administration): Environment, Conservation and Wildlife Organizations (5-9: 1)
Accommodation and Food Services: Full-Service Restaurants (5-9: 1)
Construction: Water and Sewer Line and Related Structures Construction (5-9: 1)
People in group quarters in 2010:
9 people in group homes intended for adults
2 people in nursing facilities/skilled-nursing facilities
People in group quarters in 2000:
8 people in other noninstitutional group quarters
2 people in other group homes
Fatal accident statistics in 2014:
Fatal accident count: 1
Vehicles involved in fatal accidents: 1
Fatal accidents caused by drunken drivers: 1
Fatalities: 1
Persons involved in fatal accidents: 1
Pedestrians involved in fatal accidents: 0
Fatal accident statistics in 2012:
Fatal accident count: 1
Vehicles involved in fatal accidents: 1
Fatal accidents caused by drunken drivers: 1
Fatalities: 1
Persons involved in fatal accidents: 2
Pedestrians involved in fatal accidents: 0
2002 - 2018 National Fire Incident Reporting System (NFIRS) incidents
According to the data from the years 2002 - 2018 the average number of fires per year is 9. The highest number of fire incidents - 23 took place in 2005, and the least - 0 in 2017. The data has a dropping trend.
When looking into fire subcategories, the most incidents belonged to: Outside Fires (51.0%), and Structure Fires (33.6%).
Fire incident types reported to NFIRS in Zip Code 49266


 Nearest zip codes: 49242, 49271, 49262, 49232, 49288, 43554.


 According to the data from the years 2002 - 2018 the average number of fires per year is 9. The highest number of fire incidents - 23 took place in 2005, and the least - 0 in 2017. The data has a dropping trend.
 When looking into fire subcategories, the most incidents belonged to: Outside Fires (51.0%), and Structure Fires (33.6%).