Estimated zip code population in 2022: 1,761 Zip code population in 2010: 1,851 Zip code population in 2000: 1,835
Houses and condos: 1,053 Renter-occupied apartments: 56
% of renters here:
8%
State:
27%
March 2022 cost of living index in zip code 49774: 81.0 (low, U.S. average is 100)
Land area: 161.2 sq. mi. Water area: 29.3 sq. mi.
Population density: 11 people per square mile
(very low).
OSM Map
General Map
Google Map
MSN Map
OSM Map
General Map
Google Map
MSN Map
OSM Map
General Map
Google Map
MSN Map
OSM Map
General Map
Google Map
MSN Map
Please wait while loading the map...
Real estate property taxes paid for housing units in 2022:
This zip code:
1.0% ($1,769)
Michigan:
1.2% ($2,746)
Median real estate property taxes paid for housing units with mortgages in 2022: $2,066 (1.2%) Median real estate property taxes paid for housing units with no mortgage in 2022: $1,464 (0.9%)
Business Search- 14 Million verified businesses
Males: 910
(51.7%)
Females: 851
(48.3%)
For population 25 years and over in 49774:
High school or higher: 96.0%
Bachelor's degree or higher: 22.8%
Graduate or professional degree: 3.7%
Unemployed: 2.1%
Mean travel time to work (commute): 21.3 minutes
For population 15 years and over in 49774:
Never married: 18.2%
Now married: 68.9%
Separated: 1.0%
Widowed: 5.2%
Divorced: 6.6%
Zip code 49774 compared to state average:
Unemployed percentage below state average.
Black race population percentage significantly below state average.
Hispanic race population percentage significantly below state average.
Foreign-born population percentage significantly below state average.
Renting percentage significantly below state average.
Length of stay since moving in significantly above state average.
Estimated median house/condo value in 2022: $170,615
49774:
$170,615
Michigan:
$224,400
According to our research of Michigan and other state lists, there were 4 registered sex offenders living in 49774 zip code as of June 19, 2024. The ratio of all residents to sex offenders in zip code 49774 is 510 to 1. The ratio of registered sex offenders to all residents in this zip code is lower than the state average.
Median resident age:
This zip code:
41.8 years
Michigan median age:
40.3 years
Average household size:
This zip code:
2.4 people
Michigan:
2.4 people
Averages for the 2020 tax year for zip code 49774, filed in 2021:
Average Adjusted Gross Income (AGI) in 2020: $54,599 (Individual Income Tax Returns)
Here:
$54,599
State:
$68,945
Salary/wage: $47,913 (reported on 74.4% of returns)
Here:
$47,913
State:
$57,142
(% of AGI for various income ranges: 940.0% for AGIs below $25k, 3155.6% for AGIs $25k-50k, 4976.4% for AGIs $50k-75k, 7862.5% for AGIs $75k-100k, 16526.2% for AGIs $100k-200k)
Taxable interest for individuals: $484 (reported on 34.4% of returns)
This zip code:
$484
Michigan:
$1,630
(% of AGI for various income ranges: 12.3% for AGIs below $25k, 18.1% for AGIs $25k-50k, 12.7% for AGIs $50k-75k, 28.7% for AGIs $75k-100k, 71.2% for AGIs $100k-200k)
Ordinary dividends: $2,600 (reported on 15.6% of returns)
Here:
$2,600
State:
$6,972
(% of AGI for various income ranges: 11.8% for AGIs below $25k, 23.1% for AGIs $25k-50k, 54.5% for AGIs $50k-75k, 301.2% for AGIs $100k-200k)
Net capital gain/loss in AGI: +$6,775 (reported on 13.3% of returns)
Here:
+$6,775
State:
+$20,064
(% of AGI for various income ranges: 15.9% for AGIs below $25k, 26.2% for AGIs $25k-50k, 227.3% for AGIs $50k-75k, 607.5% for AGIs $100k-200k)
Profit/loss from business: +$7,670 (reported on 11.1% of returns)
Here:
+$7,670
State:
+$11,172
(% of AGI for various income ranges: 44.5% for AGIs below $25k, 103.8% for AGIs $25k-50k, 628.8% for AGIs $75k-100k)
Taxable individual retirement arrangement distribution: $15,140 (reported on 11.1% of returns)
49774:
$15,140
Michigan:
$19,803
(% of AGI for various income ranges: 138.2% for AGIs below $25k, 131.2% for AGIs $25k-50k, 264.5% for AGIs $50k-75k, 886.3% for AGIs $75k-100k)
Earned income credit: $2,010 (reported on 11.1% of returns)
Here:
$2,010
State:
$2,251
(% of AGI for various income ranges: 50.9% for AGIs below $25k, 55.6% for AGIs $25k-50k)
Percentage of individuals using paid preparers for their 2020 taxes: 95.6%
Here:
96%
State:
93%
(% for various income ranges: 96.7% for AGIs below $25k, 95.2% for AGIs $25k-50k, 100.0% for AGIs $50k-75k, 90.9% for AGIs $75k-100k, 92.9% for AGIs $100k-200k)
Averages for the 2012 tax year for zip code 49774, filed in 2013:
Average Adjusted Gross Income (AGI) in 2012: $44,383 (Individual Income Tax Returns)
Here:
$44,383
State:
$55,609
Salary/wage: $39,255 (reported on 79.3% of returns)
Here:
$39,255
State:
$46,782
(% of AGI for various income ranges: 64.2% for AGIs below $25k, 71.6% for AGIs $25k-50k, 71.4% for AGIs $50k-75k, 74.6% for AGIs $75k-100k, 66.4% for AGIs $100k-200k)
Taxable interest for individuals: $774 (reported on 39.1% of returns)
This zip code:
$774
Michigan:
$1,491
(% of AGI for various income ranges: 2.2% for AGIs below $25k, 0.6% for AGIs $25k-50k, 0.7% for AGIs $50k-75k, 0.4% for AGIs $75k-100k, 0.4% for AGIs $100k-200k)
Ordinary dividends: $2,312 (reported on 18.4% of returns)
Here:
$2,312
State:
$6,225
(% of AGI for various income ranges: 1.1% for AGIs below $25k, 1.3% for AGIs $25k-50k, 1.0% for AGIs $50k-75k, 0.4% for AGIs $75k-100k, 1.1% for AGIs $100k-200k)
Net capital gain/loss in AGI: +$2,507 (reported on 16.1% of returns)
Here:
+$2,507
State:
+$9,326
(% of AGI for various income ranges: 1.1% for AGIs $25k-50k, 1.4% for AGIs $50k-75k, 2.0% for AGIs $75k-100k)
Profit/loss from business: +$4,325 (reported on 13.8% of returns)
Here:
+$4,325
State:
+$11,523
(% of AGI for various income ranges: 4.0% for AGIs below $25k, 4.2% for AGIs $25k-50k, 0.4% for AGIs $50k-75k, 0.5% for AGIs $75k-100k)
Taxable individual retirement arrangement distribution: $13,783 (reported on 13.8% of returns)
49774:
$13,783
Michigan:
$15,298
(% of AGI for various income ranges: 11.5% for AGIs below $25k, 3.4% for AGIs $50k-75k, 10.9% for AGIs $75k-100k)
Total itemized deductions: $14,924 (19% of AGI, reported on 19.5% of returns)
Here:
$14,924
State:
$21,628
Here:
19.2% of AGI
State:
18.4% of AGI
(% of AGI for various income ranges: 6.1% for AGIs below $25k, 5.3% for AGIs $25k-50k, 5.3% for AGIs $50k-75k, 5.9% for AGIs $75k-100k, 9.4% for AGIs $100k-200k)
Charity contributions: $2,525 (reported on 13.8% of returns)
Here:
$2,525
State:
$4,225
(% of AGI for various income ranges: 1.6% for AGIs below $25k, 0.8% for AGIs $50k-75k, 1.0% for AGIs $75k-100k, 0.8% for AGIs $100k-200k)
Taxes paid: $5,176 (reported on 19.5% of returns)
49774:
$5,176
State:
$8,327
(% of AGI for various income ranges: 1.4% for AGIs below $25k, 1.6% for AGIs $25k-50k, 1.7% for AGIs $50k-75k, 2.0% for AGIs $75k-100k, 3.8% for AGIs $100k-200k)
Earned income credit: $2,162 (reported on 14.9% of returns)
Here:
$2,162
State:
$2,306
(% of AGI for various income ranges: 5.1% for AGIs below $25k, 1.3% for AGIs $25k-50k)
Percentage of individuals using paid preparers for their 2012 taxes: 71.3%
Here:
71%
State:
57%
(% for various income ranges: 67.6% for AGIs below $25k, 70.0% for AGIs $25k-50k, 75.0% for AGIs $50k-75k, 70.0% for AGIs $75k-100k, 85.7% for AGIs $100k-200k)
Averages for the 2004 tax year for zip code 49774, filed in 2005:
Average Adjusted Gross Income (AGI) in 2004: $35,464 (Individual Income Tax Returns)
Here:
$35,464
State:
$48,204
Salary/wage: $33,594 (reported on 81.3% of returns)
Here:
$33,594
State:
$42,791
(% of AGI for various income ranges: 95.1% for AGIs below $10k, 66.3% for AGIs $10k-25k, 79.5% for AGIs $25k-50k, 81.4% for AGIs $50k-75k, 85.1% for AGIs $75k-100k, 60.4% for AGIs over 100k)
Taxable interest for individuals: $1,024 (reported on 59.9% of returns)
This zip code:
$1,024
Michigan:
$1,725
(% of AGI for various income ranges: 5.0% for AGIs below $10k, 4.2% for AGIs $10k-25k, 1.3% for AGIs $25k-50k, 0.9% for AGIs $50k-75k, 0.6% for AGIs $75k-100k, 2.7% for AGIs over 100k)
Taxable dividends: $1,012 (reported on 20.5% of returns)
Here:
$1,012
State:
$3,420
(% of AGI for various income ranges: 1.4% for AGIs below $10k, 1.0% for AGIs $10k-25k, 0.5% for AGIs $25k-50k, 0.6% for AGIs $50k-75k, 0.2% for AGIs $75k-100k, 0.5% for AGIs over 100k)
Net capital gain/loss: +$3,900 (reported on 16.9% of returns)
Here:
+$3,900
State:
+$8,532
(% of AGI for various income ranges: -1.0% for AGIs below $10k, 1.6% for AGIs $10k-25k, 1.5% for AGIs $25k-50k, 1.6% for AGIs $50k-75k, 3.2% for AGIs $75k-100k, 2.6% for AGIs over 100k)
Profit/loss from business: +$2,308 (reported on 16.0% of returns)
Here:
+$2,308
State:
+$9,547
(% of AGI for various income ranges: 0.6% for AGIs below $10k, 3.1% for AGIs $10k-25k, 0.3% for AGIs $25k-50k, 0.3% for AGIs $50k-75k, 2.9% for AGIs $75k-100k)
IRA payment deduction: $3,000 (reported on 3.0% of returns)
49774:
$3,000
Michigan:
$2,875
Total itemized deductions: $13,964 (22% of AGI, reported on 20.4% of returns)
Here:
$13,964
State:
$18,509
Here:
22.1% of AGI
State:
20.7% of AGI
(% of AGI for various income ranges: 7.2% for AGIs $10k-25k, 5.5% for AGIs $25k-50k, 8.6% for AGIs $50k-75k, 10.7% for AGIs $75k-100k, 11.7% for AGIs over 100k)
Charity contributions deductions: $2,833 (4% of AGI, reported on 17.3% of returns)
Here:
$2,833
State:
$3,365
Here:
4.2% of AGI
State:
3.6% of AGI
(% of AGI for various income ranges: 1.5% for AGIs $10k-25k, 0.8% for AGIs $25k-50k, 1.3% for AGIs $50k-75k, 1.4% for AGIs $75k-100k, 2.8% for AGIs over 100k)
Total tax: $3,808 (reported on 71.7% of returns)
49774:
$3,808
State:
$7,691
(% of AGI for various income ranges: 2.0% for AGIs below $10k, 3.8% for AGIs $10k-25k, 5.7% for AGIs $25k-50k, 7.7% for AGIs $50k-75k, 9.1% for AGIs $75k-100k, 15.8% for AGIs over 100k)
Earned income credit: $1,655 (reported on 13.3% of returns)
Here:
$1,655
State:
$1,737
Percentage of individuals using paid preparers for their 2004 taxes: 66.0%
Here:
66%
State:
60%
(% for various income ranges: 57.9% for AGIs below $10k, 66.7% for AGIs $10k-25k, 69.4% for AGIs $25k-50k, 70.2% for AGIs $50k-75k, 59.2% for AGIs $75k-100k, 73.1% for AGIs over 100k)
Household received Food Stamps/SNAP in the past 12 months: 45 Household did not receive Food Stamps/SNAP in the past 12 months: 675
Women who had a birth in the past 12 months: 3 (3 now married, 0 unmarried) Women who did not have a birth in the past 12 months: 283 (178 now married, 104 unmarried)
Housing units in zip code 49774 with a mortgage: 401 (18 second mortgage, 13 both second mortgage and home equity loan) Houses without a mortgage: 30
Median monthly owner costs for units with a mortgage: $1,295 Median monthly owner costs for units without a mortgage: $432
Residents with income below the poverty level in 2022:
This zip code:
6.8%
Whole state:
13.4%
Residents with income below 50% of the poverty level in 2022:
This zip code:
5.0%
Whole state:
6.9%
Median number of rooms in houses and condos:
Here:
6.0
State:
6.5
Median number of rooms in apartments:
Here:
4.9
State:
4.3
Notable locations in this zip code not listed on our city pages
Notable locations in zip code 49774: Munuscong State Forest Campgrounds (A), Munuscong Golf Course (B), Northwoods Camp (C), Pickford Township Hall (D), Pickford Township Volunteer Fire Department / Volunteer Ambulance Corporation (E). Display/hide their locations on the map
Churches in zip code 49774 include: Saint Mathias Church (A), Pickford Church of the Nazarene (B), Pickford Presbyterian Church (C), United Methodist Church (D), North Hills Baptist Church (E). Display/hide their locations on the map
Cemeteries: Hannah Cemetery (1), Rockview Cemetery (2), Fairview Cemetery (3), Old Keldon Cemetery (4), Gray Cemetery (5), Bethel Cemetery (6), Cottle Cemetery (7). Display/hide their locations on the map
Rivers and creeks: Parker Creek (A), Gogomain River (B), Demoreux Creek (C), Taylor Creek (D), Hannah Creek (E), Munuscong River (F), School Creek (G), Sanderson Creek (H), Rapson Creek (I). Display/hide their locations on the map
In group quarters: 1 (-1 institutionalized population)
Size of family households: 278 2-persons, 109 3-persons, 133 4-persons, 20 5-persons, 6 6-persons
Size of nonfamily households: 164 1-person, 2 2-persons, 5 3-persons
376 married couples with children.
41 single-parent households (25 men, 16 women).
98.9% of residents of 49774 zip code speak English at home.
0.2% of residents speak Spanish at home (33% very well, 67% well).
0.8% of residents speak other Indo-European language at home (100% very well).
Foreign born population: 51 (2.9%) (63.9% of them are naturalized citizens)
This zip code:
2.9%
Whole state:
6.9%
12%Poland
8%Honduras
4%Denmark
4%France
2%Japan
2%Malaysia
17%English
13%American
12%Dutch
8%Polish
7%German
5%French
4%Irish
Year of entry for the foreign-born population
92010 or later
32000 to 2009
201990 to 1999
30Before 1990
Facilities with environmental interests located in this zip code:
MI DEPT/TRANSPORTATION BRIDGE B01-17043 (M-48/E BR MUNUSCONG RIVER in PICKFORD, MI)
(Resource Conservation and Recovery Act (tracking hazardous waste)) Organizations: MICH DEPT OF TRANSPORTATION (CONTACT/OPERATOR)
Housing units lacking complete plumbing facilities: 8.2% Housing units lacking complete kitchen facilities: 8.0%
45.9%Bottled, tank, or LP gas
21.4%Wood
17.6%Fuel oil, kerosene, etc.
11.1%Electricity
2.8%Other fuel
1.3%Utility gas
Population in 1990: 624. Population change in the 1990s: +1,211 (+194.1%).
Place of birth for U.S.-born residents:
This state: 1,520
Northeast: 13
Midwest: 102
South: 43
West: 10
69% of the 49774 zip code residents lived in the same house 5 years ago. Out of people who lived in different houses, 56% lived in this county. Out of people who lived in different counties, 50% lived in Michigan.
94% of the 49774 zip code residents lived in the same house 1 year ago. Out of people who lived in different houses, 36% moved from this county. Out of people who lived in different houses, 42% moved from different county within same state. Out of people who lived in different houses, 18% moved from different state. Out of people who lived in different houses, 5% moved from abroad.
Private vs. public school enrollment:
Students in private schools in grades 1 to 8 (elementary and middle school): 3
Here:
1.7%
Michigan:
12.4%
Students in private schools in grades 9 to 12 (high school):
Here:
0.0%
Michigan:
9.8%
Students in private undergraduate colleges:
Here:
1.4%
Michigan:
14.9%
Occupation by median earnings in the past 12 months ($)
99,629Architecture and engineering occupations
88,696Transportation occupations
71,578Law enforcement workers including supervisors
69,338Health diagnosing and treating practitioners and other technical occupations
64,835Farming, fishing, and forestry occupations
57,990Arts, design, entertainment, sports, and media occupations
Top industries in this zip code by the number of employees in 2005:

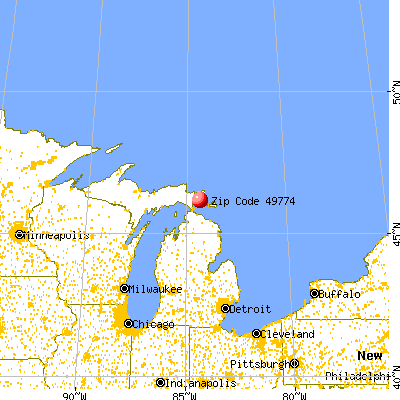


 Nearest zip codes: 49752, 49719, 49710, 49724, 49788, 49745.


