Estimated zip code population in 2022: 1,264 Zip code population in 2010: 913 Zip code population in 2000: 952
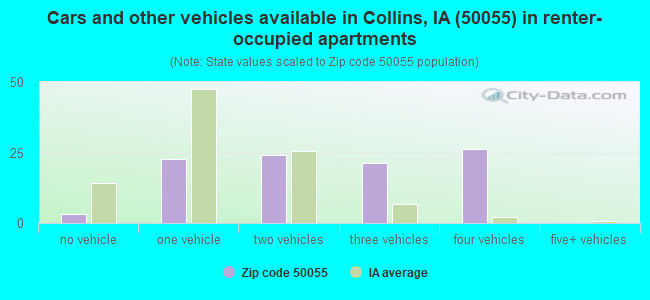
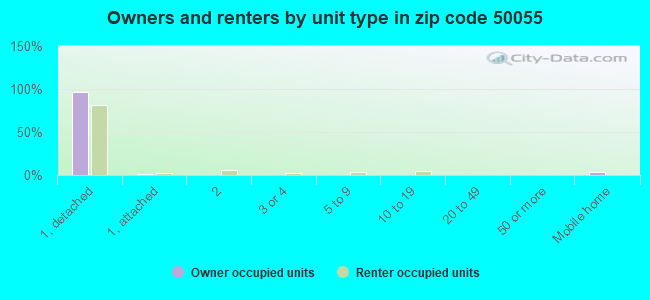
Houses and condos: 485 Renter-occupied apartments: 100
% of renters here:
21%
State:
28%
March 2022 cost of living index in zip code 50055: 82.3 (low, U.S. average is 100)
Land area: 48.7 sq. mi. Water area: 0.1 sq. mi.
Population density: 26 people per square mile
(very low).
OSM Map
General Map
Google Map
MSN Map
OSM Map
General Map
Google Map
MSN Map
OSM Map
General Map
Google Map
MSN Map
OSM Map
General Map
Google Map
MSN Map
Please wait while loading the map...
Real estate property taxes paid for housing units in 2022:
This zip code:
1.2% ($2,582)
Iowa:
1.4% ($2,724)
Median real estate property taxes paid for housing units with mortgages in 2022: $3,122 (1.2%) Median real estate property taxes paid for housing units with no mortgage in 2022: $2,162 (1.4%)
Business Search- 14 Million verified businesses
Males: 656
(51.9%)
Females: 607
(48.1%)
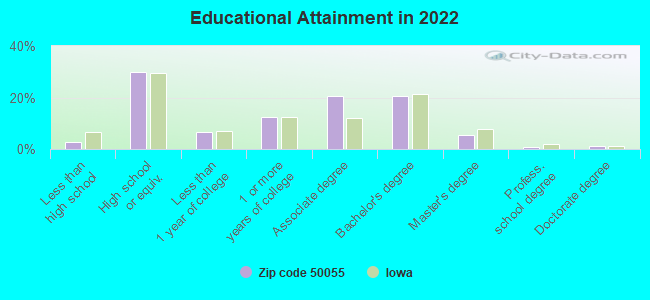
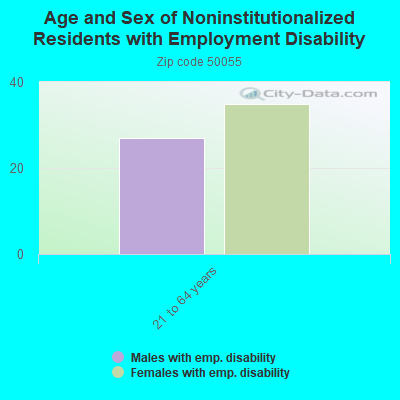
For population 25 years and over in 50055:
High school or higher: 96.5%
Bachelor's degree or higher: 27.9%
Graduate or professional degree: 7.6%
Unemployed: 1.4%
Mean travel time to work (commute): 34.5 minutes
For population 15 years and over in 50055:
Never married: 18.6%
Now married: 68.0%
Separated: 0.9%
Widowed: 3.0%
Divorced: 9.5%
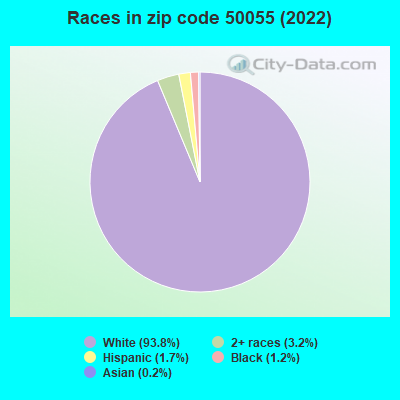
Zip code 50055 compared to state average:
Unemployed percentage below state average.
Black race population percentage significantly below state average.
Hispanic race population percentage significantly below state average.
Foreign-born population percentage significantly below state average.
Length of stay since moving in significantly above state average.
Estimated median house/condo value in 2022: $211,853
50055:
$211,853
Iowa:
$194,600
According to our research of Iowa and other state lists, there was 1 registered sex offender living in 50055 zip code as of June 19, 2024. The ratio of all residents to sex offenders in zip code 50055 is 930 to 1. The ratio of registered sex offenders to all residents in this zip code is lower than the state average.
Median resident age:
This zip code:
39.6 years
Iowa median age:
38.9 years
Average household size:
This zip code:
2.6 people
Iowa:
2.3 people
Averages for the 2020 tax year for zip code 50055, filed in 2021:
Average Adjusted Gross Income (AGI) in 2020: $62,752 (Individual Income Tax Returns)
Here:
$62,752
State:
$71,087
Salary/wage: $54,718 (reported on 84.8% of returns)
Here:
$54,718
State:
$57,361
(% of AGI for various income ranges: 1164.4% for AGIs below $25k, 3857.1% for AGIs $25k-50k, 5914.3% for AGIs $50k-75k, 11517.5% for AGIs $75k-100k, 17690.0% for AGIs $100k-200k)
Taxable interest for individuals: $847 (reported on 32.6% of returns)
This zip code:
$847
Iowa:
$1,633
(% of AGI for various income ranges: 88.6% for AGIs $25k-50k, 27.1% for AGIs $50k-75k, 57.5% for AGIs $75k-100k, 46.0% for AGIs $100k-200k)
Ordinary dividends: $1,343 (reported on 15.2% of returns)
Here:
$1,343
State:
$5,432
(% of AGI for various income ranges: 112.9% for AGIs $25k-50k, 30.0% for AGIs $100k-200k)
Net capital gain/loss in AGI: +$1,540 (reported on 10.9% of returns)
Here:
+$1,540
State:
+$15,243
(% of AGI for various income ranges: 68.6% for AGIs $25k-50k, 58.0% for AGIs $100k-200k)
Profit/loss from business: +$6,120 (reported on 10.9% of returns)
Here:
+$6,120
State:
+$11,763
(% of AGI for various income ranges: 157.1% for AGIs $25k-50k, 392.0% for AGIs $100k-200k)
Taxable individual retirement arrangement distribution: $9,100 (reported on 8.7% of returns)
50055:
$9,100
Iowa:
$17,324
(% of AGI for various income ranges: 520.0% for AGIs $50k-75k)
Total itemized deductions: $22,167 (reported on 6.5% of returns)
Here:
$22,167
State:
$33,775
(% of AGI for various income ranges: 1662.5% for AGIs $75k-100k)
Earned income credit: $1,980 (reported on 10.9% of returns)
Here:
$1,980
State:
$2,195
(% of AGI for various income ranges: 58.9% for AGIs below $25k, 65.7% for AGIs $25k-50k)
Percentage of individuals using paid preparers for their 2020 taxes: 95.7%
Here:
96%
State:
95%
(% for various income ranges: 92.3% for AGIs below $25k, 90.0% for AGIs $25k-50k, 100.0% for AGIs $50k-75k, 100.0% for AGIs $75k-100k, 100.0% for AGIs $100k-200k)
Averages for the 2012 tax year for zip code 50055, filed in 2013:
Average Adjusted Gross Income (AGI) in 2012: $52,733 (Individual Income Tax Returns)
Here:
$52,733
State:
$58,860
Salary/wage: $42,437 (reported on 88.4% of returns)
Here:
$42,437
State:
$46,659
(% of AGI for various income ranges: 69.2% for AGIs below $25k, 72.1% for AGIs $25k-50k, 77.4% for AGIs $50k-75k, 81.8% for AGIs $75k-100k, 56.6% for AGIs $100k-200k)
Taxable interest for individuals: $700 (reported on 41.9% of returns)
This zip code:
$700
Iowa:
$1,537
(% of AGI for various income ranges: 1.0% for AGIs below $25k, 1.2% for AGIs $25k-50k, 0.4% for AGIs $50k-75k, 0.2% for AGIs $75k-100k, 0.5% for AGIs $100k-200k)
Ordinary dividends: $1,338 (reported on 18.6% of returns)
Here:
$1,338
State:
$4,542
(% of AGI for various income ranges: 1.2% for AGIs below $25k, 0.5% for AGIs $50k-75k, 1.0% for AGIs $100k-200k)
Net capital gain/loss in AGI: +$950 (reported on 14.0% of returns)
Here:
+$950
State:
+$11,802
Profit/loss from business: +$8,043 (reported on 16.3% of returns)
Here:
+$8,043
State:
+$10,509
Taxable individual retirement arrangement distribution: $7,720 (reported on 11.6% of returns)
50055:
$7,720
Iowa:
$11,773
Total itemized deductions: $17,492 (24% of AGI, reported on 30.2% of returns)
Here:
$17,492
State:
$21,278
Here:
23.9% of AGI
State:
18.9% of AGI
(% of AGI for various income ranges: 16.9% for AGIs $25k-50k, 9.7% for AGIs $50k-75k, 9.3% for AGIs $75k-100k, 8.9% for AGIs $100k-200k)
Charity contributions: $2,700 (reported on 23.3% of returns)
Here:
$2,700
State:
$4,044
(% of AGI for various income ranges: 3.4% for AGIs below $25k, 0.9% for AGIs $50k-75k, 1.2% for AGIs $75k-100k, 1.6% for AGIs $100k-200k)
Taxes paid: $5,623 (reported on 30.2% of returns)
50055:
$5,623
State:
$8,846
(% of AGI for various income ranges: 2.7% for AGIs $25k-50k, 2.7% for AGIs $50k-75k, 3.5% for AGIs $75k-100k, 4.7% for AGIs $100k-200k)
Earned income credit: $1,943 (reported on 16.3% of returns)
Here:
$1,943
State:
$2,098
(% of AGI for various income ranges: 5.4% for AGIs below $25k, 1.0% for AGIs $25k-50k)
Percentage of individuals using paid preparers for their 2012 taxes: 76.7%
Here:
77%
State:
65%
(% for various income ranges: 69.2% for AGIs below $25k, 66.7% for AGIs $25k-50k, 87.5% for AGIs $50k-75k, 83.3% for AGIs $75k-100k, 100.0% for AGIs $100k-200k)
Averages for the 2004 tax year for zip code 50055, filed in 2005:
Average Adjusted Gross Income (AGI) in 2004: $40,634 (Individual Income Tax Returns)
Here:
$40,634
State:
$43,875
Salary/wage: $38,866 (reported on 83.0% of returns)
Here:
$38,866
State:
$38,265
(% of AGI for various income ranges: 74.1% for AGIs below $10k, 62.0% for AGIs $10k-25k, 79.8% for AGIs $25k-50k, 80.7% for AGIs $50k-75k, 84.5% for AGIs $75k-100k, 81.9% for AGIs over 100k)
Taxable interest for individuals: $1,232 (reported on 52.8% of returns)
This zip code:
$1,232
Iowa:
$1,768
(% of AGI for various income ranges: 12.3% for AGIs below $10k, 5.5% for AGIs $10k-25k, 2.0% for AGIs $25k-50k, 0.5% for AGIs $50k-75k, 0.7% for AGIs $75k-100k, 0.3% for AGIs over 100k)
Taxable dividends: $663 (reported on 22.4% of returns)
Here:
$663
State:
$2,510
(% of AGI for various income ranges: 2.7% for AGIs below $10k, 0.7% for AGIs $10k-25k, 0.3% for AGIs $25k-50k, 0.2% for AGIs $50k-75k, 0.5% for AGIs $75k-100k)
Net capital gain/loss: +$13 (reported on 18.4% of returns)
Here:
+$13
State:
+$6,139
(% of AGI for various income ranges: 0.7% for AGIs $10k-25k, -0.1% for AGIs $25k-50k, 0.2% for AGIs $50k-75k, -0.4% for AGIs $75k-100k)
Profit/loss from business: +$3,458 (reported on 13.9% of returns)
Here:
+$3,458
State:
+$8,574
Total itemized deductions: $14,254 (22% of AGI, reported on 26.9% of returns)
Here:
$14,254
State:
$16,976
Here:
22.1% of AGI
State:
20.8% of AGI
(% of AGI for various income ranges: 6.4% for AGIs $10k-25k, 9.6% for AGIs $25k-50k, 7.9% for AGIs $50k-75k, 11.6% for AGIs $75k-100k, 13.2% for AGIs over 100k)
Charity contributions deductions: $2,312 (4% of AGI, reported on 22.6% of returns)
Here:
$2,312
State:
$3,089
Here:
3.5% of AGI
State:
3.6% of AGI
(% of AGI for various income ranges: 1.6% for AGIs $25k-50k, 0.9% for AGIs $50k-75k, 2.0% for AGIs $75k-100k, 1.7% for AGIs over 100k)
Total tax: $4,239 (reported on 82.8% of returns)
50055:
$4,239
State:
$6,177
(% of AGI for various income ranges: 4.4% for AGIs below $10k, 5.0% for AGIs $10k-25k, 7.0% for AGIs $25k-50k, 7.6% for AGIs $50k-75k, 10.2% for AGIs $75k-100k, 15.6% for AGIs over 100k)
Earned income credit: $1,571 (reported on 8.3% of returns)
Here:
$1,571
State:
$1,540
Percentage of individuals using paid preparers for their 2004 taxes: 76.4%
Here:
76%
State:
70%
(% for various income ranges: 70.3% for AGIs below $10k, 77.4% for AGIs $10k-25k, 75.6% for AGIs $25k-50k, 80.5% for AGIs $50k-75k, 80.6% for AGIs $75k-100k, 70.6% for AGIs over 100k)
Likely homosexual households (counted as self-reported same-sex unmarried-partner households)
Lesbian couples: 0.3% of all households
Gay men: 0.0% of all households
Household received Food Stamps/SNAP in the past 12 months: 36 Household did not receive Food Stamps/SNAP in the past 12 months: 447
Women who had a birth in the past 12 months: 9 (6 now married, 2 unmarried) Women who did not have a birth in the past 12 months: 248 (164 now married, 83 unmarried)
Housing units in zip code 50055 with a mortgage: 216 (9 second mortgage, 7 both second mortgage and home equity loan) Houses without a mortgage: 7
Median monthly owner costs for units with a mortgage: $1,587 Median monthly owner costs for units without a mortgage: $594
Residents with income below the poverty level in 2022:
This zip code:
3.7%
Whole state:
11.0%
Residents with income below 50% of the poverty level in 2022:
This zip code:
2.9%
Whole state:
5.5%
Median number of rooms in houses and condos:
Here:
7.1
State:
6.8
Median number of rooms in apartments:
Here:
6.4
State:
4.2
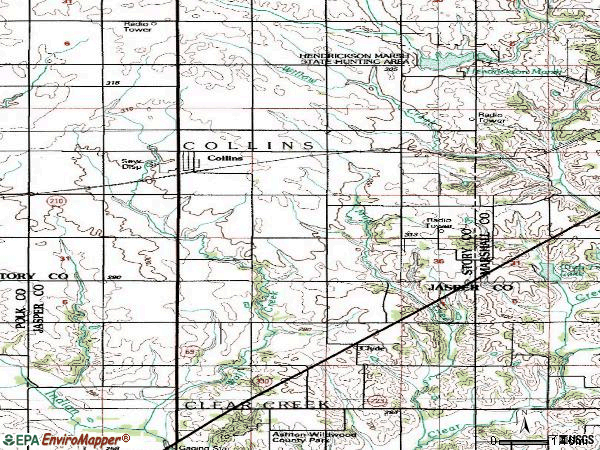
Notable locations in this zip code not listed on our city pages
Notable locations in zip code 50055: Farmers Elevator Company Elevator (A), Collins Fire and Rescue (B), Collins City Hall (C), Collins Public Library (D). Display/hide their locations on the map
229 married couples with children.
83 single-parent households (62 men, 21 women).
99.2% of residents of 50055 zip code speak English at home.
0.1% of residents speak other Indo-European language at home (100% very well).
Foreign born population: 0 (0.0%)
:
0.0%
Whole state:
6.0%
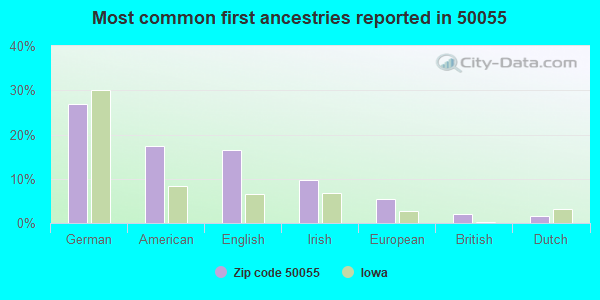
27%German
17%American
17%English
10%Irish
5%European
2%British
2%Dutch
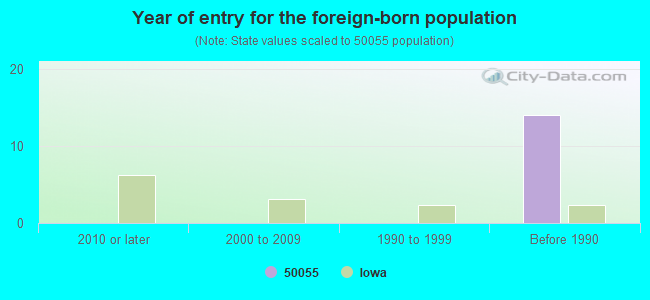
Year of entry for the foreign-born population
02010 or later
02000 to 2009
01990 to 1999
14Before 1990
Facilities with environmental interests located in this zip code:
COLLINS-MAXWELL ELEMENTARY SCHOOL (416 FOURTH STREET in COLLINS, IA)
(Geographic Names Information System) (National Center for Education Statistics) - STATE ID-851350 409 Organizations: COLLINS-MAXWELL COMM SCHOOL DISTRICT (SCHOOL DISTRICT)
COLLINS CITY OF STP (CITY HALL in COLLINS, IA)
National Pollutant Discharge Elimination System NON-MAJOR (Tracking pollutant discharge elimination systems) - permit Business SIC classification: SEWERAGE SYSTEMS Organizations: CITY OF COLLINS (CONTACT/OWNER)
AT&T (3.5 MI S OF COLLINS ON HWY 65 in COLLINS, IA)
(Resource Conservation and Recovery Act (tracking hazardous waste))
COLLINS AMOCO SVC-FORMER SITE OF (COUNTRY RD G & 1ST AVE in COLLINS, IA)
(Resource Conservation and Recovery Act (tracking hazardous waste))
CROPMATE COMPANY (S MAIN ST in COLLINS, IA)
(Resource Conservation and Recovery Act (tracking hazardous waste))
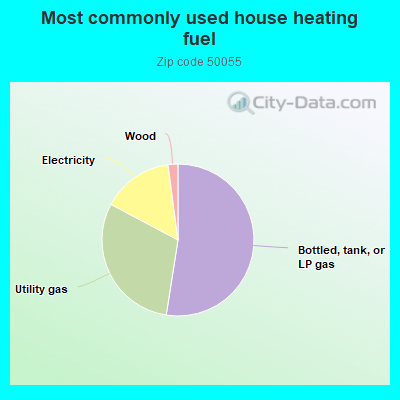
52.7%Bottled, tank, or LP gas
30.4%Utility gas
15.2%Electricity
2.1%Wood
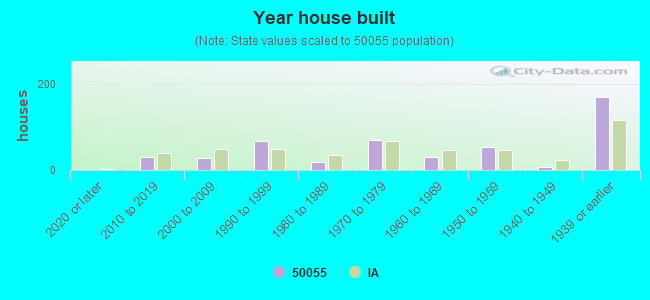
Population in 1990: 764. Population change in the 1990s: +188 (+24.6%).
Place of birth for U.S.-born residents:
This state: 1,001
Midwest: 156
South: 22
West: 65
67% of the 50055 zip code residents lived in the same house 5 years ago. Out of people who lived in different houses, 45% lived in this county. Out of people who lived in different counties, 50% lived in Iowa.
99% of the 50055 zip code residents lived in the same house 1 year ago. Out of people who lived in different houses, 111% moved from this county. Out of people who lived in different houses, 33% moved from different county within same state.
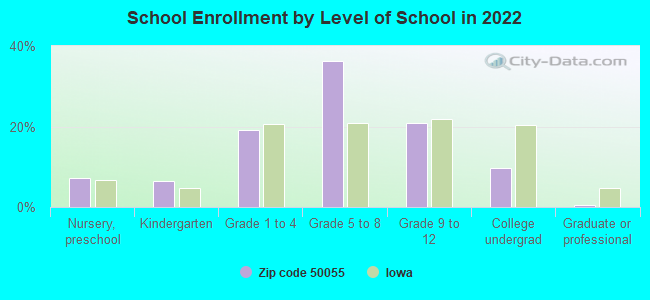
Private vs. public school enrollment:
Students in private schools in grades 1 to 8 (elementary and middle school): 17
Here:
12.0%
Iowa:
10.6%
Students in private schools in grades 9 to 12 (high school): 9
Here:
18.1%
Iowa:
7.9%
Students in private undergraduate colleges:
Here:
0.0%
Iowa:
23.9%
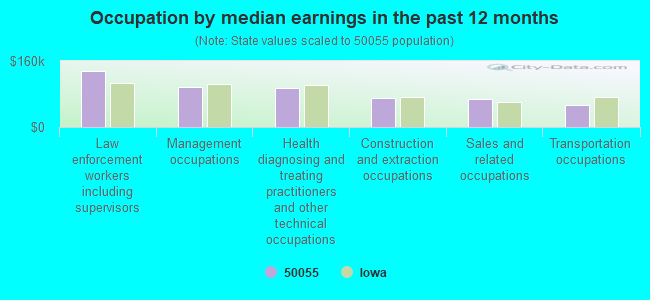
Occupation by median earnings in the past 12 months ($)
136,878Law enforcement workers including supervisors
95,798Management occupations
94,467Health diagnosing and treating practitioners and other technical occupations
70,976Construction and extraction occupations
68,967Sales and related occupations
53,423Transportation occupations
Top industries in this zip code by the number of employees in 2005:
Other Services (except Public Administration): Religious Organizations (5-9 employees: 1 establishment)
Finance and Insurance: Commercial Banking (5-9: 1)
Construction: All Other Specialty Trade Contractors (1-4: 1)
Administrative and Support and Waste Management and Remediation Services: Landscaping Services (1-4: 1)
Finance and Insurance: Insurance Agencies and Brokerages (1-4: 1)
Fatal accident statistics in 2014:
Fatal accident count: 1
Vehicles involved in fatal accidents: 1
Fatal accidents caused by drunken drivers: 0
Fatalities: 1
Persons involved in fatal accidents: 1
Pedestrians involved in fatal accidents: 0
Fatal accident statistics in 2011:
Fatal accident count: 1
Vehicles involved in fatal accidents: 2
Fatal accidents caused by drunken drivers: 0
Fatalities: 1
Persons involved in fatal accidents: 5
Pedestrians involved in fatal accidents: 0
Home Mortgage Disclosure Act Aggregated Statistics For Year 2009 (Based on 2 partial tracts)
A) FHA, FSA/RHS & VA Home Purchase Loans
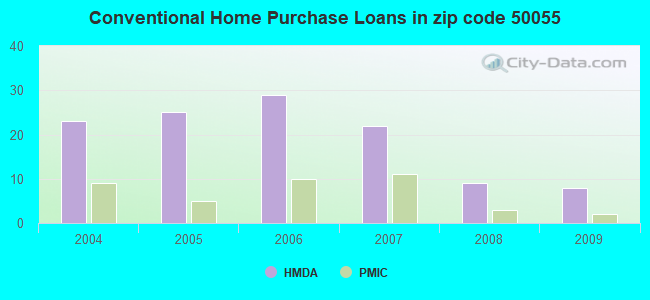
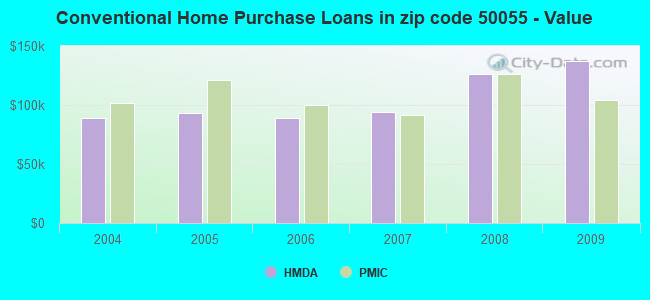
B) Conventional Home Purchase Loans
C) Refinancings
D) Home Improvement Loans
F) Non-occupant Loans on < 5 Family Dwellings (A B C & D)
Number
Average Value
Number
Average Value
Number
Average Value
Number
Average Value
Number
Average Value
LOANS ORIGINATED
8
$112,979
8
$136,950
49
$129,156
6
$39,485
2
$44,030
APPLICATIONS APPROVED, NOT ACCEPTED
0
$0
2
$129,405
5
$168,250
0
$0
0
$0
APPLICATIONS DENIED
1
$148,850
2
$77,780
14
$144,956
2
$17,880
0
$0
APPLICATIONS WITHDRAWN
1
$121,580
1
$109,960
11
$123,819
1
$27,270
0
$0
FILES CLOSED FOR INCOMPLETENESS
0
$0
0
$0
1
$178,350
0
$0
0
$0
Aggregated Statistics For Year 2008 (Based on 2 partial tracts)
A) FHA, FSA/RHS & VA Home Purchase Loans
B) Conventional Home Purchase Loans
C) Refinancings
D) Home Improvement Loans
F) Non-occupant Loans on < 5 Family Dwellings (A B C & D)
G) Loans On Manufactured Home Dwelling (A B C & D)
Number
Average Value
Number
Average Value
Number
Average Value
Number
Average Value
Number
Average Value
Number
Average Value
LOANS ORIGINATED
7
$109,387
9
$126,402
27
$107,959
6
$37,847
3
$25,480
1
$50,510
APPLICATIONS APPROVED, NOT ACCEPTED
0
$0
1
$125,160
3
$61,090
0
$0
0
$0
0
$0
APPLICATIONS DENIED
2
$84,260
4
$61,015
16
$126,948
2
$93,200
0
$0
3
$13,410
APPLICATIONS WITHDRAWN
0
$0
4
$148,515
7
$127,459
0
$0
1
$74,650
0
$0
FILES CLOSED FOR INCOMPLETENESS
0
$0
0
$0
0
$0
0
$0
0
$0
0
$0
Aggregated Statistics For Year 2007 (Based on 2 partial tracts)
A) FHA, FSA/RHS & VA Home Purchase Loans
B) Conventional Home Purchase Loans
C) Refinancings
D) Home Improvement Loans
F) Non-occupant Loans on < 5 Family Dwellings (A B C & D)
G) Loans On Manufactured Home Dwelling (A B C & D)
Number
Average Value
Number
Average Value
Number
Average Value
Number
Average Value
Number
Average Value
Number
Average Value
LOANS ORIGINATED
3
$138,570
22
$93,830
30
$89,042
6
$38,888
4
$82,138
1
$92,080
APPLICATIONS APPROVED, NOT ACCEPTED
0
$0
1
$140,360
7
$82,184
1
$60,790
0
$0
0
$0
APPLICATIONS DENIED
0
$0
4
$83,030
24
$105,567
9
$65,709
1
$62,580
3
$63,920
APPLICATIONS WITHDRAWN
0
$0
0
$0
8
$118,511
0
$0
0
$0
0
$0
FILES CLOSED FOR INCOMPLETENESS
0
$0
1
$109,520
2
$109,290
0
$0
0
$0
0
$0
Aggregated Statistics For Year 2006 (Based on 2 partial tracts)
A) FHA, FSA/RHS & VA Home Purchase Loans
B) Conventional Home Purchase Loans
C) Refinancings
D) Home Improvement Loans
F) Non-occupant Loans on < 5 Family Dwellings (A B C & D)
G) Loans On Manufactured Home Dwelling (A B C & D)
Number
Average Value
Number
Average Value
Number
Average Value
Number
Average Value
Number
Average Value
Number
Average Value
LOANS ORIGINATED
3
$91,933
29
$89,138
30
$103,793
5
$36,744
3
$48,127
2
$64,590
APPLICATIONS APPROVED, NOT ACCEPTED
0
$0
4
$91,858
7
$90,230
1
$29,060
0
$0
0
$0
APPLICATIONS DENIED
0
$0
6
$76,660
21
$81,929
6
$37,102
1
$43,810
1
$12,070
APPLICATIONS WITHDRAWN
0
$0
1
$125,610
14
$98,851
1
$160,920
1
$64,370
0
$0
FILES CLOSED FOR INCOMPLETENESS
0
$0
1
$129,180
7
$107,919
0
$0
0
$0
0
$0
Aggregated Statistics For Year 2005 (Based on 2 partial tracts)
A) FHA, FSA/RHS & VA Home Purchase Loans
B) Conventional Home Purchase Loans
C) Refinancings
D) Home Improvement Loans
F) Non-occupant Loans on < 5 Family Dwellings (A B C & D)
G) Loans On Manufactured Home Dwelling (A B C & D)
Number
Average Value
Number
Average Value
Number
Average Value
Number
Average Value
Number
Average Value
Number
Average Value
LOANS ORIGINATED
1
$127,840
25
$92,815
49
$92,702
9
$28,956
6
$49,915
2
$40,005
APPLICATIONS APPROVED, NOT ACCEPTED
0
$0
1
$172,990
6
$86,197
2
$35,535
0
$0
0
$0
APPLICATIONS DENIED
0
$0
7
$71,840
28
$92,976
8
$33,972
1
$27,270
3
$24,583
APPLICATIONS WITHDRAWN
0
$0
4
$67,272
12
$99,681
1
$75,990
0
$0
0
$0
FILES CLOSED FOR INCOMPLETENESS
0
$0
2
$57,440
8
$126,166
0
$0
0
$0
0
$0
Aggregated Statistics For Year 2004 (Based on 2 partial tracts)
A) FHA, FSA/RHS & VA Home Purchase Loans
B) Conventional Home Purchase Loans
C) Refinancings
D) Home Improvement Loans
F) Non-occupant Loans on < 5 Family Dwellings (A B C & D)
G) Loans On Manufactured Home Dwelling (A B C & D)


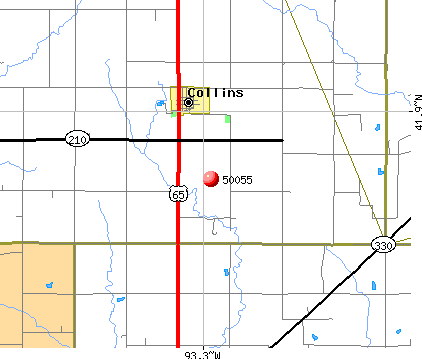 Nearest zip codes: 50168, 50161, 50234, 50056, 50127, 50028.