Estimated zip code population in 2022: 2,562 Zip code population in 2010: 2,604 Zip code population in 2000: 2,621
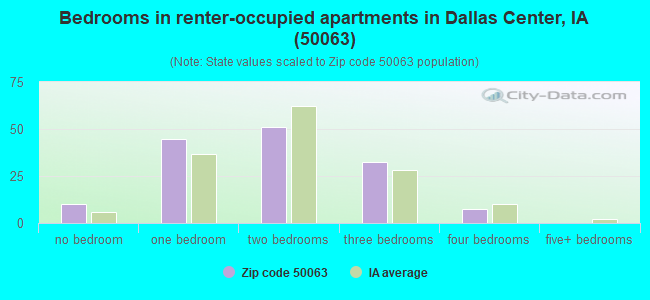
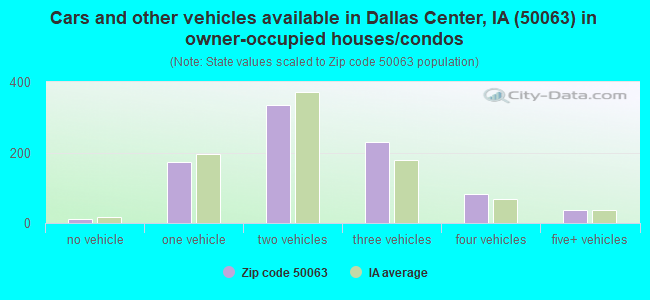
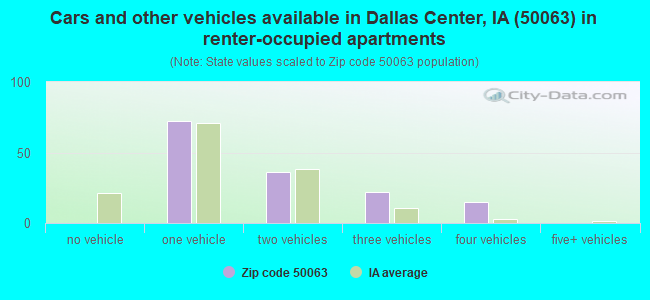
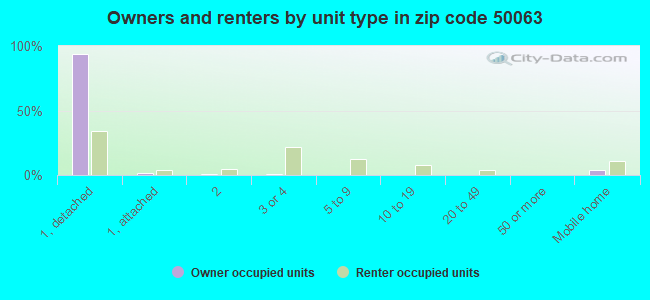
Houses and condos: 1,102 Renter-occupied apartments: 146
% of renters here:
14%
State:
28%
March 2022 cost of living index in zip code 50063: 82.5 (low, U.S. average is 100)
Land area: 65.8 sq. mi. Water area: 0.0 sq. mi.
Population density: 39 people per square mile
(very low).
OSM Map
General Map
Google Map
MSN Map
OSM Map
General Map
Google Map
MSN Map
OSM Map
General Map
Google Map
MSN Map
OSM Map
General Map
Google Map
MSN Map
Please wait while loading the map...
Real estate property taxes paid for housing units in 2022:
This zip code:
1.3% ($3,492)
Iowa:
1.4% ($2,724)
Median real estate property taxes paid for housing units with mortgages in 2022: $3,732 (1.1%) Median real estate property taxes paid for housing units with no mortgage in 2022: $2,982 (1.6%)
Business Search- 14 Million verified businesses
Males: 1,298
(50.7%)
Females: 1,264
(49.3%)
For population 25 years and over in 50063:
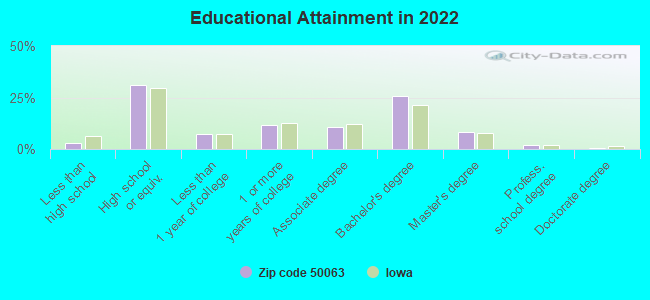
High school or higher: 97.8%
Bachelor's degree or higher: 36.6%
Graduate or professional degree: 10.8%
Unemployed: 0.4%
Mean travel time to work (commute): 26.0 minutes
For population 15 years and over in 50063:
Never married: 26.1%
Now married: 60.7%
Separated: 0.5%
Widowed: 4.5%
Divorced: 8.1%
Zip code 50063 compared to state average:
Unemployed percentage significantly below state average.
Black race population percentage below state average.
Hispanic race population percentage significantly below state average.
Foreign-born population percentage below state average.
Renting percentage below state average.
Length of stay since moving in significantly above state average.
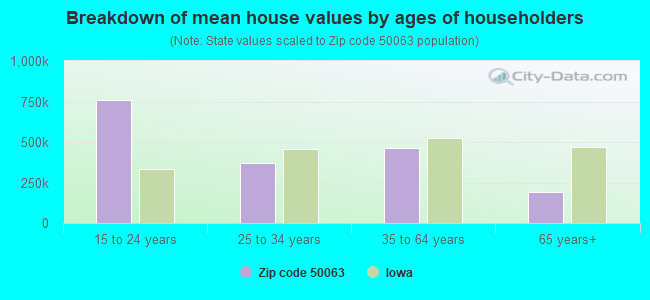
Estimated median house/condo value in 2022: $274,112
50063:
$274,112
Iowa:
$194,600
Median resident age:
This zip code:
39.9 years
Iowa median age:
38.9 years
Average household size:
This zip code:
2.4 people
Iowa:
2.3 people
Averages for the 2020 tax year for zip code 50063, filed in 2021:
Average Adjusted Gross Income (AGI) in 2020: $88,116 (Individual Income Tax Returns)
Here:
$88,116
State:
$71,087
Salary/wage: $69,285 (reported on 83.6% of returns)
Here:
$69,285
State:
$57,361
(% of AGI for various income ranges: 1088.1% for AGIs below $25k, 3768.5% for AGIs $25k-50k, 6655.7% for AGIs $50k-75k, 8536.4% for AGIs $75k-100k, 20224.4% for AGIs $100k-200k, 83550.0% for AGIs over 200k)
Taxable interest for individuals: $3,000 (reported on 38.1% of returns)
This zip code:
$3,000
Iowa:
$1,633
(% of AGI for various income ranges: 23.3% for AGIs below $25k, 36.5% for AGIs $25k-50k, 105.7% for AGIs $50k-75k, 62.7% for AGIs $75k-100k, 140.6% for AGIs $100k-200k, 4830.0% for AGIs over 200k)
Ordinary dividends: $3,289 (reported on 26.9% of returns)
Here:
$3,289
State:
$5,432
(% of AGI for various income ranges: 41.4% for AGIs below $25k, 51.0% for AGIs $25k-50k, 100.7% for AGIs $50k-75k, 74.5% for AGIs $75k-100k, 265.6% for AGIs $100k-200k, 1735.0% for AGIs over 200k)
Net capital gain/loss in AGI: +$31,982 (reported on 24.6% of returns)
Here:
+$31,982
State:
+$15,243
(% of AGI for various income ranges: 36.2% for AGIs below $25k, 48.0% for AGIs $25k-50k, 52.9% for AGIs $50k-75k, 168.2% for AGIs $75k-100k, 525.6% for AGIs $100k-200k, 46410.0% for AGIs over 200k)
Profit/loss from business: +$10,605 (reported on 16.4% of returns)
Here:
+$10,605
State:
+$11,763
(% of AGI for various income ranges: 95.7% for AGIs below $25k, 212.0% for AGIs $25k-50k, 192.1% for AGIs $50k-75k, 166.4% for AGIs $75k-100k, 471.3% for AGIs $100k-200k, 2510.0% for AGIs over 200k)
Taxable individual retirement arrangement distribution: $18,431 (reported on 11.9% of returns)
50063:
$18,431
Iowa:
$17,324
(% of AGI for various income ranges: 86.2% for AGIs below $25k, 184.5% for AGIs $25k-50k, 345.0% for AGIs $50k-75k, 434.5% for AGIs $75k-100k, 898.8% for AGIs $100k-200k)
Total itemized deductions: $37,364 (reported on 10.4% of returns)
Here:
$37,364
State:
$33,775
(% of AGI for various income ranges: 427.6% for AGIs below $25k, 947.9% for AGIs $50k-75k, 760.6% for AGIs $100k-200k, 8945.0% for AGIs over 200k)
Charity contributions: $8,491 (reported on 8.2% of returns)
Here:
$8,491
State:
$13,075
(% of AGI for various income ranges: 155.0% for AGIs $50k-75k, 237.5% for AGIs $100k-200k, 1685.0% for AGIs over 200k)
Taxes paid: $7,771 (reported on 10.4% of returns)
50063:
$7,771
State:
$7,704
(% of AGI for various income ranges: 55.2% for AGIs below $25k, 197.9% for AGIs $50k-75k, 236.2% for AGIs $100k-200k, 1585.0% for AGIs over 200k)
Earned income credit: $2,033 (reported on 6.7% of returns)
Here:
$2,033
State:
$2,195
(% of AGI for various income ranges: 48.1% for AGIs below $25k, 41.0% for AGIs $25k-50k)
Percentage of individuals using paid preparers for their 2020 taxes: 96.3%
Here:
96%
State:
95%
(% for various income ranges: 93.8% for AGIs below $25k, 96.3% for AGIs $25k-50k, 95.2% for AGIs $50k-75k, 100.0% for AGIs $75k-100k, 96.8% for AGIs $100k-200k, 100.0% for AGIs over 200k)
Averages for the 2012 tax year for zip code 50063, filed in 2013:
Average Adjusted Gross Income (AGI) in 2012: $71,234 (Individual Income Tax Returns)
Here:
$71,234
State:
$58,860
Salary/wage: $59,273 (reported on 81.7% of returns)
Here:
$59,273
State:
$46,659
(% of AGI for various income ranges: 66.5% for AGIs below $25k, 77.9% for AGIs $25k-50k, 75.5% for AGIs $50k-75k, 73.4% for AGIs $75k-100k, 78.7% for AGIs $100k-200k, 41.2% for AGIs over 200k)
Taxable interest for individuals: $1,524 (reported on 38.9% of returns)
This zip code:
$1,524
Iowa:
$1,537
(% of AGI for various income ranges: 2.1% for AGIs below $25k, 1.1% for AGIs $25k-50k, 1.1% for AGIs $50k-75k, 0.7% for AGIs $75k-100k, 0.6% for AGIs $100k-200k, 0.7% for AGIs over 200k)
Ordinary dividends: $2,387 (reported on 24.6% of returns)
Here:
$2,387
State:
$4,542
(% of AGI for various income ranges: 1.5% for AGIs below $25k, 1.2% for AGIs $25k-50k, 0.8% for AGIs $50k-75k, 0.5% for AGIs $75k-100k, 0.6% for AGIs $100k-200k, 1.0% for AGIs over 200k)
Net capital gain/loss in AGI: +$23,036 (reported on 17.5% of returns)
Here:
+$23,036
State:
+$11,802
(% of AGI for various income ranges: 0.8% for AGIs $75k-100k, 0.7% for AGIs $100k-200k, 23.0% for AGIs over 200k)
Profit/loss from business: +$5,124 (reported on 16.7% of returns)
Here:
+$5,124
State:
+$10,509
(% of AGI for various income ranges: 10.1% for AGIs below $25k, 1.4% for AGIs $25k-50k, 1.7% for AGIs $50k-75k, 2.6% for AGIs $75k-100k)
Taxable individual retirement arrangement distribution: $11,140 (reported on 11.9% of returns)
50063:
$11,140
Iowa:
$11,773
(% of AGI for various income ranges: 5.1% for AGIs below $25k, 2.0% for AGIs $25k-50k, 2.2% for AGIs $50k-75k, 2.9% for AGIs $75k-100k, 2.0% for AGIs $100k-200k)
Total itemized deductions: $22,532 (20% of AGI, reported on 45.2% of returns)
Here:
$22,532
State:
$21,278
Here:
20.0% of AGI
State:
18.9% of AGI
(% of AGI for various income ranges: 14.6% for AGIs below $25k, 11.3% for AGIs $25k-50k, 13.1% for AGIs $50k-75k, 15.4% for AGIs $75k-100k, 14.9% for AGIs $100k-200k, 14.9% for AGIs over 200k)
Charity contributions: $3,864 (reported on 37.3% of returns)
Here:
$3,864
State:
$4,044
(% of AGI for various income ranges: 1.0% for AGIs below $25k, 1.1% for AGIs $25k-50k, 1.8% for AGIs $50k-75k, 2.0% for AGIs $75k-100k, 2.3% for AGIs $100k-200k, 2.5% for AGIs over 200k)
Taxes paid: $9,795 (reported on 45.2% of returns)
50063:
$9,795
State:
$8,846
(% of AGI for various income ranges: 2.8% for AGIs below $25k, 2.4% for AGIs $25k-50k, 4.4% for AGIs $50k-75k, 5.3% for AGIs $75k-100k, 7.2% for AGIs $100k-200k, 9.3% for AGIs over 200k)
Earned income credit: $1,583 (reported on 9.5% of returns)
Here:
$1,583
State:
$2,098
(% of AGI for various income ranges: 2.9% for AGIs below $25k, 0.8% for AGIs $25k-50k)
Percentage of individuals using paid preparers for their 2012 taxes: 63.5%
Here:
63%
State:
65%
(% for various income ranges: 58.8% for AGIs below $25k, 59.3% for AGIs $25k-50k, 59.1% for AGIs $50k-75k, 66.7% for AGIs $75k-100k, 70.0% for AGIs $100k-200k, 100.0% for AGIs over 200k)
Averages for the 2004 tax year for zip code 50063, filed in 2005:
Average Adjusted Gross Income (AGI) in 2004: $48,715 (Individual Income Tax Returns)
Here:
$48,715
State:
$43,875
Salary/wage: $43,908 (reported on 83.0% of returns)
Here:
$43,908
State:
$38,265
(% of AGI for various income ranges: 122.0% for AGIs below $10k, 63.2% for AGIs $10k-25k, 73.2% for AGIs $25k-50k, 81.4% for AGIs $50k-75k, 87.1% for AGIs $75k-100k, 63.2% for AGIs over 100k)
Taxable interest for individuals: $1,655 (reported on 52.0% of returns)
This zip code:
$1,655
Iowa:
$1,768
(% of AGI for various income ranges: 14.3% for AGIs below $10k, 4.9% for AGIs $10k-25k, 1.9% for AGIs $25k-50k, 1.8% for AGIs $50k-75k, 1.2% for AGIs $75k-100k, 0.8% for AGIs over 100k)
Taxable dividends: $2,682 (reported on 31.8% of returns)
Here:
$2,682
State:
$2,510
(% of AGI for various income ranges: 10.9% for AGIs below $10k, 2.7% for AGIs $10k-25k, 0.9% for AGIs $25k-50k, 0.8% for AGIs $50k-75k, 0.3% for AGIs $75k-100k, 3.4% for AGIs over 100k)
Net capital gain/loss: +$6,256 (reported on 22.3% of returns)
Here:
+$6,256
State:
+$6,139
(% of AGI for various income ranges: -1.7% for AGIs below $10k, -0.6% for AGIs $10k-25k, 1.2% for AGIs $25k-50k, 0.5% for AGIs $50k-75k, 1.2% for AGIs $75k-100k, 7.9% for AGIs over 100k)
Profit/loss from business: +$5,251 (reported on 18.2% of returns)
Here:
+$5,251
State:
+$8,574
(% of AGI for various income ranges: 13.5% for AGIs below $10k, 3.4% for AGIs $10k-25k, 2.9% for AGIs $25k-50k, 1.9% for AGIs $50k-75k, 0.0% for AGIs $75k-100k, 1.9% for AGIs over 100k)
Profit/loss from farming: +$1,976 (reported on 7.2% of returns)
Here:
+$1,976
State:
-$74
(% of AGI for various income ranges: -22.0% for AGIs below $10k, -0.6% for AGIs $10k-25k, 1.9% for AGIs $25k-50k, 0.8% for AGIs $50k-75k, 1.0% for AGIs $75k-100k, -0.5% for AGIs over 100k)
IRA payment deduction: $2,227 (reported on 1.9% of returns)
50063:
$2,227
Iowa:
$2,970
Self-employed pension: $5,300 (reported on 0.9% of returns)
Here:
$5,300
Iowa:
$11,928
Total itemized deductions: $17,584 (23% of AGI, reported on 45.9% of returns)
Here:
$17,584
State:
$16,976
Here:
23.3% of AGI
State:
20.8% of AGI
(% of AGI for various income ranges: 52.3% for AGIs below $10k, 17.4% for AGIs $10k-25k, 14.1% for AGIs $25k-50k, 17.7% for AGIs $50k-75k, 15.8% for AGIs $75k-100k, 16.1% for AGIs over 100k)
Charity contributions deductions: $2,620 (3% of AGI, reported on 40.2% of returns)
Here:
$2,620
State:
$3,089
Here:
3.3% of AGI
State:
3.6% of AGI
(% of AGI for various income ranges: 3.4% for AGIs below $10k, 1.6% for AGIs $10k-25k, 1.6% for AGIs $25k-50k, 2.3% for AGIs $50k-75k, 2.1% for AGIs $75k-100k, 2.6% for AGIs over 100k)
Total tax: $6,077 (reported on 82.2% of returns)
50063:
$6,077
State:
$6,177
(% of AGI for various income ranges: 5.5% for AGIs below $10k, 4.8% for AGIs $10k-25k, 7.2% for AGIs $25k-50k, 7.6% for AGIs $50k-75k, 9.6% for AGIs $75k-100k, 16.2% for AGIs over 100k)
Earned income credit: $1,377 (reported on 6.8% of returns)
Here:
$1,377
State:
$1,540
Percentage of individuals using paid preparers for their 2004 taxes: 64.0%
Here:
64%
State:
70%
(% for various income ranges: 49.7% for AGIs below $10k, 66.5% for AGIs $10k-25k, 65.7% for AGIs $25k-50k, 64.4% for AGIs $50k-75k, 69.3% for AGIs $75k-100k, 74.0% for AGIs over 100k)
Household received Food Stamps/SNAP in the past 12 months: 41 Household did not receive Food Stamps/SNAP in the past 12 months: 975
Women who had a birth in the past 12 months: 10 (10 now married, 0 unmarried) Women who did not have a birth in the past 12 months: 592 (308 now married, 283 unmarried)
Housing units in zip code 50063 with a mortgage: 576 (100 second mortgage, 86 both second mortgage and home equity loan) Houses without a mortgage: 11
Median monthly owner costs for units with a mortgage: $2,014 Median monthly owner costs for units without a mortgage: $643
Residents with income below the poverty level in 2022:
This zip code:
8.1%
Whole state:
11.0%
Residents with income below 50% of the poverty level in 2022:
This zip code:
4.6%
Whole state:
5.5%
Median number of rooms in houses and condos:
Here:
7.6
State:
6.8
Median number of rooms in apartments:
Here:
4.0
State:
4.2
Notable locations in this zip code not listed on our city pages
Notable locations in zip code 50063: Ohio (A), Heartland Co-op Elevator (B), Dallas Center (C), Dallas Center Fire and Rescue (D), Dallas Center City Hall (E), Roy R Estle Memorial Library (F). Display/hide their locations on the map
Churches in zip code 50063 include: First Presbyterian Church (A), Church of the Brethren (B), Dallas Center United Methodist Church (C), Dunkard Brethren Church (D). Display/hide their locations on the map
Cemeteries: Beaver Cemetery (1), Brethren Cemetery (2), Saint Marys Cemetery (3), Greenwood Cemetery (4), King Cemetery (5), Masonic Cemetery (6). Display/hide their locations on the map
In group quarters: 105 (-1 institutionalized population)
Size of family households: 391 2-persons, 81 3-persons, 83 4-persons, 97 5-persons, 10 6-persons, 27 7-or-more-persons
Size of nonfamily households: 296 1-person, 28 2-persons
528 married couples with children.
125 single-parent households (64 men, 61 women).
97.2% of residents of 50063 zip code speak English at home.
1.8% of residents speak Spanish at home (66% very well, 14% well, 20% not well).
0.8% of residents speak other Indo-European language at home (100% very well).
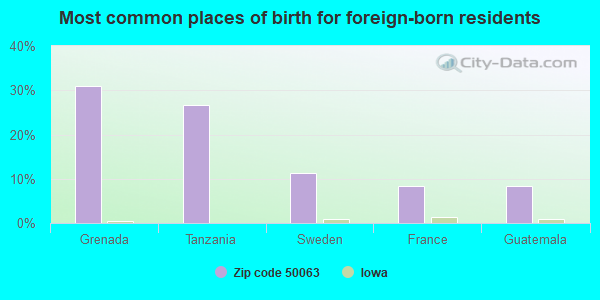
Foreign born population: 75 (2.9%) (66.5% of them are naturalized citizens)
This zip code:
2.9%
Whole state:
6.0%
31%Grenada
27%Tanzania
11%Sweden
8%France
8%Guatemala
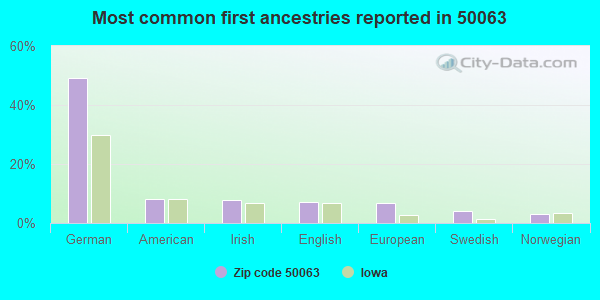
49%German
8%American
8%Irish
7%English
7%European
4%Swedish
3%Norwegian
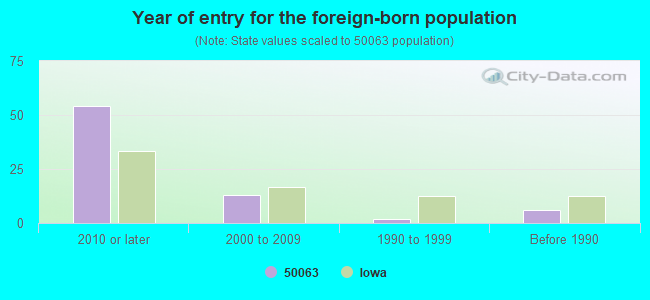
Year of entry for the foreign-born population
542010 or later
132000 to 2009
21990 to 1999
6Before 1990
Major facilities with environmental interests located in this zip code:
DALLAS CENTER F.COOP (1107 SYCAMORE in DALLAS CENTER, IA)
AIR MINOR (AIRS/AFS) (Resource Conservation and Recovery Act (tracking hazardous waste)) (Resource Conservation and Recovery Act (tracking hazardous waste)) - ICIS-, ENFORCEMENT/COMPLIANCE ACTIVITY Business SIC classification: GRAIN AND FIELD BEANS Business NAICS classification: FERTILIZER (MIXING ONLY) MANUFACTURING.; ADMINISTRATIVE MANAGEMENT AND GENERAL MANAGEMENT CONSULTING SERVICES. Organizations: HEARTLAND COOP (CONTACT/OPERATOR)
Alternative names: HEARTLAND CO-OP DALLAS CENTER, HEARTLAND COOP
DALLAS CTR WATER SUPPLY (1502 WALNUT STREET in DALLAS CENTER, IA)
STATE MASTER (Iowa emission factors information) - SDWIS-IA2520098, DRINKING WATER SYSTEM COMPLIANCE ACTIVITY (Tracking inspections of insecticide, fungicide, and rodenticide, and toxic substances) COMMUNITY WATER SYSTEM (SDWIS) Business SIC classification: ELECTRIC SERVICES Organizations: DALLAS CENTER WATER SUPPLY (CONTACT/OPERATOR)
, DALLAS CENTER, CITY OF (LEGALLY RESPONSIBLE ENTITY)
Alternative names: DALLAS CENTER CITY OF, DALLAS CENTER WATER SUPPLY C/O CITY HALL
CROSSROADS AG, LLC (2317 240TH STREET in DALLAS CENTER, IA)
FORMAL ENFORCEMENT ACTION (Integrated Compliance Information System) - ICIS-07-2005-0144, ENFORCEMENT/COMPLIANCE ACTIVITY COMPLIANCE ACTIVITY (Tracking inspections of insecticide, fungicide, and rodenticide, and toxic substances)
DALLAS CENTER-GRIMES ELEMENTARY (1205 13TH ST in DALLAS CENTER, IA)
(National Center for Education Statistics) - STATE ID-251576 436 Organizations: DALLAS CENTER-GRIMES COMM SCHOOL DISTRICT (SCHOOL DISTRICT)
DALLAS CENTER GRIMES COM SCH D (802 15TH ST in DALLAS CENTER, IA)
(Integrated Compliance Information System) - ICIS-07-1986-0056, FORMAL ENFORCEMENT ACTION Business SIC classification: ELEMENTARY AND SECONDARY SCHOOLS
DALLAS COMMUNITY SCHOOL DIST (1500 LINDEN ST in DALLAS CENTER, IA)
COMPLIANCE ACTIVITY (Tracking inspections of insecticide, fungicide, and rodenticide, and toxic substances) (Resource Conservation and Recovery Act (tracking hazardous waste)) Alternative names: DALLAS CENTER GRIMES C S D, DALLAS CENTER-GRIMES COMMUNITY SCHOOL DT, DALLAS CENTER-GRIMES CSD
DUNKARD BRETHERN CHURCH (2323 QUINLAN AVE in DALLAS CENTER, IA)
(Integrated Compliance Information System) - ICIS-07-1999-0255, FORMAL ENFORCEMENT ACTION
RACCOON VALLEY FLYING SERVICE INC (RR 1 BOX 213A in DALLAS CENTER, IA)
COMPLIANCE ACTIVITY (Tracking inspections of insecticide, fungicide, and rodenticide, and toxic substances)
BRENTON BROTHERS, INC (N/A in DALLAS CENTER, IA)
National Pollutant Discharge Elimination System NON-MAJOR (Tracking pollutant discharge elimination systems) - permit Business SIC classification: BEEF CATTLE FEEDLOTS Alternative names: BRENTON BROTHERS FARM OFFICE
DALLAS CENTER CITY OF STP (CITY CLERK in DALLAS CENTER, IA)
National Pollutant Discharge Elimination System NON-MAJOR (Tracking pollutant discharge elimination systems) - permit Business SIC classification: SEWERAGE SYSTEMS Organizations: CITY OF DALLAS CENTER (CONTACT/OWNER)
RACCOON VALLEY FLYING SERVICE (2464 N AVE in DALLAS CENTER, IA)
(Resource Conservation and Recovery Act (tracking hazardous waste)) Organizations: RACCOON VALLEY FLYING SVC-JOE SCAVONE (CONTACT/OWNER)
ADD-COLOR ELECTROSTATIC (1501 WALNUT ST in DALLAS CENTER, IA)
(Resource Conservation and Recovery Act (tracking hazardous waste))
D-C BOATS (HWY 44 in DALLAS CENTER, IA)
(Resource Conservation and Recovery Act (tracking hazardous waste)) Business NAICS classification: BOAT DEALERS.
Housing units lacking complete plumbing facilities: 0.9% Housing units lacking complete kitchen facilities: 4.1%
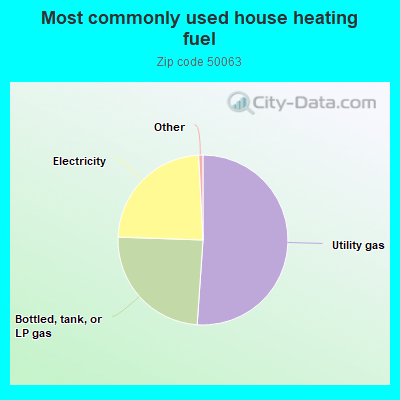
51.2%Utility gas
24.5%Bottled, tank, or LP gas
23.7%Electricity
Population in 1990: 1,838. Population change in the 1990s: +783 (+42.6%).
Place of birth for U.S.-born residents:
This state: 1,952
Northeast: 64
Midwest: 275
South: 81
West: 113
63% of the 50063 zip code residents lived in the same house 5 years ago. Out of people who lived in different houses, 46% lived in this county. Out of people who lived in different counties, 50% lived in Iowa.
90% of the 50063 zip code residents lived in the same house 1 year ago. Out of people who lived in different houses, 39% moved from this county. Out of people who lived in different houses, 48% moved from different county within same state. Out of people who lived in different houses, 13% moved from different state.
Private vs. public school enrollment:
Students in private schools in grades 1 to 8 (elementary and middle school): 21
Here:
6.1%
Iowa:
10.6%
Students in private schools in grades 9 to 12 (high school): 26
Here:
10.5%
Iowa:
7.9%
Students in private undergraduate colleges: 8
Here:
29.4%
Iowa:
23.9%
Occupation by median earnings in the past 12 months ($)
103,250Management occupations
92,484Transportation occupations
89,200Computer and mathematical occupations
85,194Business and financial operations occupations
70,750Sales and related occupations
69,210Life, physical, and social science occupations
Top industries in this zip code by the number of employees in 2005:
Health Care and Social Assistance: Continuing Care Retirement Communities (50-99 employees: 1 establishment)
Health Care and Social Assistance: Child Day Care Services (20-49: 1)
Professional, Scientific, and Technical Services: Offices of Lawyers (10-19: 1, 1-4: 1)
Wholesale Trade: Farm and Garden Machinery and Equipment Merchant Wholesalers (10-19: 1)
Construction: Electrical Contractors (10-19: 1)
Health Care and Social Assistance: Offices of Physicians (except Mental Health Specialists) (10-19: 1)
Wholesale Trade: Grain and Field Bean Merchant Wholesalers (10-19: 1)
People in group quarters in 2010:
61 people in nursing facilities/skilled-nursing facilities
People in group quarters in 2000:
146 people in nursing homes
Fatal accident statistics in 2014:
Fatal accident count: 1
Vehicles involved in fatal accidents: 1
Fatal accidents caused by drunken drivers: 0
Fatalities: 1
Persons involved in fatal accidents: 1
Pedestrians involved in fatal accidents: 0
Fatal accident statistics in 2013:
Fatal accident count: 2
Vehicles involved in fatal accidents: 4
Fatal accidents caused by drunken drivers: 1
Fatalities: 2
Persons involved in fatal accidents: 6
Pedestrians involved in fatal accidents: 0
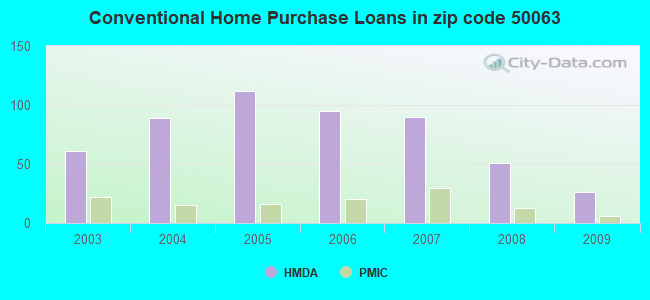
Home Mortgage Disclosure Act Aggregated Statistics For Year 2009 (Based on 4 partial tracts)
A) FHA, FSA/RHS & VA Home Purchase Loans
B) Conventional Home Purchase Loans
C) Refinancings
D) Home Improvement Loans
F) Non-occupant Loans on < 5 Family Dwellings (A B C & D)
G) Loans On Manufactured Home Dwelling (A B C & D)
Number
Average Value
Number
Average Value
Number
Average Value
Number
Average Value
Number
Average Value
Number
Average Value
LOANS ORIGINATED
27
$123,825
26
$161,835
186
$171,058
16
$49,267
7
$90,286
1
$133,270
APPLICATIONS APPROVED, NOT ACCEPTED
0
$0
3
$101,137
17
$134,827
1
$49,960
1
$14,980
1
$61,720
APPLICATIONS DENIED
3
$117,983
10
$101,958
44
$151,573
7
$28,250
3
$88,420
4
$108,315
APPLICATIONS WITHDRAWN
1
$141,900
4
$138,580
31
$158,503
1
$23,890
1
$59,370
0
$0
FILES CLOSED FOR INCOMPLETENESS
0
$0
1
$239,680
3
$201,473
1
$79,640
1
$32,580
0
$0
Aggregated Statistics For Year 2008 (Based on 4 partial tracts)
A) FHA, FSA/RHS & VA Home Purchase Loans
B) Conventional Home Purchase Loans
C) Refinancings
D) Home Improvement Loans
E) Loans on Dwellings For 5+ Families
F) Non-occupant Loans on < 5 Family Dwellings (A B C & D)
G) Loans On Manufactured Home Dwelling (A B C & D)
Number
Average Value
Number
Average Value
Number
Average Value
Number
Average Value
Number
Average Value
Number
Average Value
Number
Average Value
LOANS ORIGINATED
14
$159,056
51
$167,793
89
$158,766
15
$49,393
1
$288,150
11
$66,453
1
$79,340
APPLICATIONS APPROVED, NOT ACCEPTED
0
$0
6
$133,590
13
$163,113
2
$47,175
0
$0
0
$0
1
$138,640
APPLICATIONS DENIED
4
$117,672
11
$143,461
46
$166,225
13
$30,618
1
$299,600
5
$109,590
2
$81,325
APPLICATIONS WITHDRAWN
2
$109,875
3
$171,890
22
$136,394
1
$20,370
0
$0
1
$103,560
0
$0
FILES CLOSED FOR INCOMPLETENESS
0
$0
1
$123,430
5
$163,702
1
$15,580
0
$0
0
$0
0
$0
Aggregated Statistics For Year 2007 (Based on 4 partial tracts)
A) FHA, FSA/RHS & VA Home Purchase Loans
B) Conventional Home Purchase Loans
C) Refinancings
D) Home Improvement Loans
E) Loans on Dwellings For 5+ Families
F) Non-occupant Loans on < 5 Family Dwellings (A B C & D)
G) Loans On Manufactured Home Dwelling (A B C & D)
Number
Average Value
Number
Average Value
Number
Average Value
Number
Average Value
Number
Average Value
Number
Average Value
Number
Average Value
LOANS ORIGINATED
5
$129,630
90
$142,368
110
$134,227
31
$29,338
1
$382,980
11
$112,428
2
$57,895
APPLICATIONS APPROVED, NOT ACCEPTED
0
$0
8
$137,556
15
$142,051
5
$36,526
0
$0
1
$221,250
0
$0
APPLICATIONS DENIED
0
$0
12
$84,972
55
$130,952
14
$66,262
0
$0
2
$116,730
4
$102,740
APPLICATIONS WITHDRAWN
0
$0
9
$142,408
21
$133,836
2
$80,315
0
$0
3
$134,183
1
$167,970
FILES CLOSED FOR INCOMPLETENESS
1
$113,250
3
$101,287
11
$120,598
0
$0
0
$0
0
$0
0
$0
Aggregated Statistics For Year 2006 (Based on 4 partial tracts)
A) FHA, FSA/RHS & VA Home Purchase Loans
B) Conventional Home Purchase Loans
C) Refinancings
D) Home Improvement Loans
E) Loans on Dwellings For 5+ Families
F) Non-occupant Loans on < 5 Family Dwellings (A B C & D)
G) Loans On Manufactured Home Dwelling (A B C & D)
Number
Average Value
Number
Average Value
Number
Average Value
Number
Average Value
Number
Average Value
Number
Average Value
Number
Average Value
LOANS ORIGINATED
3
$147,633
95
$140,183
122
$122,128
24
$38,832
1
$54,300
14
$103,917
4
$73,705
APPLICATIONS APPROVED, NOT ACCEPTED
1
$100,070
10
$86,622
32
$102,126
2
$32,080
0
$0
5
$121,008
2
$90,860
APPLICATIONS DENIED
3
$104,467
14
$115,899
72
$121,979
18
$35,789
0
$0
3
$56,607
3
$73,283
APPLICATIONS WITHDRAWN
0
$0
4
$111,045
33
$90,431
3
$26,073
0
$0
1
$140,210
0
$0
FILES CLOSED FOR INCOMPLETENESS
0
$0
5
$157,434
15
$135,207
1
$17,380
0
$0
0
$0
0
$0
Aggregated Statistics For Year 2005 (Based on 4 partial tracts)
A) FHA, FSA/RHS & VA Home Purchase Loans
B) Conventional Home Purchase Loans
C) Refinancings
D) Home Improvement Loans
E) Loans on Dwellings For 5+ Families
F) Non-occupant Loans on < 5 Family Dwellings (A B C & D)
G) Loans On Manufactured Home Dwelling (A B C & D)
Number
Average Value
Number
Average Value
Number
Average Value
Number
Average Value
Number
Average Value
Number
Average Value
Number
Average Value
LOANS ORIGINATED
6
$139,162
112
$138,196
142
$113,778
28
$30,421
1
$119,840
11
$107,378
5
$50,196
APPLICATIONS APPROVED, NOT ACCEPTED
0
$0
14
$134,515
16
$127,076
0
$0
0
$0
1
$84,560
0
$0
APPLICATIONS DENIED
1
$44,160
26
$83,829
66
$114,191
10
$51,622
0
$0
5
$69,022
6
$46,142
APPLICATIONS WITHDRAWN
1
$106,430
15
$74,671
47
$120,467
4
$57,265
0
$0
2
$49,880
0
$0
FILES CLOSED FOR INCOMPLETENESS
1
$107,150
7
$117,487
30
$129,913
1
$8,990
0
$0
1
$59,920
0
$0
Aggregated Statistics For Year 2004 (Based on 4 partial tracts)
A) FHA, FSA/RHS & VA Home Purchase Loans
B) Conventional Home Purchase Loans
C) Refinancings
D) Home Improvement Loans
F) Non-occupant Loans on < 5 Family Dwellings (A B C & D)
G) Loans On Manufactured Home Dwelling (A B C & D)
Number
Average Value
Number
Average Value
Number
Average Value
Number
Average Value
Number
Average Value
Number
Average Value
LOANS ORIGINATED
11
$107,172
89
$138,774
160
$117,928
30
$41,375
6
$53,872
1
$84,310
APPLICATIONS APPROVED, NOT ACCEPTED
1
$94,670
7
$207,056
23
$103,927
4
$62,452
1
$305,080
1
$18,820
APPLICATIONS DENIED
0
$0
14
$103,599
52
$111,833
8
$40,804
3
$132,973
1
$135,990
APPLICATIONS WITHDRAWN
0
$0
13
$116,469
36
$116,944
3
$45,713
1
$55,130
0
$0
FILES CLOSED FOR INCOMPLETENESS
0
$0
2
$113,620
13
$106,621
1
$89,280
1
$32,960
0
$0
Aggregated Statistics For Year 2003 (Based on 4 partial tracts)
A) FHA, FSA/RHS & VA Home Purchase Loans
B) Conventional Home Purchase Loans
C) Refinancings
D) Home Improvement Loans
E) Loans on Dwellings For 5+ Families
F) Non-occupant Loans on < 5 Family Dwellings (A B C & D)
Detailed PMIC statistics for the following Tracts:0501.00
, 0502.00
2002 - 2018 National Fire Incident Reporting System (NFIRS) incidents
Based on the data from the years 2002 - 2018 the average number of fires per year is 17. The highest number of fires - 30 took place in 2011, and the least - 2 in 2008. The data has a constant trend.
When looking into fire subcategories, the most incidents belonged to: Outside Fires (43.4%), and Structure Fires (38.6%).
Fire incident types reported to NFIRS in Zip Code 50063


+$1,976
-$74
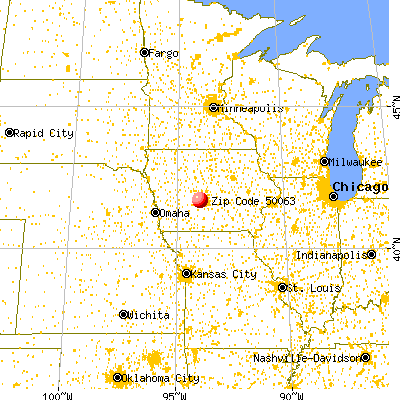
(% of AGI for various income ranges: -22.0% for AGIs below $10k, -0.6% for AGIs $10k-25k, 1.9% for AGIs $25k-50k, 0.8% for AGIs $50k-75k, 1.0% for AGIs $75k-100k, -0.5% for AGIs over 100k) Nearest zip codes: 50167, 50263, 50039, 50003, 50111, 50109.


 Based on the data from the years 2002 - 2018 the average number of fires per year is 17. The highest number of fires - 30 took place in 2011, and the least - 2 in 2008. The data has a constant trend.
 When looking into fire subcategories, the most incidents belonged to: Outside Fires (43.4%), and Structure Fires (38.6%).