Estimated zip code population in 2022: 710 Zip code population in 2010: 719 Zip code population in 2000: 811
Houses and condos: 325 Renter-occupied apartments: 45
% of renters here:
14%
State:
28%
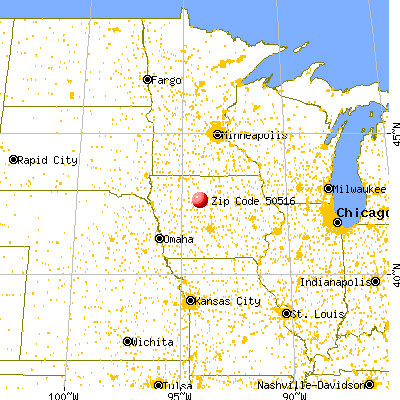
March 2022 cost of living index in zip code 50516: 81.8 (low, U.S. average is 100)
Land area: 24.7 sq. mi. Water area: 0.1 sq. mi.
Population density: 29 people per square mile
(very low).
OSM Map
General Map
Google Map
MSN Map
OSM Map
General Map
Google Map
MSN Map
OSM Map
General Map
Google Map
MSN Map
OSM Map
General Map
Google Map
MSN Map
Please wait while loading the map...
Real estate property taxes paid for housing units in 2022:
This zip code:
1.5% ($1,867)
Iowa:
1.4% ($2,724)
Median real estate property taxes paid for housing units with mortgages in 2022: $1,873 (1.4%) Median real estate property taxes paid for housing units with no mortgage in 2022: $1,875 (1.6%)
Business Search- 14 Million verified businesses
Males: 347
(49.0%)
Females: 362
(51.0%)
For population 25 years and over in 50516:
High school or higher: 95.5%
Bachelor's degree or higher: 25.1%
Graduate or professional degree: 11.0%
Unemployed: 2.7%
Mean travel time to work (commute): 19.7 minutes
For population 15 years and over in 50516:
Never married: 15.9%
Now married: 62.1%
Separated: 0.0%
Widowed: 9.2%
Divorced: 12.9%
Zip code 50516 compared to state average:
Median house value below state average.
Black race population percentage significantly below state average.
Hispanic race population percentage below state average.
Median age above state average.
Foreign-born population percentage significantly below state average.
Renting percentage below state average.
Length of stay since moving in significantly above state average.
Estimated median house/condo value in 2022: $125,161
50516:
$125,161
Iowa:
$194,600
Median resident age:
This zip code:
44.2 years
Iowa median age:
38.9 years
Average household size:
This zip code:
2.2 people
Iowa:
2.3 people
Averages for the 2020 tax year for zip code 50516, filed in 2021:
Average Adjusted Gross Income (AGI) in 2020: $61,103 (Individual Income Tax Returns)
Here:
$61,103
State:
$71,087
Salary/wage: $53,393 (reported on 83.3% of returns)
Here:
$53,393
State:
$57,361
(% of AGI for various income ranges: 1010.0% for AGIs below $25k, 3451.4% for AGIs $25k-50k, 7060.0% for AGIs $50k-75k, 9490.0% for AGIs $75k-100k, 18312.5% for AGIs $100k-200k)
Taxable interest for individuals: $578 (reported on 50.0% of returns)
This zip code:
$578
Iowa:
$1,633
(% of AGI for various income ranges: 21.7% for AGIs below $25k, 21.4% for AGIs $25k-50k, 60.0% for AGIs $50k-75k, 116.7% for AGIs $75k-100k, 42.5% for AGIs $100k-200k)
Ordinary dividends: $1,800 (reported on 13.9% of returns)
Here:
$1,800
State:
$5,432
(% of AGI for various income ranges: 46.7% for AGIs below $25k, 206.7% for AGIs $75k-100k)
Net capital gain/loss in AGI: +$3,917 (reported on 16.7% of returns)
Here:
+$3,917
State:
+$15,243
(% of AGI for various income ranges: 95.7% for AGIs $25k-50k, 420.0% for AGIs $100k-200k)
Profit/loss from business: +$2,650 (reported on 11.1% of returns)
Here:
+$2,650
State:
+$11,763
(% of AGI for various income ranges: 265.0% for AGIs $50k-75k)
Taxable individual retirement arrangement distribution: $8,800 (reported on 11.1% of returns)
50516:
$8,800
Iowa:
$17,324
(% of AGI for various income ranges: 880.0% for AGIs $50k-75k)
Earned income credit: $1,967 (reported on 8.3% of returns)
Here:
$1,967
State:
$2,195
(% of AGI for various income ranges: 98.3% for AGIs below $25k)
Percentage of individuals using paid preparers for their 2020 taxes: 91.7%
Here:
92%
State:
95%
(% for various income ranges: 88.9% for AGIs below $25k, 88.9% for AGIs $25k-50k, 100.0% for AGIs $50k-75k, 80.0% for AGIs $75k-100k, 100.0% for AGIs $100k-200k)
Averages for the 2012 tax year for zip code 50516, filed in 2013:
Average Adjusted Gross Income (AGI) in 2012: $54,906 (Individual Income Tax Returns)
Here:
$54,906
State:
$58,860
Salary/wage: $41,767 (reported on 85.7% of returns)
Here:
$41,767
State:
$46,659
(% of AGI for various income ranges: 77.9% for AGIs below $25k, 80.1% for AGIs $25k-50k, 75.0% for AGIs $50k-75k, 81.8% for AGIs $75k-100k, 41.8% for AGIs $100k-200k)
Taxable interest for individuals: $600 (reported on 37.1% of returns)
This zip code:
$600
Iowa:
$1,537
(% of AGI for various income ranges: 0.8% for AGIs $25k-50k, 0.4% for AGIs $50k-75k, 0.5% for AGIs $100k-200k)
Ordinary dividends: $860 (reported on 14.3% of returns)
Here:
$860
State:
$4,542
Net capital gain/loss in AGI: +$1,625 (reported on 11.4% of returns)
Here:
+$1,625
State:
+$11,802
Profit/loss from business: +$3,860 (reported on 14.3% of returns)
Here:
+$3,860
State:
+$10,509
Taxable individual retirement arrangement distribution: $9,325 (reported on 11.4% of returns)
50516:
$9,325
Iowa:
$11,773
Total itemized deductions: $16,278 (21% of AGI, reported on 25.7% of returns)
Here:
$16,278
State:
$21,278
Here:
20.6% of AGI
State:
18.9% of AGI
Charity contributions: $3,371 (reported on 20.0% of returns)
Here:
$3,371
State:
$4,044
(% of AGI for various income ranges: 3.3% for AGIs $50k-75k, 1.4% for AGIs $100k-200k)
Taxes paid: $5,411 (reported on 25.7% of returns)
50516:
$5,411
State:
$8,846
Earned income credit: $1,475 (reported on 11.4% of returns)
Here:
$1,475
State:
$2,098
(% of AGI for various income ranges: 4.9% for AGIs below $25k)
Percentage of individuals using paid preparers for their 2012 taxes: 68.6%
Here:
69%
State:
65%
(% for various income ranges: 70.0% for AGIs below $25k, 55.6% for AGIs $25k-50k, 71.4% for AGIs $50k-75k, 75.0% for AGIs $75k-100k, 80.0% for AGIs $100k-200k)
Averages for the 2004 tax year for zip code 50516, filed in 2005:
Average Adjusted Gross Income (AGI) in 2004: $38,123 (Individual Income Tax Returns)
Here:
$38,123
State:
$43,875
Salary/wage: $34,980 (reported on 89.8% of returns)
Here:
$34,980
State:
$38,265
(% of AGI for various income ranges: 103.5% for AGIs below $10k, 75.7% for AGIs $10k-25k, 79.8% for AGIs $25k-50k, 84.6% for AGIs $50k-75k, 82.9% for AGIs $75k-100k)
Taxable interest for individuals: $884 (reported on 49.4% of returns)
This zip code:
$884
Iowa:
$1,768
(% of AGI for various income ranges: 7.9% for AGIs below $10k, 1.7% for AGIs $10k-25k, 1.0% for AGIs $25k-50k, 1.4% for AGIs $50k-75k, 0.3% for AGIs $75k-100k)
Taxable dividends: $473 (reported on 22.3% of returns)
Here:
$473
State:
$2,510
(% of AGI for various income ranges: 1.6% for AGIs below $10k, 0.5% for AGIs $25k-50k, 0.2% for AGIs $50k-75k, 0.0% for AGIs $75k-100k)
Profit/loss from business: +$4,152 (reported on 13.9% of returns)
Here:
+$4,152
State:
+$8,574
Profit/loss from farming: +$7,000 (reported on 5.1% of returns)
Here:
+$7,000
State:
-$74
Total itemized deductions: $13,430 (23% of AGI, reported on 25.9% of returns)
Here:
$13,430
State:
$16,976
Here:
23.2% of AGI
State:
20.8% of AGI
(% of AGI for various income ranges: 27.2% for AGIs below $10k, 10.0% for AGIs $25k-50k, 7.2% for AGIs $50k-75k, 10.9% for AGIs $75k-100k)
Charity contributions deductions: $2,667 (5% of AGI, reported on 22.6% of returns)
Here:
$2,667
State:
$3,089
Here:
4.6% of AGI
State:
3.6% of AGI
Total tax: $3,927 (reported on 74.4% of returns)
50516:
$3,927
State:
$6,177
(% of AGI for various income ranges: 0.9% for AGIs below $10k, 4.6% for AGIs $10k-25k, 6.3% for AGIs $25k-50k, 7.5% for AGIs $50k-75k, 10.7% for AGIs $75k-100k)
Earned income credit: $1,621 (reported on 8.7% of returns)
Here:
$1,621
State:
$1,540
Percentage of individuals using paid preparers for their 2004 taxes: 72.3%
Here:
72%
State:
70%
(% for various income ranges: 63.4% for AGIs below $10k, 73.2% for AGIs $10k-25k, 73.8% for AGIs $25k-50k, 86.4% for AGIs $50k-75k, 62.8% for AGIs $75k-100k)
Likely homosexual households (counted as self-reported same-sex unmarried-partner households)
Lesbian couples: 0.8% of all households
Gay men: 0.0% of all households
Household received Food Stamps/SNAP in the past 12 months: 15 Household did not receive Food Stamps/SNAP in the past 12 months: 307
Women who had a birth in the past 12 months: 11 (10 now married, 0 unmarried) Women who did not have a birth in the past 12 months: 137 (79 now married, 58 unmarried)
Housing units in zip code 50516 with a mortgage: 127 (19 second mortgage, 20 both second mortgage and home equity loan) Houses without a mortgage: 3
Median monthly owner costs for units with a mortgage: $1,097 Median monthly owner costs for units without a mortgage: $533
Residents with income below the poverty level in 2022:
This zip code:
3.6%
Whole state:
11.0%
Median number of rooms in houses and condos:
Here:
6.9
State:
6.8
Median number of rooms in apartments:
Here:
5.1
State:
4.2
Notable locations in this zip code not listed on our city pages
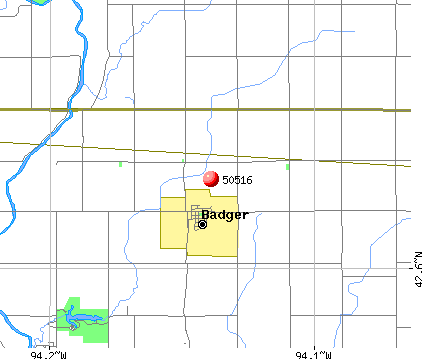
Notable locations in zip code 50516: New Cooperative Company Elevator (A), Badger Fire Department (B), Badger Public Library (C), Badger Township Police Department (D). Display/hide their locations on the map
Size of family households: 101 2-persons, 45 3-persons, 26 4-persons, 17 5-persons, 2 6-persons, 3 7-or-more-persons
Size of nonfamily households: 104 1-person, 20 2-persons
111 married couples with children.
29 single-parent households (15 men, 14 women).
96.7% of residents of 50516 zip code speak English at home.
1.3% of residents speak Spanish at home (44% very well, 33% well, 22% not well).
1.8% of residents speak other Indo-European language at home (100% very well).
Foreign born population: 18 (2.6%) (47.9% of them are naturalized citizens)
This zip code:
2.6%
Whole state:
6.0%
59%Honduras
24%Sweden
24%England
24%English
21%German
19%Norwegian
6%Irish
4%Dutch
2%Scotch-Irish
2%American
Year of entry for the foreign-born population
62010 or later
72000 to 2009
21990 to 1999
0Before 1990
Facilities with environmental interests located in this zip code:
NEW COOP (100 CENTER STREET in BADGER, IA)
AIR MINOR (AIRS/AFS) (Resource Conservation and Recovery Act (tracking hazardous waste)) Business SIC classification: NONCLASSIFIABLE ESTABLISHMENTS Organizations: NEW COOPERATIVE, INC. (CONTACT/OWNER)
Alternative names: N E W COOP INC, NEW COOPERATIVE INCORPORATED BADGER
BADGER CITY OF STP (CITY CLERK, CITY HALL in BADGER, IA)
National Pollutant Discharge Elimination System NON-MAJOR (Tracking pollutant discharge elimination systems) - permit Business SIC classification: SEWERAGE SYSTEMS Organizations: CITY OF BADGER (CONTACT/OWNER)
Housing units lacking complete plumbing facilities: 1.6%
55.5%Utility gas
31.0%Bottled, tank, or LP gas
13.2%Electricity
0.6%Wood
Population in 1990: 1,270.
Place of birth for U.S.-born residents:
This state: 590
Northeast: 24
Midwest: 42
South: 15
West: 21
73% of the 50516 zip code residents lived in the same house 5 years ago. Out of people who lived in different houses, 60% lived in this county. Out of people who lived in different counties, 50% lived in Iowa.
95% of the 50516 zip code residents lived in the same house 1 year ago. Out of people who lived in different houses, 71% moved from this county. Out of people who lived in different houses, 11% moved from different county within same state. Out of people who lived in different houses, 11% moved from different state. Out of people who lived in different houses, 7% moved from abroad.
Private vs. public school enrollment:
Students in private schools in grades 1 to 8 (elementary and middle school): 15
Here:
23.9%
Iowa:
10.6%
Students in private schools in grades 9 to 12 (high school):
Here:
0.0%
Iowa:
7.9%
Students in private undergraduate colleges: 3
Here:
20.6%
Iowa:
23.9%
Occupation by median earnings in the past 12 months ($)
67,311Health diagnosing and treating practitioners and other technical occupations
55,927Production occupations
54,877Management occupations
51,514Education, training, and library occupations
50,769Business and financial operations occupations
48,607Installation, maintenance, and repair occupations
Top industries in this zip code by the number of employees in 2005:
Construction: Water and Sewer Line and Related Structures Construction (10-19 employees: 1 establishment)
Finance and Insurance: Commercial Banking (1-4: 1)
Construction: Plumbing, Heating, and Air-Conditioning Contractors (1-4: 1)
Finance and Insurance: Insurance Agencies and Brokerages (1-4: 1)
Construction: Electrical Contractors (1-4: 1)
Accommodation and Food Services: Snack and Nonalcoholic Beverage Bars (1-4: 1)
Fatal accident statistics in 2013:
Fatal accident count: 2
Vehicles involved in fatal accidents: 2
Fatal accidents caused by drunken drivers: 0
Fatalities: 2
Persons involved in fatal accidents: 3
Pedestrians involved in fatal accidents: 0
Fatal accident statistics in 2012:
Fatal accident count: 1
Vehicles involved in fatal accidents: 1
Fatal accidents caused by drunken drivers: 0
Fatalities: 1
Persons involved in fatal accidents: 1
Pedestrians involved in fatal accidents: 0
2003 - 2018 National Fire Incident Reporting System (NFIRS) incidents
According to the data from the years 2003 - 2018 the average number of fire incidents per year is 7. The highest number of reported fires - 15 took place in 2011, and the least - 0 in 2005. The data has a growing trend.
When looking into fire subcategories, the most reports belonged to: Outside Fires (53.4%), and Structure Fires (25.4%).
Fire incident types reported to NFIRS in Zip Code 50516


+$7,000
-$74
 Nearest zip codes: 50591, 50594, 50529, 50548, 50501, 50545.


 According to the data from the years 2003 - 2018 the average number of fire incidents per year is 7. The highest number of reported fires - 15 took place in 2011, and the least - 0 in 2005. The data has a growing trend.
 When looking into fire subcategories, the most reports belonged to: Outside Fires (53.4%), and Structure Fires (25.4%).