Estimated zip code population in 2022: 2,102 Zip code population in 2010: 2,105 Zip code population in 2000: 2,123
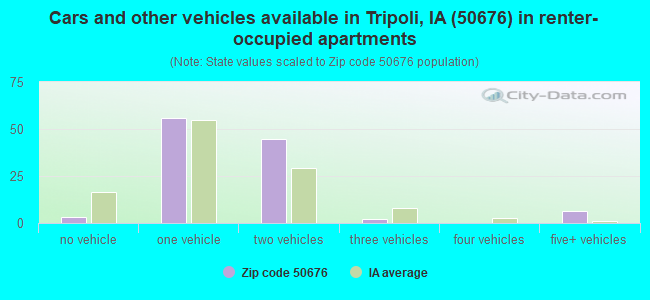
Houses and condos: 948 Renter-occupied apartments: 112
% of renters here:
12%
State:
28%
March 2022 cost of living index in zip code 50676: 82.2 (low, U.S. average is 100)
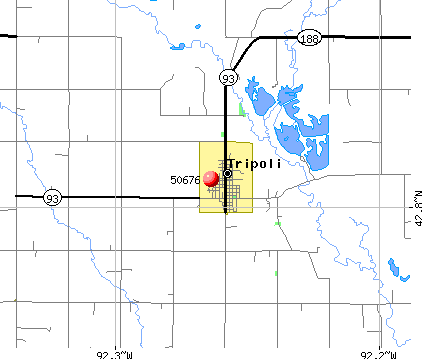
Land area: 57.1 sq. mi. Water area: 0.4 sq. mi.
Population density: 37 people per square mile
(very low).
OSM Map
General Map
Google Map
MSN Map
OSM Map
General Map
Google Map
MSN Map
OSM Map
General Map
Google Map
MSN Map
OSM Map
General Map
Google Map
MSN Map
Please wait while loading the map...
Real estate property taxes paid for housing units in 2022:
This zip code:
1.5% ($2,182)
Iowa:
1.4% ($2,724)
Median real estate property taxes paid for housing units with mortgages in 2022: $2,056 (1.5%) Median real estate property taxes paid for housing units with no mortgage in 2022: $2,419 (1.6%)
Business Search- 14 Million verified businesses
Males: 1,056
(50.3%)
Females: 1,045
(49.7%)
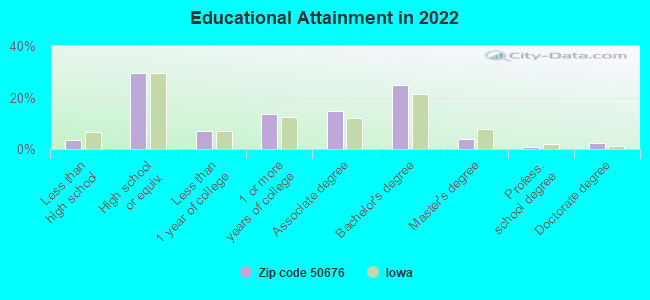
For population 25 years and over in 50676:
High school or higher: 96.5%
Bachelor's degree or higher: 31.9%
Graduate or professional degree: 7.0%
Unemployed: 3.3%
Mean travel time to work (commute): 27.7 minutes
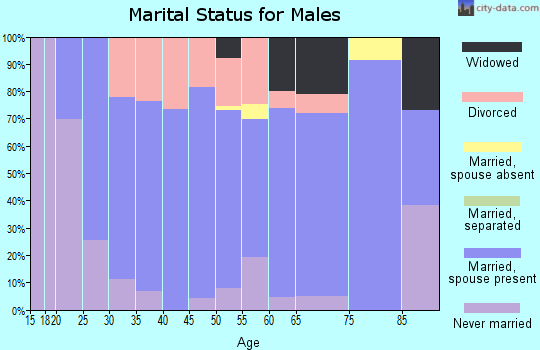
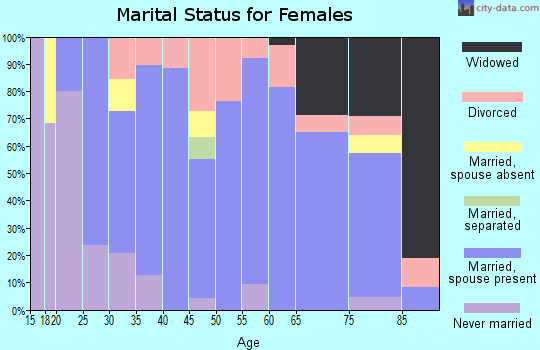
For population 15 years and over in 50676:
Never married: 28.2%
Now married: 56.4%
Separated: 0.3%
Widowed: 5.1%
Divorced: 10.0%
Zip code 50676 compared to state average:
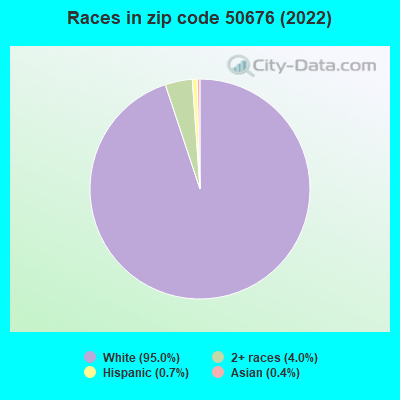
Black race population percentage significantly below state average.
Hispanic race population percentage significantly below state average.
Foreign-born population percentage significantly below state average.
Renting percentage below state average.
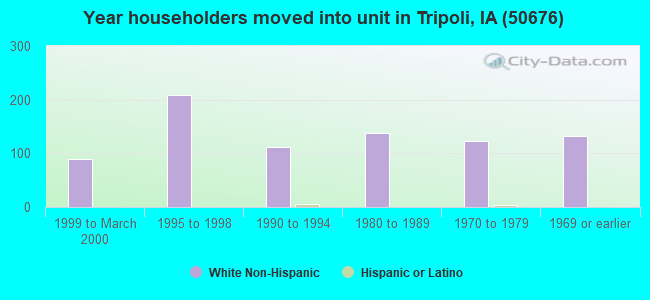
Length of stay since moving in significantly above state average.
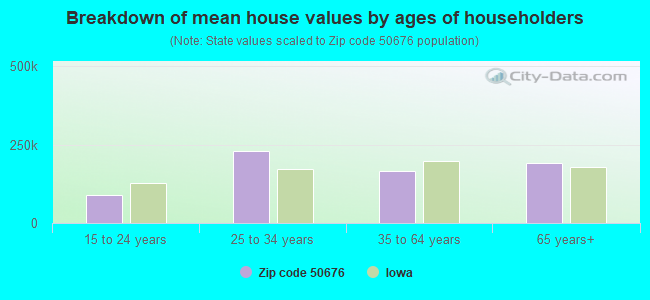
Estimated median house/condo value in 2022: $147,986
50676:
$147,986
Iowa:
$194,600
According to our research of Iowa and other state lists, there were 2 registered sex offenders living in 50676 zip code as of April 29, 2024. The ratio of all residents to sex offenders in zip code 50676 is 1,107 to 1. The ratio of registered sex offenders to all residents in this zip code is lower than the state average.
Median resident age:
This zip code:
40.4 years
Iowa median age:
38.9 years
Average household size:
This zip code:
2.3 people
Iowa:
2.3 people
Averages for the 2020 tax year for zip code 50676, filed in 2021:
Average Adjusted Gross Income (AGI) in 2020: $62,076 (Individual Income Tax Returns)
Here:
$62,076
State:
$71,087
Salary/wage: $52,383 (reported on 85.2% of returns)
Here:
$52,383
State:
$57,361
(% of AGI for various income ranges: 1197.5% for AGIs below $25k, 3752.6% for AGIs $25k-50k, 7039.0% for AGIs $50k-75k, 9816.2% for AGIs $75k-100k, 19755.0% for AGIs $100k-200k)
Taxable interest for individuals: $1,272 (reported on 40.9% of returns)
This zip code:
$1,272
Iowa:
$1,633
(% of AGI for various income ranges: 53.8% for AGIs below $25k, 32.1% for AGIs $25k-50k, 90.0% for AGIs $50k-75k, 111.2% for AGIs $75k-100k, 220.0% for AGIs $100k-200k)
Ordinary dividends: $1,756 (reported on 28.4% of returns)
Here:
$1,756
State:
$5,432
(% of AGI for various income ranges: 23.8% for AGIs below $25k, 26.8% for AGIs $25k-50k, 80.0% for AGIs $50k-75k, 185.0% for AGIs $75k-100k, 165.0% for AGIs $100k-200k)
Net capital gain/loss in AGI: +$4,628 (reported on 20.5% of returns)
Here:
+$4,628
State:
+$15,243
(% of AGI for various income ranges: 0.6% for AGIs below $25k, 10.5% for AGIs $25k-50k, 78.0% for AGIs $50k-75k, 210.0% for AGIs $75k-100k, 943.3% for AGIs $100k-200k)
Profit/loss from business: +$6,671 (reported on 15.9% of returns)
Here:
+$6,671
State:
+$11,763
(% of AGI for various income ranges: 43.8% for AGIs below $25k, 246.3% for AGIs $25k-50k, 161.0% for AGIs $50k-75k, 107.5% for AGIs $75k-100k, 248.3% for AGIs $100k-200k)
Taxable individual retirement arrangement distribution: $7,580 (reported on 11.4% of returns)
50676:
$7,580
Iowa:
$17,324
(% of AGI for various income ranges: 80.0% for AGIs below $25k, 73.7% for AGIs $25k-50k, 141.0% for AGIs $50k-75k, 436.2% for AGIs $75k-100k)
Total itemized deductions: $25,850 (reported on 2.3% of returns)
Here:
$25,850
State:
$33,775
(% of AGI for various income ranges: 323.1% for AGIs below $25k)
Taxes paid: $6,550 (reported on 2.3% of returns)
50676:
$6,550
State:
$7,704
(% of AGI for various income ranges: 81.9% for AGIs below $25k)
Earned income credit: $2,244 (reported on 10.2% of returns)
Here:
$2,244
State:
$2,195
(% of AGI for various income ranges: 62.5% for AGIs below $25k, 53.7% for AGIs $25k-50k)
Percentage of individuals using paid preparers for their 2020 taxes: 94.3%
Here:
94%
State:
95%
(% for various income ranges: 90.9% for AGIs below $25k, 95.8% for AGIs $25k-50k, 93.3% for AGIs $50k-75k, 92.3% for AGIs $75k-100k, 100.0% for AGIs $100k-200k, 100.0% for AGIs over 200k)
Averages for the 2012 tax year for zip code 50676, filed in 2013:
Average Adjusted Gross Income (AGI) in 2012: $54,513 (Individual Income Tax Returns)
Here:
$54,513
State:
$58,860
Salary/wage: $43,897 (reported on 84.3% of returns)
Here:
$43,897
State:
$46,659
(% of AGI for various income ranges: 67.9% for AGIs below $25k, 70.6% for AGIs $25k-50k, 76.5% for AGIs $50k-75k, 75.3% for AGIs $75k-100k, 59.7% for AGIs $100k-200k)
Taxable interest for individuals: $1,433 (reported on 48.3% of returns)
This zip code:
$1,433
Iowa:
$1,537
(% of AGI for various income ranges: 2.9% for AGIs below $25k, 2.4% for AGIs $25k-50k, 1.2% for AGIs $50k-75k, 0.7% for AGIs $75k-100k, 0.7% for AGIs $100k-200k)
Ordinary dividends: $1,111 (reported on 31.5% of returns)
Here:
$1,111
State:
$4,542
(% of AGI for various income ranges: 1.1% for AGIs below $25k, 1.4% for AGIs $25k-50k, 0.8% for AGIs $50k-75k, 0.1% for AGIs $75k-100k, 0.3% for AGIs $100k-200k)
Net capital gain/loss in AGI: +$7,556 (reported on 18.0% of returns)
Here:
+$7,556
State:
+$11,802
(% of AGI for various income ranges: 0.6% for AGIs below $25k, 0.8% for AGIs $25k-50k, 1.8% for AGIs $50k-75k, 4.8% for AGIs $100k-200k)
Profit/loss from business: +$7,421 (reported on 15.7% of returns)
Here:
+$7,421
State:
+$10,509
(% of AGI for various income ranges: 3.6% for AGIs below $25k, 4.0% for AGIs $25k-50k, 0.3% for AGIs $50k-75k, 5.9% for AGIs $75k-100k, 0.6% for AGIs $100k-200k)
Taxable individual retirement arrangement distribution: $7,040 (reported on 11.2% of returns)
50676:
$7,040
Iowa:
$11,773
(% of AGI for various income ranges: 1.7% for AGIs below $25k, 4.2% for AGIs $25k-50k, 3.9% for AGIs $75k-100k)
Total itemized deductions: $17,048 (17% of AGI, reported on 25.8% of returns)
Here:
$17,048
State:
$21,278
Here:
17.4% of AGI
State:
18.9% of AGI
(% of AGI for various income ranges: 9.4% for AGIs below $25k, 6.6% for AGIs $25k-50k, 6.0% for AGIs $50k-75k, 8.6% for AGIs $75k-100k, 9.3% for AGIs $100k-200k)
Charity contributions: $2,230 (reported on 22.5% of returns)
Here:
$2,230
State:
$4,044
(% of AGI for various income ranges: 0.8% for AGIs $25k-50k, 0.5% for AGIs $50k-75k, 1.1% for AGIs $75k-100k, 1.3% for AGIs $100k-200k)
Taxes paid: $6,965 (reported on 25.8% of returns)
50676:
$6,965
State:
$8,846
(% of AGI for various income ranges: 1.1% for AGIs below $25k, 1.5% for AGIs $25k-50k, 1.7% for AGIs $50k-75k, 3.6% for AGIs $75k-100k, 5.1% for AGIs $100k-200k)
Earned income credit: $2,209 (reported on 12.4% of returns)
Here:
$2,209
State:
$2,098
(% of AGI for various income ranges: 3.8% for AGIs below $25k, 1.3% for AGIs $25k-50k)
Percentage of individuals using paid preparers for their 2012 taxes: 75.3%
Here:
75%
State:
65%
(% for various income ranges: 75.0% for AGIs below $25k, 75.0% for AGIs $25k-50k, 66.7% for AGIs $50k-75k, 77.8% for AGIs $75k-100k, 84.6% for AGIs $100k-200k)
Averages for the 2004 tax year for zip code 50676, filed in 2005:
Average Adjusted Gross Income (AGI) in 2004: $37,438 (Individual Income Tax Returns)
Here:
$37,438
State:
$43,875
Salary/wage: $35,166 (reported on 82.5% of returns)
Here:
$35,166
State:
$38,265
(% of AGI for various income ranges: 102.0% for AGIs below $10k, 68.2% for AGIs $10k-25k, 74.3% for AGIs $25k-50k, 80.8% for AGIs $50k-75k, 77.7% for AGIs $75k-100k, 83.6% for AGIs over 100k)
Taxable interest for individuals: $1,814 (reported on 58.8% of returns)
This zip code:
$1,814
Iowa:
$1,768
(% of AGI for various income ranges: 9.9% for AGIs below $10k, 6.4% for AGIs $10k-25k, 3.7% for AGIs $25k-50k, 1.7% for AGIs $50k-75k, 1.7% for AGIs $75k-100k, 0.5% for AGIs over 100k)
Taxable dividends: $613 (reported on 41.2% of returns)
Here:
$613
State:
$2,510
(% of AGI for various income ranges: 3.9% for AGIs below $10k, 1.2% for AGIs $10k-25k, 0.8% for AGIs $25k-50k, 0.3% for AGIs $50k-75k, 0.3% for AGIs $75k-100k, 0.7% for AGIs over 100k)
Net capital gain/loss: +$2,055 (reported on 23.5% of returns)
Here:
+$2,055
State:
+$6,139
(% of AGI for various income ranges: 1.1% for AGIs below $10k, 1.1% for AGIs $10k-25k, 1.4% for AGIs $25k-50k, 0.5% for AGIs $50k-75k, 3.4% for AGIs $75k-100k)
Profit/loss from business: +$4,735 (reported on 16.0% of returns)
Here:
+$4,735
State:
+$8,574
(% of AGI for various income ranges: -3.4% for AGIs below $10k, 3.3% for AGIs $10k-25k, 2.0% for AGIs $25k-50k, 3.3% for AGIs $50k-75k, 1.1% for AGIs $75k-100k)
IRA payment deduction: $4,318 (reported on 2.6% of returns)
50676:
$4,318
Iowa:
$2,970
Total itemized deductions: $13,788 (22% of AGI, reported on 22.2% of returns)
Here:
$13,788
State:
$16,976
Here:
22.2% of AGI
State:
20.8% of AGI
(% of AGI for various income ranges: 10.0% for AGIs $10k-25k, 6.0% for AGIs $25k-50k, 7.4% for AGIs $50k-75k, 9.7% for AGIs $75k-100k, 12.8% for AGIs over 100k)
Charity contributions deductions: $1,994 (3% of AGI, reported on 19.5% of returns)
Here:
$1,994
State:
$3,089
Here:
3.1% of AGI
State:
3.6% of AGI
(% of AGI for various income ranges: 1.5% for AGIs $10k-25k, 0.7% for AGIs $25k-50k, 0.9% for AGIs $50k-75k, 0.9% for AGIs $75k-100k, 2.0% for AGIs over 100k)
Total tax: $3,887 (reported on 77.9% of returns)
50676:
$3,887
State:
$6,177
(% of AGI for various income ranges: 2.4% for AGIs below $10k, 3.9% for AGIs $10k-25k, 6.9% for AGIs $25k-50k, 7.3% for AGIs $50k-75k, 10.2% for AGIs $75k-100k, 14.8% for AGIs over 100k)
Earned income credit: $1,347 (reported on 11.5% of returns)
Here:
$1,347
State:
$1,540
Percentage of individuals using paid preparers for their 2004 taxes: 78.4%
Here:
78%
State:
70%
(% for various income ranges: 71.9% for AGIs below $10k, 74.3% for AGIs $10k-25k, 82.5% for AGIs $25k-50k, 81.2% for AGIs $50k-75k, 80.9% for AGIs $75k-100k, 82.8% for AGIs over 100k)
Household received Food Stamps/SNAP in the past 12 months: 14 Household did not receive Food Stamps/SNAP in the past 12 months: 896
Women who had a birth in the past 12 months: 34 (26 now married, 8 unmarried) Women who did not have a birth in the past 12 months: 393 (177 now married, 216 unmarried)
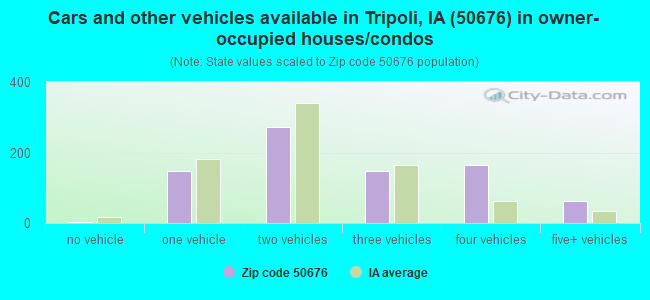
Housing units in zip code 50676 with a mortgage: 535 (125 second mortgage, 98 both second mortgage and home equity loan) Houses without a mortgage: 11
Median monthly owner costs for units with a mortgage: $1,254 Median monthly owner costs for units without a mortgage: $632
Residents with income below the poverty level in 2022:
This zip code:
2.8%
Whole state:
11.0%
Residents with income below 50% of the poverty level in 2022:
This zip code:
1.3%
Whole state:
5.5%
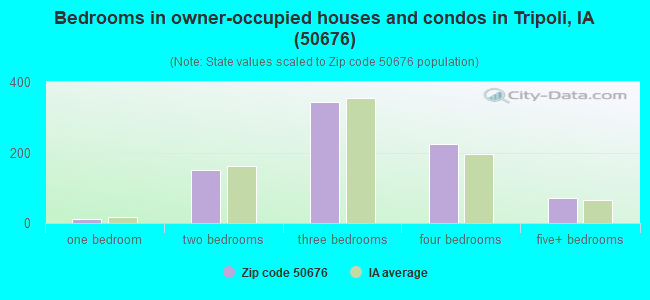
Median number of rooms in houses and condos:
Here:
6.5
State:
6.8
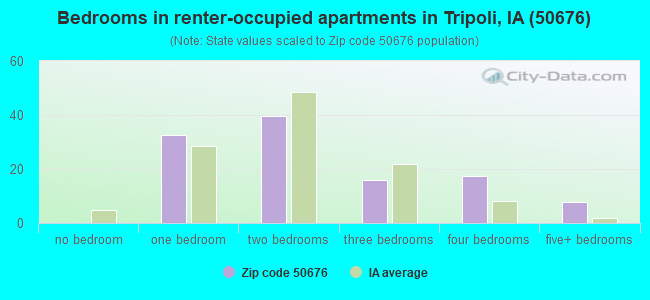
Median number of rooms in apartments:
Here:
4.3
State:
4.2
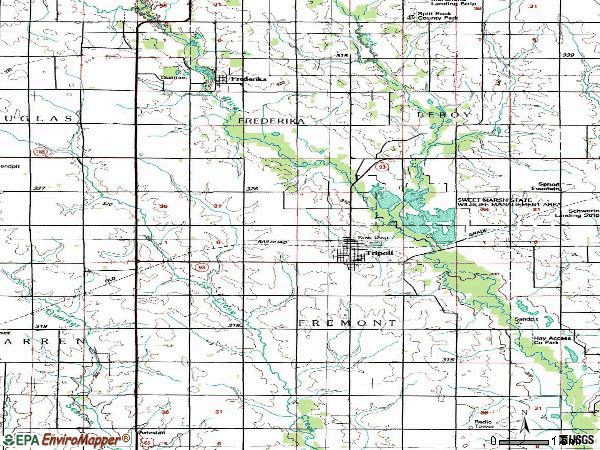
Notable locations in this zip code not listed on our city pages
Notable locations in zip code 50676: Maple Hills Country Club (A), Fredericksburg Farmers Co-op Elevator (B), Frederika First Responders (C), Tripoli City Hall (D), Tripoli Fire Department (E), Tripoli Police Department (F), Tripoli Recreation Center (G), Tripoli Library (H), Frederika Town Hall (I). Display/hide their locations on the map
Churches in zip code 50676 include: Saint Pauls Evangelical Lutheran Church (A), Grace Lutheran Church (B), Faith United Church of Christ (C), Saint Johns Lutheran Church (D), Frederika Methodist Church (E), Saint John Church (F). Display/hide their locations on the map
Cemeteries: Alcock Cemetery (1), Faith Cemetery (2), Fremont Cemetery (3), Grace Cemetery (4), Saint Johns Lutheran Cemetery (5). Display/hide their locations on the map
Parks in zip code 50676 include: Alcock County Park (1), Ringneck Wildlife Area (2), Frederika City Park (3), South Park (4), North Park (5), Chapin Park (6). Display/hide their locations on the map
In group quarters: 20 (-1 institutionalized population)
Size of family households: 320 2-persons, 114 3-persons, 114 4-persons, 62 5-persons, 10 6-persons, 6 7-or-more-persons
Size of nonfamily households: 237 1-person, 35 2-persons
314 married couples with children.
139 single-parent households (49 men, 90 women).
99.0% of residents of 50676 zip code speak English at home.
0.5% of residents speak Spanish at home (100% very well).
0.2% of residents speak other Indo-European language at home (100% well).
Foreign born population: 0 (0.0%)
:
0.0%
Whole state:
6.0%
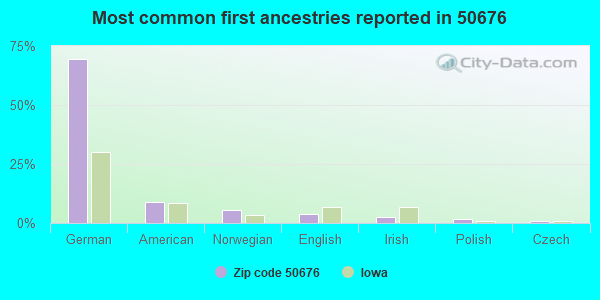
70%German
9%American
5%Norwegian
4%English
2%Irish
2%Polish
1%Czech
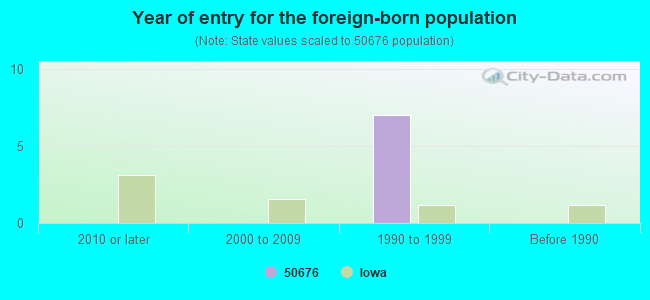
Year of entry for the foreign-born population
02010 or later
02000 to 2009
71990 to 1999
0Before 1990
Major facilities with environmental interests located in this zip code:
TRIPOLI ELEMENTARY SCHOOL (309 9TH AVE SW in TRIPOLI, IA)
(National Center for Education Statistics) - STATE ID-096471 418 Organizations: TRIPOLI COMM SCHOOL DISTRICT (SCHOOL DISTRICT)
TRIPOLI MIDDLE/SR HIGH SCHOOL (209 8TH AVE SW in TRIPOLI, IA)
(National Center for Education Statistics) - STATE ID-096471 172 Organizations: TRIPOLI COMM SCHOOL DISTRICT (SCHOOL DISTRICT)
CRAIG FOSTER FORD INCORPORATED (221 SOUTH MAIN STREET in TRIPOLI, IA)
(Integrated Compliance Information System) - ICIS-07-1996-0143, FORMAL ENFORCEMENT ACTION Business SIC classification: MOTOR VEHICLE DEALERS (NEW AND USED)
DICKS PETROLEUM (106 3RD AVENUE in TRIPOLI, IA)
AIR MINOR (AIRS/AFS) Conditionally Exempt Small Quantity Generators, less than 100 kg/month of hazardous waste (Resource Conservation and Recovery Act (tracking hazardous waste)) Business SIC classification: ELECTROPLATING, PLATING, POLISHING, ANODIZING, AND COLORING; COATING, ENGRAVING, AND ALLIED SERVICES; GASOLINE SERVICE STATIONS
DICKS TRUCK SHOP (404 1ST AVENUE in TRIPOLI, IA)
AIR MINOR (AIRS/AFS) Conditionally Exempt Small Quantity Generators, less than 100 kg/month of hazardous waste (Resource Conservation and Recovery Act (tracking hazardous waste)) Business SIC classification: TOP, BODY, AND UPHOLSTERY REPAIR SHOPS AND PAINT SHOPS
TRIPOLI CITY OF STP (CITY CLERK - CITY HALL in TRIPOLI, IA)
National Pollutant Discharge Elimination System NON-MAJOR (Tracking pollutant discharge elimination systems) - permit Business SIC classification: SEWERAGE SYSTEMS
TRIPOLI READLYN SANITATION DPT (103 1ST ST NE in TRIPOLI, IA)
(Resource Conservation and Recovery Act (tracking hazardous waste)) Business NAICS classification: AIR TRAFFIC CONTROL. Organizations: X (CONTACT/OWNER)
HEARTLAND ASPHALT INC (1565 LARRABEE AVE in TRIPOLI, IA)
AIR SYNTHETIC MINOR (AIRS/AFS) AIR MINOR (AIRS/AFS) Business SIC classification: ASPHALT PAVING MIXTURES AND BLOCKS
AGVANTAGE FS (309 RAILROAD AVENUE in TRIPOLI, IA)
(Resource Conservation and Recovery Act (tracking hazardous waste)) Alternative names: CEDAR VALLEY FS INC
DICKS TRUCK STOP (106 3RD AVENUE in TRIPOLI, IA)
AIR MINOR (AIRS/AFS) Business SIC classification: GENERAL AUTOMOTIVE REPAIR SHOPS
TRIPOLI FARM PRODUCT (MAIN STREET in TRIPOLI, IA)
AIR MINOR (AIRS/AFS) Business SIC classification: NONCLASSIFIABLE ESTABLISHMENTS
BUHR CHEVROLET-BUICK (213 SOUTH MAIN STREET in TRIPOLI, IA)
Small Quantity Generators, between 100 kg and 1000 kg of hazardous waste/month (Resource Conservation and Recovery Act (tracking hazardous waste)) - notification Organizations: RICHARD BUHR (CONTACT/OWNER)
TRIPOLI C S D (HWY 93 in TRIPOLI, IA)
COMPLIANCE ACTIVITY (Tracking inspections of insecticide, fungicide, and rodenticide, and toxic substances) Alternative names: TRIPOLI COMMUNITY SCHOOLS
Housing units lacking complete plumbing facilities: 4.9% Housing units lacking complete kitchen facilities: 5.1%
57.3%Utility gas
27.6%Bottled, tank, or LP gas
11.1%Electricity
3.0%Fuel oil, kerosene, etc.
1.4%Wood
Population in 1990: 1,993. Population change in the 1990s: +130 (+6.5%).
Place of birth for U.S.-born residents:
This state: 1,800
Northeast: 8
Midwest: 186
South: 60
West: 36
63% of the 50676 zip code residents lived in the same house 5 years ago. Out of people who lived in different houses, 62% lived in this county. Out of people who lived in different counties, 50% lived in Iowa.
99% of the 50676 zip code residents lived in the same house 1 year ago. Out of people who lived in different houses, 40% moved from this county. Out of people who lived in different houses, 65% moved from different county within same state. Out of people who lived in different houses, 25% moved from different state.
Private vs. public school enrollment:
Students in private schools in grades 1 to 8 (elementary and middle school): 1
Here:
0.8%
Iowa:
10.6%
Students in private schools in grades 9 to 12 (high school):
Here:
0.0%
Iowa:
7.9%
Students in private undergraduate colleges: 8
Here:
30.2%
Iowa:
23.9%
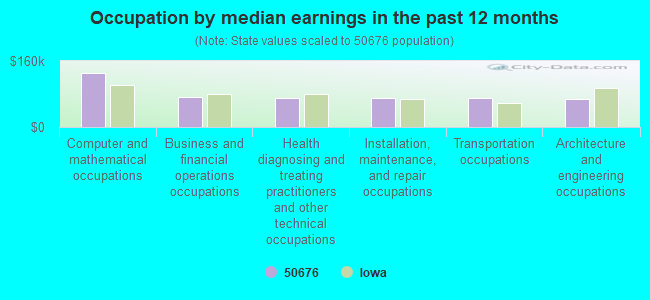
Occupation by median earnings in the past 12 months ($)
129,718Computer and mathematical occupations
73,279Business and financial operations occupations
70,704Health diagnosing and treating practitioners and other technical occupations
69,758Installation, maintenance, and repair occupations
69,264Transportation occupations
68,605Architecture and engineering occupations
Top industries in this zip code by the number of employees in 2005:
Other Services (except Public Administration): Commercial and Industrial Machinery and Equipment (except Automotive and Electronic) Repair and Maintenance (20-49 employees: 1 establishment, 1-4 employees: 1 establishment)
Health Care and Social Assistance: Nursing Care Facilities (20-49: 1)
Finance and Insurance: Commercial Banking (10-19: 1)
Other Services (except Public Administration): Religious Organizations (5-9: 1, 1-4: 1)
Construction: Siding Contractors (5-9: 1)
Construction: Site Preparation Contractors (1-4: 2)
People in group quarters in 2010:
32 people in nursing facilities/skilled-nursing facilities
People in group quarters in 2000:
32 people in nursing homes
Fatal accident statistics in 2012:
Fatal accident count: 1
Vehicles involved in fatal accidents: 2
Fatal accidents caused by drunken drivers: 0
Fatalities: 1
Persons involved in fatal accidents: 2
Pedestrians involved in fatal accidents: 0
2003 - 2018 National Fire Incident Reporting System (NFIRS) incidents
Based on the data from the years 2003 - 2018 the average number of fires per year is 8. The highest number of reported fires - 19 took place in 2003, and the least - 0 in 2006. The data has a dropping trend.
When looking into fire subcategories, the most reports belonged to: Outside Fires (50.0%), and Structure Fires (25.0%).
Fire incident types reported to NFIRS in Zip Code 50676

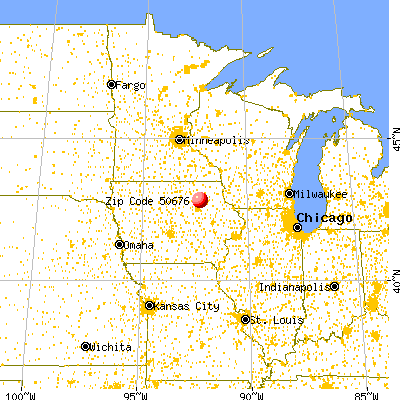


 Nearest zip codes: 50668, 50622, 50677, 50674, 50630, 50664.


 Based on the data from the years 2003 - 2018 the average number of fires per year is 8. The highest number of reported fires - 19 took place in 2003, and the least - 0 in 2006. The data has a dropping trend.
 When looking into fire subcategories, the most reports belonged to: Outside Fires (50.0%), and Structure Fires (25.0%).