Estimated zip code population in 2022: 1,122 Zip code population in 2010: 1,378 Zip code population in 2000: 1,451
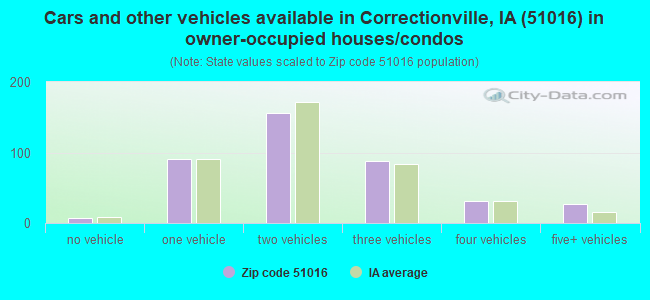
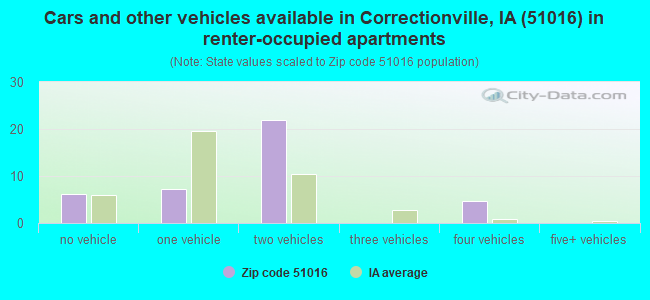
Houses and condos: 489 Renter-occupied apartments: 40
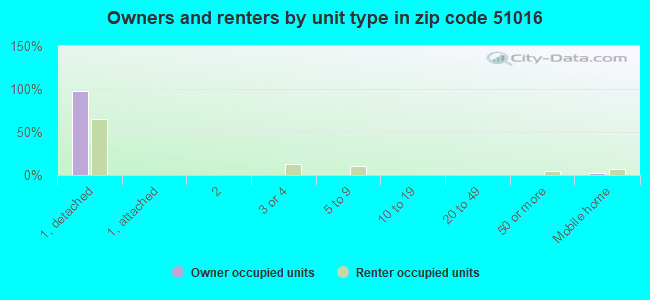
% of renters here:
9%
State:
28%
March 2022 cost of living index in zip code 51016: 81.5 (low, U.S. average is 100)
Land area: 101.3 sq. mi. Water area: 0.2 sq. mi.
Population density: 11 people per square mile
(very low).
OSM Map
General Map
Google Map
MSN Map
OSM Map
General Map
Google Map
MSN Map
OSM Map
General Map
Google Map
MSN Map
OSM Map
General Map
Google Map
MSN Map
Please wait while loading the map...
Real estate property taxes paid for housing units in 2022:
This zip code:
1.4% ($1,386)
Iowa:
1.4% ($2,724)
Median real estate property taxes paid for housing units with mortgages in 2022: $1,340 (1.2%) Median real estate property taxes paid for housing units with no mortgage in 2022: $1,456 (1.5%)
Business Search- 14 Million verified businesses
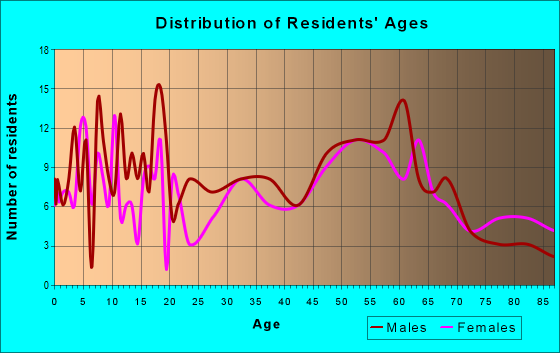
Males: 622
(55.5%)
Females: 499
(44.5%)
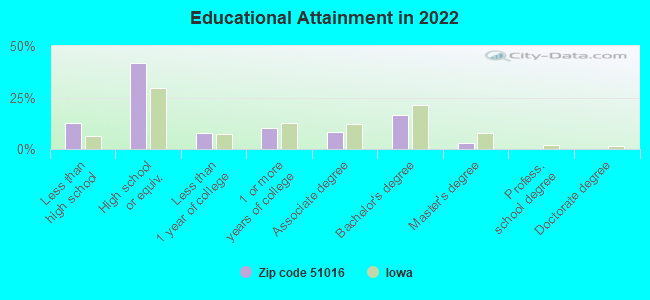
For population 25 years and over in 51016:
High school or higher: 86.3%
Bachelor's degree or higher: 19.6%
Graduate or professional degree: 3.1%
Unemployed: 1.3%
Mean travel time to work (commute): 29.1 minutes
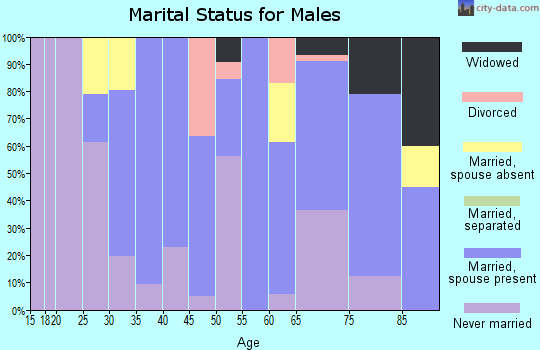
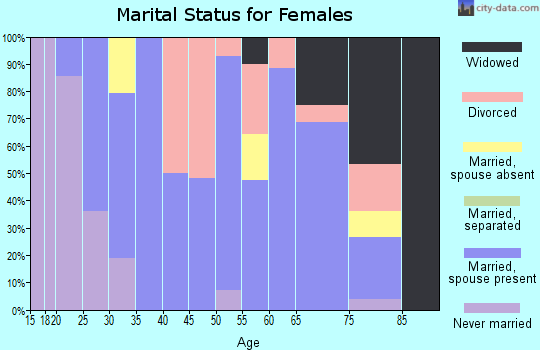
For population 15 years and over in 51016:
Never married: 22.4%
Now married: 55.5%
Separated: 3.3%
Widowed: 8.0%
Divorced: 10.9%
Zip code 51016 compared to state average:
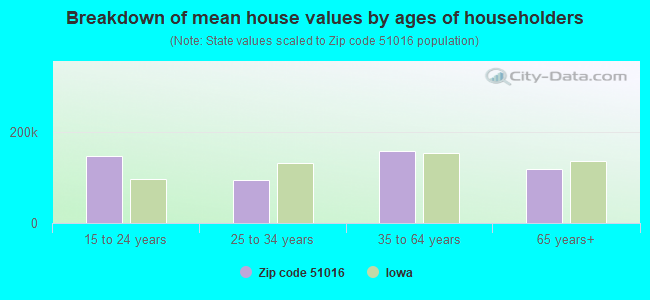
Median house value below state average.
Unemployed percentage below state average.
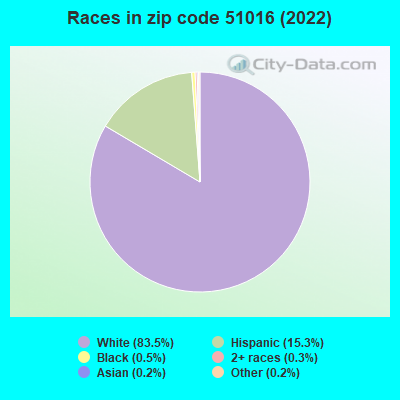
Black race population percentage significantly below state average.
Hispanic race population percentage above state average.
Renting percentage significantly below state average.
Length of stay since moving in significantly below state average.
Number of college students significantly below state average.
Percentage of population with a bachelor's degree or higher below state average.
Averages for the 2020 tax year for zip code 51016, filed in 2021:
Average Adjusted Gross Income (AGI) in 2020: $61,515 (Individual Income Tax Returns)
Here:
$61,515
State:
$71,087
Salary/wage: $46,621 (reported on 77.0% of returns)
Here:
$46,621
State:
$57,361
(% of AGI for various income ranges: 1473.0% for AGIs below $25k, 3535.8% for AGIs $25k-50k, 7033.8% for AGIs $50k-75k, 8710.0% for AGIs $75k-100k, 17712.5% for AGIs $100k-200k)
Taxable interest for individuals: $1,373 (reported on 36.1% of returns)
This zip code:
$1,373
Iowa:
$1,633
(% of AGI for various income ranges: 27.0% for AGIs below $25k, 31.7% for AGIs $25k-50k, 35.0% for AGIs $50k-75k, 67.5% for AGIs $75k-100k, 455.0% for AGIs $100k-200k)
Ordinary dividends: $4,075 (reported on 13.1% of returns)
Here:
$4,075
State:
$5,432
(% of AGI for various income ranges: 93.3% for AGIs $25k-50k, 535.0% for AGIs $100k-200k)
Net capital gain/loss in AGI: +$9,067 (reported on 14.8% of returns)
Here:
+$9,067
State:
+$15,243
(% of AGI for various income ranges: 131.0% for AGIs below $25k, 200.0% for AGIs $50k-75k, 1312.5% for AGIs $100k-200k)
Profit/loss from business: +$8,350 (reported on 16.4% of returns)
Here:
+$8,350
State:
+$11,763
(% of AGI for various income ranges: 173.0% for AGIs below $25k, 236.7% for AGIs $25k-50k, 945.0% for AGIs $75k-100k)
Taxable individual retirement arrangement distribution: $7,600 (reported on 8.2% of returns)
51016:
$7,600
Iowa:
$17,324
(% of AGI for various income ranges: 134.0% for AGIs below $25k, 307.5% for AGIs $50k-75k)
Total itemized deductions: $34,300 (reported on 3.3% of returns)
Here:
$34,300
State:
$33,775
(% of AGI for various income ranges: 571.7% for AGIs $25k-50k)
Taxes paid: $6,950 (reported on 3.3% of returns)
51016:
$6,950
State:
$7,704
(% of AGI for various income ranges: 115.8% for AGIs $25k-50k)
Earned income credit: $2,212 (reported on 13.1% of returns)
Here:
$2,212
State:
$2,195
(% of AGI for various income ranges: 87.0% for AGIs below $25k, 75.0% for AGIs $25k-50k)
Percentage of individuals using paid preparers for their 2020 taxes: 95.1%
Here:
95%
State:
95%
(% for various income ranges: 94.1% for AGIs below $25k, 94.1% for AGIs $25k-50k, 91.7% for AGIs $50k-75k, 100.0% for AGIs $75k-100k, 100.0% for AGIs $100k-200k)
Averages for the 2012 tax year for zip code 51016, filed in 2013:
Average Adjusted Gross Income (AGI) in 2012: $54,483 (Individual Income Tax Returns)
Here:
$54,483
State:
$58,860
Salary/wage: $36,890 (reported on 80.0% of returns)
Here:
$36,890
State:
$46,659
(% of AGI for various income ranges: 69.3% for AGIs below $25k, 76.7% for AGIs $25k-50k, 65.2% for AGIs $50k-75k, 69.2% for AGIs $75k-100k, 30.6% for AGIs $100k-200k)
Taxable interest for individuals: $1,185 (reported on 43.3% of returns)
This zip code:
$1,185
Iowa:
$1,537
(% of AGI for various income ranges: 2.4% for AGIs below $25k, 1.1% for AGIs $25k-50k, 0.9% for AGIs $50k-75k, 0.6% for AGIs $75k-100k, 0.7% for AGIs $100k-200k)
Ordinary dividends: $2,309 (reported on 18.3% of returns)
Here:
$2,309
State:
$4,542
(% of AGI for various income ranges: 1.2% for AGIs below $25k, 0.3% for AGIs $25k-50k, 0.8% for AGIs $50k-75k, 1.2% for AGIs $100k-200k)
Net capital gain/loss in AGI: +$10,678 (reported on 15.0% of returns)
Here:
+$10,678
State:
+$11,802
(% of AGI for various income ranges: 1.9% for AGIs $25k-50k, 0.3% for AGIs $50k-75k, 6.2% for AGIs $100k-200k)
Profit/loss from business: +$4,933 (reported on 15.0% of returns)
Here:
+$4,933
State:
+$10,509
(% of AGI for various income ranges: 4.3% for AGIs below $25k, 2.7% for AGIs $25k-50k, 3.0% for AGIs $50k-75k)
Taxable individual retirement arrangement distribution: $4,733 (reported on 10.0% of returns)
51016:
$4,733
Iowa:
$11,773
Total itemized deductions: $19,983 (18% of AGI, reported on 20.0% of returns)
Here:
$19,983
State:
$21,278
Here:
17.6% of AGI
State:
18.9% of AGI
(% of AGI for various income ranges: 9.0% for AGIs $25k-50k, 6.8% for AGIs $50k-75k, 10.2% for AGIs $75k-100k, 7.0% for AGIs $100k-200k)
Charity contributions: $3,650 (reported on 16.7% of returns)
Here:
$3,650
State:
$4,044
(% of AGI for various income ranges: 0.9% for AGIs $25k-50k, 2.5% for AGIs $50k-75k, 1.2% for AGIs $100k-200k)
Taxes paid: $6,467 (reported on 20.0% of returns)
51016:
$6,467
State:
$8,846
(% of AGI for various income ranges: 1.5% for AGIs $25k-50k, 1.7% for AGIs $50k-75k, 2.7% for AGIs $75k-100k, 3.4% for AGIs $100k-200k)
Earned income credit: $1,973 (reported on 18.3% of returns)
Here:
$1,973
State:
$2,098
(% of AGI for various income ranges: 6.1% for AGIs below $25k, 1.1% for AGIs $25k-50k)
Percentage of individuals using paid preparers for their 2012 taxes: 75.0%
Here:
75%
State:
65%
(% for various income ranges: 70.0% for AGIs below $25k, 72.2% for AGIs $25k-50k, 77.8% for AGIs $50k-75k, 83.3% for AGIs $75k-100k, 85.7% for AGIs $100k-200k)
Averages for the 2004 tax year for zip code 51016, filed in 2005:
Average Adjusted Gross Income (AGI) in 2004: $33,219 (Individual Income Tax Returns)
Here:
$33,219
State:
$43,875
Salary/wage: $31,236 (reported on 80.5% of returns)
Here:
$31,236
State:
$38,265
(% of AGI for various income ranges: 131.1% for AGIs below $10k, 72.0% for AGIs $10k-25k, 84.6% for AGIs $25k-50k, 76.5% for AGIs $50k-75k, 79.9% for AGIs $75k-100k, 42.1% for AGIs over 100k)
Taxable interest for individuals: $1,478 (reported on 50.5% of returns)
This zip code:
$1,478
Iowa:
$1,768
(% of AGI for various income ranges: 10.2% for AGIs below $10k, 6.4% for AGIs $10k-25k, 1.3% for AGIs $25k-50k, 1.2% for AGIs $50k-75k, 0.5% for AGIs $75k-100k, 3.4% for AGIs over 100k)
Taxable dividends: $1,775 (reported on 20.7% of returns)
Here:
$1,775
State:
$2,510
(% of AGI for various income ranges: 5.4% for AGIs below $10k, 1.5% for AGIs $10k-25k, 0.8% for AGIs $25k-50k, 1.1% for AGIs $50k-75k, 0.3% for AGIs $75k-100k, 1.7% for AGIs over 100k)
Net capital gain/loss: +$1,723 (reported on 20.9% of returns)
Here:
+$1,723
State:
+$6,139
(% of AGI for various income ranges: -2.7% for AGIs below $10k, 0.0% for AGIs $10k-25k, 1.8% for AGIs $25k-50k, 1.4% for AGIs $50k-75k, 1.4% for AGIs over 100k)
Profit/loss from business: +$2,930 (reported on 13.8% of returns)
Here:
+$2,930
State:
+$8,574
(% of AGI for various income ranges: 10.7% for AGIs below $10k, 3.0% for AGIs $10k-25k, 1.6% for AGIs $25k-50k, 0.4% for AGIs $50k-75k)
Profit/loss from farming: +$3,098 (reported on 18.0% of returns)
Here:
+$3,098
State:
-$74
(% of AGI for various income ranges: -55.0% for AGIs below $10k, -2.6% for AGIs $10k-25k, 3.2% for AGIs $25k-50k, -0.9% for AGIs $50k-75k, 16.4% for AGIs $75k-100k)
IRA payment deduction: $2,917 (reported on 1.9% of returns)
51016:
$2,917
Iowa:
$2,970
Total itemized deductions: $16,593 (28% of AGI, reported on 19.0% of returns)
Here:
$16,593
State:
$16,976
Here:
28.5% of AGI
State:
20.8% of AGI
(% of AGI for various income ranges: 8.8% for AGIs $10k-25k, 7.0% for AGIs $25k-50k, 11.4% for AGIs $50k-75k, 10.7% for AGIs $75k-100k, 12.6% for AGIs over 100k)
Charity contributions deductions: $3,104 (5% of AGI, reported on 15.4% of returns)
Here:
$3,104
State:
$3,089
Here:
5.2% of AGI
State:
3.6% of AGI
(% of AGI for various income ranges: 1.1% for AGIs $10k-25k, 0.9% for AGIs $25k-50k, 1.9% for AGIs $50k-75k, 2.7% for AGIs $75k-100k, 1.2% for AGIs over 100k)
Total tax: $3,790 (reported on 74.3% of returns)
51016:
$3,790
State:
$6,177
(% of AGI for various income ranges: 4.1% for AGIs below $10k, 5.3% for AGIs $10k-25k, 6.0% for AGIs $25k-50k, 7.8% for AGIs $50k-75k, 10.8% for AGIs $75k-100k, 17.5% for AGIs over 100k)
Earned income credit: $1,380 (reported on 14.8% of returns)
Here:
$1,380
State:
$1,540
Percentage of individuals using paid preparers for their 2004 taxes: 83.3%
Here:
83%
State:
70%
(% for various income ranges: 76.6% for AGIs below $10k, 84.2% for AGIs $10k-25k, 84.4% for AGIs $25k-50k, 87.6% for AGIs $50k-75k, 88.2% for AGIs $75k-100k, 81.0% for AGIs over 100k)
Likely homosexual households (counted as self-reported same-sex unmarried-partner households)
Lesbian couples: 0.0% of all households
Gay men: 1.6% of all households
Household received Food Stamps/SNAP in the past 12 months: 32 Household did not receive Food Stamps/SNAP in the past 12 months: 406
Women who had a birth in the past 12 months: 8 (5 now married, 2 unmarried) Women who did not have a birth in the past 12 months: 162 (92 now married, 69 unmarried)
Housing units in zip code 51016 with a mortgage: 182 (11 second mortgage, 6 both second mortgage and home equity loan) Houses without a mortgage: 5
Median monthly owner costs for units with a mortgage: $965 Median monthly owner costs for units without a mortgage: $452
Residents with income below the poverty level in 2022:
This zip code:
7.9%
Whole state:
11.0%
Residents with income below 50% of the poverty level in 2022:
This zip code:
2.4%
Whole state:
5.5%
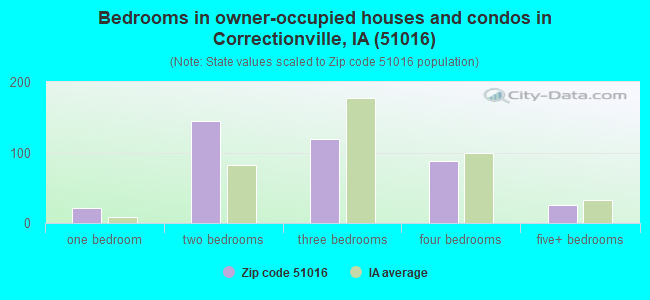
Median number of rooms in houses and condos:
Here:
6.4
State:
6.8
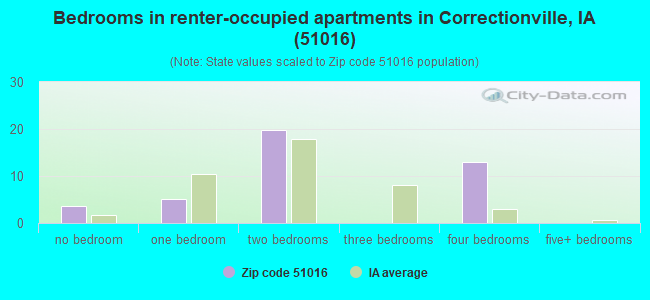
Median number of rooms in apartments:
Here:
6.2
State:
4.2
Notable locations in this zip code not listed on our city pages
Notable locations in zip code 51016: Rock Branch (A), Walling River Access (B), Western Iowa Co-op Elevator (C), Correctionville Golf Club (D), Correctionville Fire and Rescue (E), Correctionville Library (F). Display/hide their locations on the map
Churches in zip code 51016 include: Assembly of God Church (A), Grace United Methodist Church (B), Grace Lutheran Church (C), Church of Christ (D), Hillside Church (E), Rock Branch Church (F), Salem Church (G). Display/hide their locations on the map
Parks in zip code 51016 include: Historic Sioux City State Historical Marker (1), Copeland Park (2), Little Sioux County Park (3), Shagbark Hills Area (4), Sioux Bend Wildlife Area (5). Display/hide their locations on the map
In group quarters: 33 (-1 institutionalized population)
Size of family households: 127 2-persons, 52 3-persons, 49 4-persons, 22 5-persons, 13 6-persons
Size of nonfamily households: 148 1-person, 24 2-persons
163 married couples with children.
91 single-parent households (48 men, 43 women).
82.0% of residents of 51016 zip code speak English at home.
13.7% of residents speak Spanish at home (81% very well, 1% well, 17% not well).
1.4% of residents speak other Indo-European language at home (100% very well).
0.9% of residents speak Asian or Pacific Island language at home (100% very well).
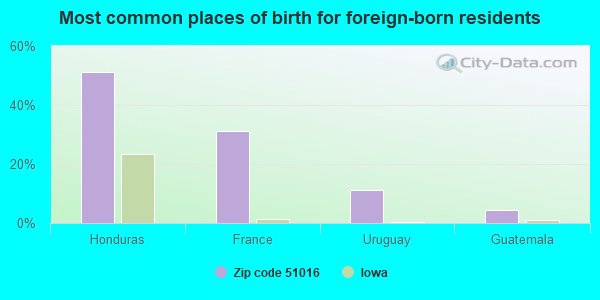
Foreign born population: 48 (4.3%) (74.0% of them are naturalized citizens)
This zip code:
4.3%
Whole state:
6.0%
51%Honduras
31%France
11%Uruguay
4%Guatemala
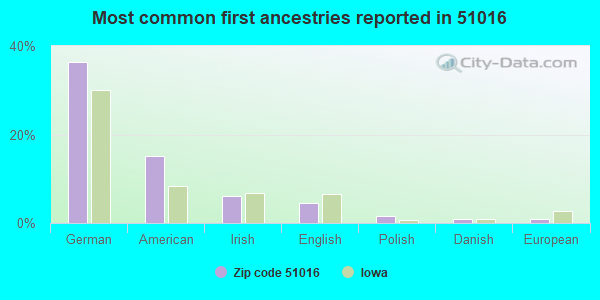
36%German
15%American
6%Irish
5%English
2%Polish
1%Danish
1%European
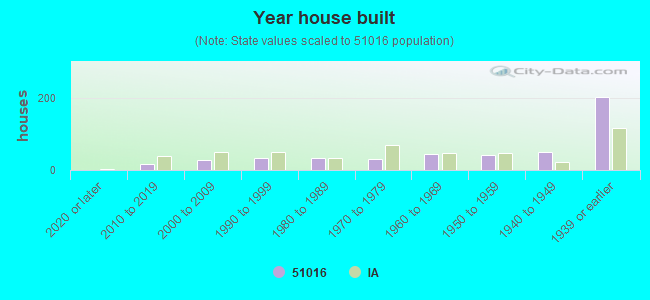
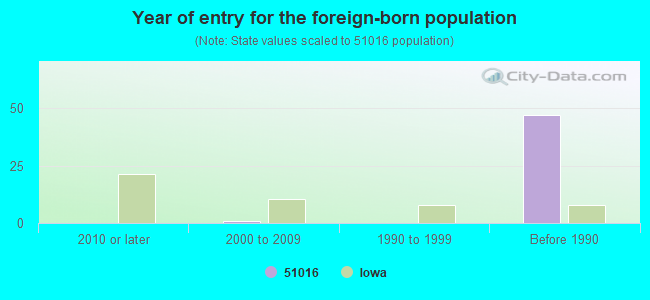
Year of entry for the foreign-born population
02010 or later
12000 to 2009
01990 to 1999
47Before 1990
Facilities with environmental interests located in this zip code:
RIVER VALLEY HIGH SCHOOL (916 HACKBERRY ST in CORRECTIONVILLE, IA)
(Geographic Names Information System) (National Center for Education Statistics) - STATE ID-971975 109 Organizations: RIVER VALLEY COMM SCHOOL DISTRICT (SCHOOL DISTRICT)
CORRECTIONVILLE-BUCK PIT (1003 HIGHWAY 31 in CORRECTIONVILLE, IA)
National Pollutant Discharge Elimination System NON-MAJOR (Tracking pollutant discharge elimination systems) - permit Business SIC classification: CRUSHED AND BROKEN LIMESTONE Organizations: BILL L. PETERS (CONTACT/OWNER)
Alternative names: HALLETT MATERIALS
CORRECTIONVILLE-COCKBURN (4070 180TH in CORRECTIONVILLE, IA)
National Pollutant Discharge Elimination System NON-MAJOR (Tracking pollutant discharge elimination systems) - permit Business SIC classification: CRUSHED AND BROKEN LIMESTONE Organizations: HALLETT MATERIALS (CONTACT/OWNER)
Alternative names: HALLETT MATERIALS
COLONIAL MANOR (1116 E HWY 20 in CORRECTIONVILLE, IA)
(Resource Conservation and Recovery Act (tracking hazardous waste))
CORRECTIONVILLE CITY OF STP (312 DRIFTWOOD STREET in CORRECTIONVILLE, IA)
National Pollutant Discharge Elimination System NON-MAJOR (Tracking pollutant discharge elimination systems) - permit Business SIC classification: SEWERAGE SYSTEMS Organizations: CITY OF CORRECTIONVILLE (CONTACT/OWNER)
CORRECTIONVILLE-BRIESE (1648 O'BRIEN in CORRECTIONVILLE, IA)
National Pollutant Discharge Elimination System NON-MAJOR (Tracking pollutant discharge elimination systems) - permit Business SIC classification: CRUSHED AND BROKEN LIMESTONE Organizations: FRED A. BRIESE (CONTACT/OWNER)
Alternative names: HALLETT MATERIALS
CROCKER PIT (1001 PRESTON BLVD in CORRECTIONVILLE, IA)
National Pollutant Discharge Elimination System NON-MAJOR (Tracking pollutant discharge elimination systems) - permit Business SIC classification: CRUSHED AND BROKEN LIMESTONE Organizations: HAROLD CROCKER (CONTACT/OWNER)
Alternative names: BECKER GRAVEL CO INC
BROWER CONSTRUCTION CO (OSCEOLA AVE & 150TH ST 1.4 MI in CORRECTIONVILLE, IA)
(Resource Conservation and Recovery Act (tracking hazardous waste)) Business NAICS classification: ASPHALT PAVING MIXTURE AND BLOCK MANUFACTURING.
BROWER CONSTRUCTION CO-FORMER SITE OF (HWY 31 & COUNTY RD D-15 in CORRECTIONVILLE, IA)
(Resource Conservation and Recovery Act (tracking hazardous waste)) Business NAICS classification: ASPHALT PAVING MIXTURE AND BLOCK MANUFACTURING.
BROWER CONSTRUCTION CO-FORMER SITE OF (HWY 31, S OF CORRECTIONVILLE in CORRECTIONVILLE, IA)
(Resource Conservation and Recovery Act (tracking hazardous waste)) Business NAICS classification: ASPHALT PAVING MIXTURE AND BLOCK MANUFACTURING.
CORNER HARDWARE (402 5TH in CORRECTIONVILLE, IA)
COMPLIANCE ACTIVITY (Tracking inspections of insecticide, fungicide, and rodenticide, and toxic substances)
Housing units lacking complete plumbing facilities: 3.8% Housing units lacking complete kitchen facilities: 4.4%
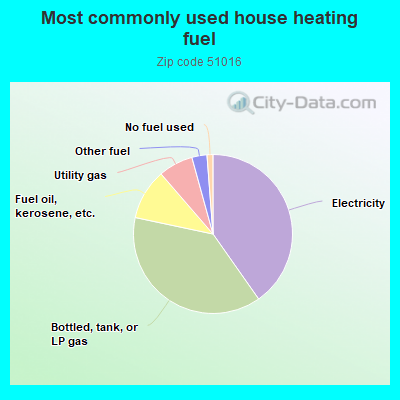
40.5%Electricity
38.3%Bottled, tank, or LP gas
10.4%Fuel oil, kerosene, etc.
7.1%Utility gas
3.1%Other fuel
1.2%No fuel used
Population in 1990: 1,432. Population change in the 1990s: +19 (+1.3%).
Place of birth for U.S.-born residents:
This state: 944
Northeast: 11
Midwest: 77
South: 11
West: 24
66% of the 51016 zip code residents lived in the same house 5 years ago. Out of people who lived in different houses, 65% lived in this county. Out of people who lived in different counties, 50% lived in Iowa.
89% of the 51016 zip code residents lived in the same house 1 year ago. Out of people who lived in different houses, 59% moved from this county. Out of people who lived in different houses, 23% moved from different county within same state. Out of people who lived in different houses, 14% moved from different state.
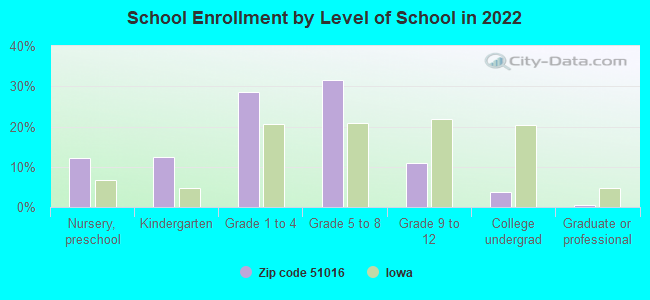
Private vs. public school enrollment:
Students in private schools in grades 1 to 8 (elementary and middle school):
Here:
0.0%
Iowa:
10.6%
Students in private schools in grades 9 to 12 (high school):
Here:
0.0%
Iowa:
7.9%
Students in private undergraduate colleges: 2
Here:
22.9%
Iowa:
23.9%
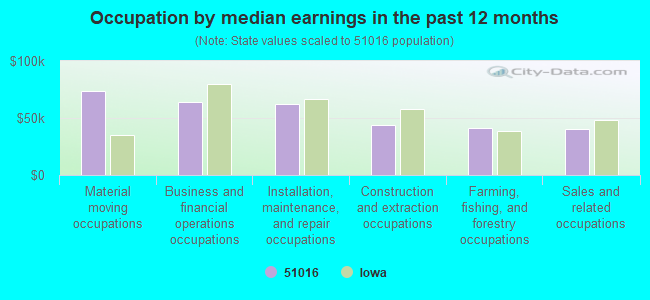
Occupation by median earnings in the past 12 months ($)
73,816Material moving occupations
63,851Business and financial operations occupations
62,041Installation, maintenance, and repair occupations
44,084Construction and extraction occupations
41,088Farming, fishing, and forestry occupations
40,578Sales and related occupations
Top industries in this zip code by the number of employees in 2005:
Construction: Highway, Street, and Bridge Construction (20-49 employees: 1 establishment, 1-4 employees: 1 establishment)
Health Care and Social Assistance: Nursing Care Facilities (20-49: 1)
Accommodation and Food Services: Full-Service Restaurants (10-19: 1, 5-9: 1)
Accommodation and Food Services: Drinking Places (Alcoholic Beverages) (10-19: 1)
Other Services (except Public Administration): Automotive Body, Paint, and Interior Repair and Maintenance (5-9: 1)
Health Care and Social Assistance: Offices of Physicians (except Mental Health Specialists) (5-9: 1)
People in group quarters in 2010:
40 people in nursing facilities/skilled-nursing facilities
People in group quarters in 2000:
36 people in nursing homes
16 people in homes or halfway houses for drug/alcohol abuse
Home Mortgage Disclosure Act Aggregated Statistics For Year 2009 (Based on 2 partial tracts)
A) FHA, FSA/RHS & VA Home Purchase Loans
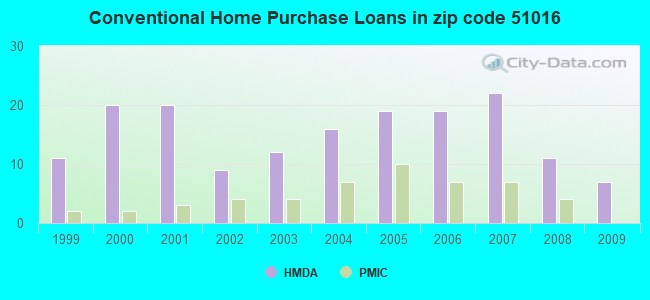
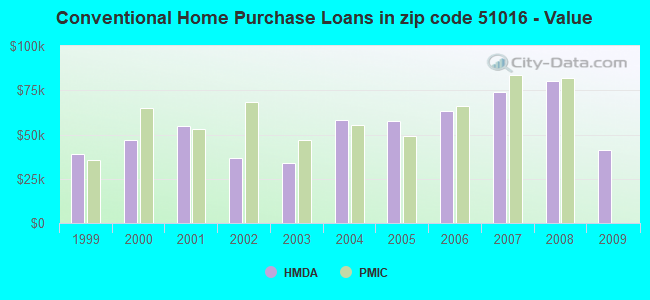
B) Conventional Home Purchase Loans
C) Refinancings
D) Home Improvement Loans
F) Non-occupant Loans on < 5 Family Dwellings (A B C & D)
G) Loans On Manufactured Home Dwelling (A B C & D)
Number
Average Value
Number
Average Value
Number
Average Value
Number
Average Value
Number
Average Value
Number
Average Value
LOANS ORIGINATED
5
$66,438
7
$41,524
29
$114,923
8
$14,218
2
$169,710
4
$53,560
APPLICATIONS APPROVED, NOT ACCEPTED
1
$75,830
0
$0
1
$88,460
1
$3,010
0
$0
0
$0
APPLICATIONS DENIED
1
$83,050
2
$64,395
13
$96,335
4
$36,410
1
$4,210
0
$0
APPLICATIONS WITHDRAWN
0
$0
1
$84,250
9
$98,561
1
$21,060
0
$0
0
$0
FILES CLOSED FOR INCOMPLETENESS
0
$0
0
$0
1
$78,840
0
$0
0
$0
0
$0
Aggregated Statistics For Year 2008 (Based on 2 partial tracts)
A) FHA, FSA/RHS & VA Home Purchase Loans
B) Conventional Home Purchase Loans
C) Refinancings
D) Home Improvement Loans
F) Non-occupant Loans on < 5 Family Dwellings (A B C & D)
G) Loans On Manufactured Home Dwelling (A B C & D)
Number
Average Value
Number
Average Value
Number
Average Value
Number
Average Value
Number
Average Value
Number
Average Value
LOANS ORIGINATED
8
$70,260
11
$80,149
27
$94,126
8
$26,404
7
$113,911
1
$113,140
APPLICATIONS APPROVED, NOT ACCEPTED
2
$38,815
1
$24,670
2
$128,185
0
$0
0
$0
1
$90,270
APPLICATIONS DENIED
2
$59,880
5
$37,192
17
$104,607
4
$43,932
0
$0
2
$213,035
APPLICATIONS WITHDRAWN
0
$0
1
$69,810
7
$75,827
2
$19,560
1
$25,880
1
$67,400
FILES CLOSED FOR INCOMPLETENESS
1
$54,760
0
$0
1
$23,470
0
$0
0
$0
1
$54,760
Aggregated Statistics For Year 2007 (Based on 2 partial tracts)
A) FHA, FSA/RHS & VA Home Purchase Loans
B) Conventional Home Purchase Loans
C) Refinancings
D) Home Improvement Loans
F) Non-occupant Loans on < 5 Family Dwellings (A B C & D)
G) Loans On Manufactured Home Dwelling (A B C & D)
Number
Average Value
Number
Average Value
Number
Average Value
Number
Average Value
Number
Average Value
Number
Average Value
LOANS ORIGINATED
1
$40,320
22
$74,076
35
$67,316
5
$31,776
4
$67,702
1
$64,990
APPLICATIONS APPROVED, NOT ACCEPTED
0
$0
0
$0
4
$41,222
3
$46,740
0
$0
0
$0
APPLICATIONS DENIED
0
$0
6
$44,433
14
$82,876
8
$40,546
0
$0
1
$97,490
APPLICATIONS WITHDRAWN
0
$0
1
$94,480
10
$79,077
2
$34,605
0
$0
1
$48,750
FILES CLOSED FOR INCOMPLETENESS
0
$0
0
$0
1
$25,280
0
$0
0
$0
0
$0
Aggregated Statistics For Year 2006 (Based on 2 partial tracts)
A) FHA, FSA/RHS & VA Home Purchase Loans
B) Conventional Home Purchase Loans
C) Refinancings
D) Home Improvement Loans
F) Non-occupant Loans on < 5 Family Dwellings (A B C & D)
G) Loans On Manufactured Home Dwelling (A B C & D)
Number
Average Value
Number
Average Value
Number
Average Value
Number
Average Value
Number
Average Value
Number
Average Value
LOANS ORIGINATED
2
$40,620
19
$63,284
31
$63,907
7
$19,773
8
$26,555
2
$80,940
APPLICATIONS APPROVED, NOT ACCEPTED
0
$0
2
$93,880
5
$105,916
1
$17,450
0
$0
1
$77,030
APPLICATIONS DENIED
0
$0
8
$55,365
26
$84,113
11
$29,105
1
$50,550
1
$49,350
APPLICATIONS WITHDRAWN
0
$0
1
$91,470
13
$75,040
2
$46,940
1
$24,070
0
$0
FILES CLOSED FOR INCOMPLETENESS
0
$0
1
$72,220
2
$105,315
1
$27,080
0
$0
0
$0
Aggregated Statistics For Year 2005 (Based on 2 partial tracts)
A) FHA, FSA/RHS & VA Home Purchase Loans
B) Conventional Home Purchase Loans
C) Refinancings
D) Home Improvement Loans
F) Non-occupant Loans on < 5 Family Dwellings (A B C & D)
G) Loans On Manufactured Home Dwelling (A B C & D)
Number
Average Value
Number
Average Value
Number
Average Value
Number
Average Value
Number
Average Value
Number
Average Value
LOANS ORIGINATED
1
$14,440
19
$57,424
36
$65,145
8
$18,580
8
$33,701
1
$58,980
APPLICATIONS APPROVED, NOT ACCEPTED
0
$0
1
$20,460
7
$73,763
2
$11,435
0
$0
0
$0
APPLICATIONS DENIED
1
$40,920
7
$65,080
23
$62,901
7
$17,109
0
$0
1
$15,650
APPLICATIONS WITHDRAWN
0
$0
1
$95,690
7
$76,170
1
$55,970
0
$0
0
$0
FILES CLOSED FOR INCOMPLETENESS
0
$0
0
$0
7
$77,030
0
$0
0
$0
0
$0
Aggregated Statistics For Year 2004 (Based on 2 partial tracts)
A) FHA, FSA/RHS & VA Home Purchase Loans
B) Conventional Home Purchase Loans
C) Refinancings
D) Home Improvement Loans
F) Non-occupant Loans on < 5 Family Dwellings (A B C & D)
G) Loans On Manufactured Home Dwelling (A B C & D)
Number
Average Value
Number
Average Value
Number
Average Value
Number
Average Value
Number
Average Value
Number
Average Value
LOANS ORIGINATED
2
$45,735
16
$58,299
38
$73,388
7
$14,873
4
$44,682
1
$48,140
APPLICATIONS APPROVED, NOT ACCEPTED
0
$0
1
$47,540
7
$68,347
0
$0
0
$0
0
$0
APPLICATIONS DENIED
0
$0
6
$36,208
21
$67,717
7
$21,407
2
$36,710
3
$37,310
APPLICATIONS WITHDRAWN
1
$43,930
2
$64,090
7
$56,397
1
$102,310
0
$0
1
$30,090
FILES CLOSED FOR INCOMPLETENESS
0
$0
0
$0
4
$102,005
0
$0
0
$0
0
$0
Aggregated Statistics For Year 2003 (Based on 2 partial tracts)
A) FHA, FSA/RHS & VA Home Purchase Loans
B) Conventional Home Purchase Loans
C) Refinancings
D) Home Improvement Loans
F) Non-occupant Loans on < 5 Family Dwellings (A B C & D)
Number
Average Value
Number
Average Value
Number
Average Value
Number
Average Value
Number
Average Value
LOANS ORIGINATED
1
$66,200
12
$33,651
45
$60,220
8
$17,752
4
$38,365
APPLICATIONS APPROVED, NOT ACCEPTED
0
$0
2
$58,075
5
$63,912
2
$14,745
0
$0
APPLICATIONS DENIED
1
$16,250
4
$37,160
21
$71,041
2
$27,985
3
$73,420
APPLICATIONS WITHDRAWN
0
$0
1
$30,090
11
$86,331
1
$3,610
0
$0
FILES CLOSED FOR INCOMPLETENESS
0
$0
0
$0
2
$101,100
0
$0
0
$0
Aggregated Statistics For Year 2002 (Based on 2 partial tracts)
A) FHA, FSA/RHS & VA Home Purchase Loans
B) Conventional Home Purchase Loans
C) Refinancings
D) Home Improvement Loans
F) Non-occupant Loans on < 5 Family Dwellings (A B C & D)
Number
Average Value
Number
Average Value
Number
Average Value
Number
Average Value
Number
Average Value
LOANS ORIGINATED
1
$38,520
9
$36,643
50
$57,664
9
$11,233
3
$30,693
APPLICATIONS APPROVED, NOT ACCEPTED
0
$0
0
$0
9
$88,398
1
$13,240
0
$0
APPLICATIONS DENIED
1
$37,310
2
$35,805
18
$57,405
4
$11,282
2
$72,515
APPLICATIONS WITHDRAWN
0
$0
0
$0
15
$56,449
0
$0
1
$39,720
FILES CLOSED FOR INCOMPLETENESS
0
$0
0
$0
5
$52,356
0
$0
0
$0
Aggregated Statistics For Year 2001 (Based on 2 partial tracts)
A) FHA, FSA/RHS & VA Home Purchase Loans
B) Conventional Home Purchase Loans
C) Refinancings
D) Home Improvement Loans
F) Non-occupant Loans on < 5 Family Dwellings (A B C & D)
Number
Average Value
Number
Average Value
Number
Average Value
Number
Average Value
Number
Average Value
LOANS ORIGINATED
2
$75,225
20
$54,945
62
$50,153
10
$16,068
5
$48,024
APPLICATIONS APPROVED, NOT ACCEPTED
1
$18,660
0
$0
6
$46,138
0
$0
0
$0
APPLICATIONS DENIED
0
$0
4
$39,118
23
$43,748
2
$22,265
1
$15,050
APPLICATIONS WITHDRAWN
0
$0
2
$45,735
14
$50,723
1
$5,420
0
$0
FILES CLOSED FOR INCOMPLETENESS
0
$0
0
$0
2
$73,720
0
$0
0
$0
Aggregated Statistics For Year 2000 (Based on 2 partial tracts)
A) FHA, FSA/RHS & VA Home Purchase Loans
B) Conventional Home Purchase Loans
C) Refinancings
D) Home Improvement Loans
F) Non-occupant Loans on < 5 Family Dwellings (A B C & D)
Number
Average Value
Number
Average Value
Number
Average Value
Number
Average Value
Number
Average Value
LOANS ORIGINATED
4
$46,790
20
$46,700
30
$39,418
10
$13,661
5
$36,348
APPLICATIONS APPROVED, NOT ACCEPTED
1
$30,090
2
$56,870
5
$48,024
2
$44,535
0
$0
APPLICATIONS DENIED
0
$0
9
$39,451
14
$57,988
5
$31,052
1
$66,200
APPLICATIONS WITHDRAWN
0
$0
2
$85,755
10
$51,213
2
$12,035
1
$50,550
FILES CLOSED FOR INCOMPLETENESS
0
$0
0
$0
2
$80,640
0
$0
0
$0
Aggregated Statistics For Year 1999 (Based on 1 partial tract)
A) FHA, FSA/RHS & VA Home Purchase Loans
B) Conventional Home Purchase Loans
C) Refinancings
D) Home Improvement Loans
F) Non-occupant Loans on < 5 Family Dwellings (A B C & D)


+$3,098
-$74
(% of AGI for various income ranges: -55.0% for AGIs below $10k, -2.6% for AGIs $10k-25k, 3.2% for AGIs $25k-50k, -0.9% for AGIs $50k-75k, 16.4% for AGIs $75k-100k) Nearest zip codes: 51048, 51018, 51061, 51004, 51044, 51019.