Estimated zip code population in 2022: 1,453 Zip code population in 2010: 1,583 Zip code population in 2000: 1,790
Houses and condos: 1,054 Renter-occupied apartments: 83
% of renters here:
12%
State:
28%
March 2022 cost of living index in zip code 51450: 81.6 (low, U.S. average is 100)
Land area: 59.2 sq. mi. Water area: 1.7 sq. mi.
Population density: 25 people per square mile
(very low).
OSM Map
General Map
Google Map
MSN Map
OSM Map
General Map
Google Map
MSN Map
OSM Map
General Map
Google Map
MSN Map
OSM Map
General Map
Google Map
MSN Map
Please wait while loading the map...
Real estate property taxes paid for housing units in 2022:
This zip code:
0.7% ($1,309)
Iowa:
1.4% ($2,724)
Median real estate property taxes paid for housing units with mortgages in 2022: $1,238 (0.7%) Median real estate property taxes paid for housing units with no mortgage in 2022: $1,386 (0.8%)
Business Search- 14 Million verified businesses
Males: 682
(47.0%)
Females: 770
(53.0%)
For population 25 years and over in 51450:
High school or higher: 96.9%
Bachelor's degree or higher: 30.3%
Graduate or professional degree: 9.6%
Unemployed: 0.6%
Mean travel time to work (commute): 20.5 minutes
For population 15 years and over in 51450:
Never married: 14.9%
Now married: 64.0%
Separated: 0.2%
Widowed: 10.6%
Divorced: 10.3%
Zip code 51450 compared to state average:
Unemployed percentage significantly below state average.
Black race population percentage significantly below state average.
Hispanic race population percentage significantly below state average.
Median age significantly above state average.
Foreign-born population percentage significantly below state average.
Renting percentage below state average.
Length of stay since moving in above state average.
Estimated median house/condo value in 2022: $178,419
51450:
$178,419
Iowa:
$194,600
According to our research of Iowa and other state lists, there were 3 registered sex offenders living in 51450 zip code as of June 19, 2024. The ratio of all residents to sex offenders in zip code 51450 is 471 to 1. The ratio of registered sex offenders to all residents in this zip code is near the state average.
Median resident age:
This zip code:
54.6 years
Iowa median age:
38.9 years
Average household size:
This zip code:
2.1 people
Iowa:
2.3 people
Averages for the 2020 tax year for zip code 51450, filed in 2021:
Average Adjusted Gross Income (AGI) in 2020: $63,265 (Individual Income Tax Returns)
Here:
$63,265
State:
$71,087
Salary/wage: $46,539 (reported on 73.5% of returns)
Here:
$46,539
State:
$57,361
(% of AGI for various income ranges: 1139.4% for AGIs below $25k, 3466.9% for AGIs $25k-50k, 6661.2% for AGIs $50k-75k, 9490.0% for AGIs $75k-100k, 13647.1% for AGIs $100k-200k)
Taxable interest for individuals: $1,625 (reported on 48.2% of returns)
This zip code:
$1,625
Iowa:
$1,633
(% of AGI for various income ranges: 38.8% for AGIs below $25k, 110.8% for AGIs $25k-50k, 68.8% for AGIs $50k-75k, 208.0% for AGIs $75k-100k, 241.4% for AGIs $100k-200k)
Ordinary dividends: $4,238 (reported on 28.9% of returns)
Here:
$4,238
State:
$5,432
(% of AGI for various income ranges: 20.6% for AGIs below $25k, 53.8% for AGIs $25k-50k, 172.5% for AGIs $50k-75k, 46.0% for AGIs $75k-100k, 1075.7% for AGIs $100k-200k)
Net capital gain/loss in AGI: +$11,785 (reported on 24.1% of returns)
Here:
+$11,785
State:
+$15,243
(% of AGI for various income ranges: 46.2% for AGIs below $25k, 58.5% for AGIs $25k-50k, 200.0% for AGIs $50k-75k, 356.0% for AGIs $75k-100k, 2670.0% for AGIs $100k-200k)
Profit/loss from business: +$14,906 (reported on 20.5% of returns)
Here:
+$14,906
State:
+$11,763
(% of AGI for various income ranges: 133.8% for AGIs below $25k, 105.4% for AGIs $25k-50k, 363.8% for AGIs $50k-75k, 408.0% for AGIs $75k-100k, 2411.4% for AGIs $100k-200k)
Taxable individual retirement arrangement distribution: $14,108 (reported on 15.7% of returns)
51450:
$14,108
Iowa:
$17,324
(% of AGI for various income ranges: 131.2% for AGIs below $25k, 229.2% for AGIs $25k-50k, 842.5% for AGIs $50k-75k, 931.4% for AGIs $100k-200k)
Total itemized deductions: $32,450 (reported on 7.2% of returns)
Here:
$32,450
State:
$33,775
(% of AGI for various income ranges: 1592.5% for AGIs $50k-75k, 961.4% for AGIs $100k-200k)
Charity contributions: $3,520 (reported on 6.0% of returns)
Here:
$3,520
State:
$13,075
(% of AGI for various income ranges: 68.5% for AGIs $25k-50k, 174.0% for AGIs $75k-100k)
Taxes paid: $6,500 (reported on 7.2% of returns)
51450:
$6,500
State:
$7,704
(% of AGI for various income ranges: 253.8% for AGIs $50k-75k, 267.1% for AGIs $100k-200k)
Earned income credit: $1,650 (reported on 9.6% of returns)
Here:
$1,650
State:
$2,195
(% of AGI for various income ranges: 50.0% for AGIs below $25k, 40.0% for AGIs $25k-50k)
Percentage of individuals using paid preparers for their 2020 taxes: 96.4%
Here:
96%
State:
95%
(% for various income ranges: 96.0% for AGIs below $25k, 94.7% for AGIs $25k-50k, 92.9% for AGIs $50k-75k, 100.0% for AGIs $75k-100k, 100.0% for AGIs $100k-200k, 100.0% for AGIs over 200k)
Averages for the 2012 tax year for zip code 51450, filed in 2013:
Average Adjusted Gross Income (AGI) in 2012: $52,531 (Individual Income Tax Returns)
Here:
$52,531
State:
$58,860
Salary/wage: $36,692 (reported on 76.5% of returns)
Here:
$36,692
State:
$46,659
(% of AGI for various income ranges: 60.8% for AGIs below $25k, 67.1% for AGIs $25k-50k, 62.6% for AGIs $50k-75k, 60.1% for AGIs $75k-100k, 68.3% for AGIs $100k-200k)
Taxable interest for individuals: $1,428 (reported on 48.1% of returns)
This zip code:
$1,428
Iowa:
$1,537
(% of AGI for various income ranges: 3.6% for AGIs below $25k, 1.6% for AGIs $25k-50k, 0.8% for AGIs $50k-75k, 1.0% for AGIs $75k-100k, 1.8% for AGIs $100k-200k)
Ordinary dividends: $2,104 (reported on 30.9% of returns)
Here:
$2,104
State:
$4,542
(% of AGI for various income ranges: 1.6% for AGIs below $25k, 0.7% for AGIs $25k-50k, 1.2% for AGIs $50k-75k, 1.2% for AGIs $75k-100k, 2.5% for AGIs $100k-200k)
Net capital gain/loss in AGI: +$2,406 (reported on 21.0% of returns)
Here:
+$2,406
State:
+$11,802
(% of AGI for various income ranges: 1.4% for AGIs $25k-50k, 1.2% for AGIs $50k-75k, 4.4% for AGIs $75k-100k, 1.9% for AGIs $100k-200k)
Profit/loss from business: +$9,567 (reported on 18.5% of returns)
Here:
+$9,567
State:
+$10,509
(% of AGI for various income ranges: 5.5% for AGIs below $25k, 2.1% for AGIs $25k-50k, 9.8% for AGIs $50k-75k, 2.3% for AGIs $100k-200k)
Taxable individual retirement arrangement distribution: $8,369 (reported on 16.0% of returns)
51450:
$8,369
Iowa:
$11,773
(% of AGI for various income ranges: 6.3% for AGIs below $25k, 3.3% for AGIs $25k-50k, 2.6% for AGIs $50k-75k, 7.2% for AGIs $75k-100k)
Total itemized deductions: $19,048 (19% of AGI, reported on 25.9% of returns)
Here:
$19,048
State:
$21,278
Here:
19.3% of AGI
State:
18.9% of AGI
(% of AGI for various income ranges: 13.7% for AGIs below $25k, 9.6% for AGIs $25k-50k, 9.3% for AGIs $50k-75k, 7.3% for AGIs $75k-100k, 15.9% for AGIs $100k-200k)
Charity contributions: $2,641 (reported on 21.0% of returns)
Here:
$2,641
State:
$4,044
(% of AGI for various income ranges: 1.2% for AGIs $25k-50k, 1.2% for AGIs $50k-75k, 1.1% for AGIs $75k-100k, 2.0% for AGIs $100k-200k)
Taxes paid: $6,662 (reported on 25.9% of returns)
51450:
$6,662
State:
$8,846
(% of AGI for various income ranges: 1.4% for AGIs below $25k, 2.0% for AGIs $25k-50k, 2.6% for AGIs $50k-75k, 2.3% for AGIs $75k-100k, 8.6% for AGIs $100k-200k)
Earned income credit: $1,733 (reported on 11.1% of returns)
Here:
$1,733
State:
$2,098
(% of AGI for various income ranges: 2.9% for AGIs below $25k, 0.7% for AGIs $25k-50k)
Percentage of individuals using paid preparers for their 2012 taxes: 74.1%
Here:
74%
State:
65%
(% for various income ranges: 65.5% for AGIs below $25k, 72.7% for AGIs $25k-50k, 78.6% for AGIs $50k-75k, 83.3% for AGIs $75k-100k, 87.5% for AGIs $100k-200k, 100.0% for AGIs over 200k)
Averages for the 2004 tax year for zip code 51450, filed in 2005:
Average Adjusted Gross Income (AGI) in 2004: $35,271 (Individual Income Tax Returns)
Here:
$35,271
State:
$43,875
Salary/wage: $29,316 (reported on 73.9% of returns)
Here:
$29,316
State:
$38,265
(% of AGI for various income ranges: 186.6% for AGIs below $10k, 57.2% for AGIs $10k-25k, 71.0% for AGIs $25k-50k, 65.5% for AGIs $50k-75k, 68.3% for AGIs $75k-100k, 33.2% for AGIs over 100k)
Taxable interest for individuals: $2,395 (reported on 60.8% of returns)
This zip code:
$2,395
Iowa:
$1,768
(% of AGI for various income ranges: 20.5% for AGIs below $10k, 5.0% for AGIs $10k-25k, 4.0% for AGIs $25k-50k, 2.8% for AGIs $50k-75k, 2.4% for AGIs $75k-100k, 5.6% for AGIs over 100k)
Taxable dividends: $1,452 (reported on 41.2% of returns)
Here:
$1,452
State:
$2,510
(% of AGI for various income ranges: 5.7% for AGIs below $10k, 2.8% for AGIs $10k-25k, 1.6% for AGIs $25k-50k, 1.4% for AGIs $50k-75k, 0.3% for AGIs $75k-100k, 2.1% for AGIs over 100k)
Net capital gain/loss: +$6,493 (reported on 26.6% of returns)
Here:
+$6,493
State:
+$6,139
(% of AGI for various income ranges: 1.5% for AGIs below $10k, 3.0% for AGIs $10k-25k, 2.2% for AGIs $25k-50k, 0.8% for AGIs $50k-75k, 2.1% for AGIs $75k-100k, 17.1% for AGIs over 100k)
Profit/loss from business: +$9,052 (reported on 19.9% of returns)
Here:
+$9,052
State:
+$8,574
(% of AGI for various income ranges: -8.3% for AGIs below $10k, 7.7% for AGIs $10k-25k, 2.2% for AGIs $25k-50k, 6.9% for AGIs $50k-75k, 14.7% for AGIs $75k-100k)
Profit/loss from farming: +$2,577 (reported on 10.0% of returns)
Here:
+$2,577
State:
-$74
(% of AGI for various income ranges: -42.6% for AGIs below $10k, 2.5% for AGIs $10k-25k, -1.4% for AGIs $25k-50k, 2.2% for AGIs $50k-75k, 4.0% for AGIs over 100k)
IRA payment deduction: $3,159 (reported on 5.6% of returns)
51450:
$3,159
Iowa:
$2,970
Total itemized deductions: $16,967 (28% of AGI, reported on 23.4% of returns)
Here:
$16,967
State:
$16,976
Here:
28.2% of AGI
State:
20.8% of AGI
(% of AGI for various income ranges: 87.8% for AGIs below $10k, 12.6% for AGIs $10k-25k, 9.6% for AGIs $25k-50k, 9.8% for AGIs $50k-75k, 10.6% for AGIs $75k-100k, 10.3% for AGIs over 100k)
Charity contributions deductions: $1,819 (3% of AGI, reported on 20.5% of returns)
Here:
$1,819
State:
$3,089
Here:
2.9% of AGI
State:
3.6% of AGI
(% of AGI for various income ranges: 2.7% for AGIs below $10k, 0.8% for AGIs $10k-25k, 0.6% for AGIs $25k-50k, 1.2% for AGIs $50k-75k, 0.8% for AGIs $75k-100k, 1.9% for AGIs over 100k)
Total tax: $4,384 (reported on 76.3% of returns)
51450:
$4,384
State:
$6,177
(% of AGI for various income ranges: 9.5% for AGIs below $10k, 4.7% for AGIs $10k-25k, 6.3% for AGIs $25k-50k, 8.7% for AGIs $50k-75k, 11.4% for AGIs $75k-100k, 16.9% for AGIs over 100k)
Earned income credit: $1,391 (reported on 11.2% of returns)
Here:
$1,391
State:
$1,540
Percentage of individuals using paid preparers for their 2004 taxes: 78.3%
Here:
78%
State:
70%
(% for various income ranges: 69.8% for AGIs below $10k, 82.4% for AGIs $10k-25k, 76.3% for AGIs $25k-50k, 80.0% for AGIs $50k-75k, 85.0% for AGIs $75k-100k, 94.4% for AGIs over 100k)
Household received Food Stamps/SNAP in the past 12 months: 58 Household did not receive Food Stamps/SNAP in the past 12 months: 608
Women who had a birth in the past 12 months: 14 (14 now married, 0 unmarried) Women who did not have a birth in the past 12 months: 182 (108 now married, 73 unmarried)
Housing units in zip code 51450 with a mortgage: 223 (3 second mortgage, 3 both second mortgage and home equity loan) Houses without a mortgage: 5
Median monthly owner costs for units with a mortgage: $1,229 Median monthly owner costs for units without a mortgage: $532
Residents with income below the poverty level in 2022:
This zip code:
6.3%
Whole state:
11.0%
Residents with income below 50% of the poverty level in 2022:
This zip code:
5.3%
Whole state:
5.5%
Median number of rooms in houses and condos:
Here:
7.4
State:
6.8
Median number of rooms in apartments:
Here:
4.1
State:
4.2
Notable locations in this zip code not listed on our city pages
Notable locations in zip code 51450: Fletcher (A), Ulmer (B), Farmers Cooperative Company Elevator (C), Carnarvon (D), Camp Crescent (E), Sac County Ambulance Lake View (F), Lake View Museum (G), Lake View Fire Department (H), Lake View Police Department (I), Lake View City Library (J). Display/hide their locations on the map
Churches in zip code 51450 include: United Methodist Church (A), Victory Baptist Church (B), Lutheran Church (C), United Church of Christ (D), Emmanuel Presbyterian Church (E). Display/hide their locations on the map
Parks in zip code 51450 include: Black Hawk Lake Wildlife Management Area (1), Black Hawk State Park (2), Chief Black Hawk Statue (3), Jana Recreation Area (4), Tomahawk Marsh Wildlife Management Area (5), Black Hawk Marsh State Game Management Area (6), George Washington Memorial Forest Historical Marker (7). Display/hide their locations on the map
In group quarters: 36 (-1 institutionalized population)
Size of family households: 298 2-persons, 61 3-persons, 49 4-persons, 36 6-persons
Size of nonfamily households: 202 1-person, 21 2-persons
197 married couples with children.
68 single-parent households (3 men, 65 women).
99.9% of residents of 51450 zip code speak English at home.
0.5% of residents speak Spanish at home (100% very well).
0.1% of residents speak other Indo-European language at home (100% very well).
Foreign born population: 3 (0.2%) (100.0% of them are naturalized citizens)
This zip code:
0.2%
Whole state:
6.0%
67%Germany
63%German
7%Irish
6%American
4%English
2%Dutch
2%Swedish
1%Danish
Year of entry for the foreign-born population
02010 or later
02000 to 2009
01990 to 1999
6Before 1990
Facilities with environmental interests located in this zip code:
CON AGRA SNACK FOODS - LAKEVIEW (2683 350TH ST in LAKEVIEW, IA)
AIR MINOR (AIRS/AFS) Business SIC classification: FOOD PREPARATIONS Alternative names: VOGEL POPCORN
ROHLIN CONSTRUCTION CO PLANT #10 (HALLET PIT - S OF LAKE VIEW in LAKE VIEW, IA)
AIR MINOR (AIRS/AFS) Business SIC classification: ASPHALT PAVING MIXTURES AND BLOCKS Alternative names: CLOSED FACILITY -- ROHLIN CONSTRUCTION CO PLANT #10
Housing units lacking complete plumbing facilities: 0.9% Housing units lacking complete kitchen facilities: 0.2%
41.3%Bottled, tank, or LP gas
33.9%Utility gas
23.3%Electricity
1.7%Other fuel
Population in 1990: 1,792.
Place of birth for U.S.-born residents:
This state: 1,282
Midwest: 116
South: 19
West: 26
65% of the 51450 zip code residents lived in the same house 5 years ago. Out of people who lived in different houses, 62% lived in this county. Out of people who lived in different counties, 50% lived in Iowa.
94% of the 51450 zip code residents lived in the same house 1 year ago. Out of people who lived in different houses, 43% moved from this county. Out of people who lived in different houses, 12% moved from different county within same state. Out of people who lived in different houses, 2% moved from different state. Out of people who lived in different houses, 48% moved from abroad.
Private vs. public school enrollment:
Students in private schools in grades 1 to 8 (elementary and middle school):
Here:
0.0%
Iowa:
10.6%
Students in private schools in grades 9 to 12 (high school):
Here:
0.0%
Iowa:
7.9%
Students in private undergraduate colleges:
Here:
0.0%
Iowa:
23.9%
Occupation by median earnings in the past 12 months ($)
146,243Production occupations
82,587Installation, maintenance, and repair occupations
82,445Architecture and engineering occupations
73,577Management occupations
72,267Business and financial operations occupations
64,395Health diagnosing and treating practitioners and other technical occupations
Top industries in this zip code by the number of employees in 2005:
Health Care and Social Assistance: Nursing Care Facilities (20-49: 1)
Wholesale Trade: Grain and Field Bean Merchant Wholesalers (10-19: 1, 5-9: 1)
Other Services (except Public Administration): Religious Organizations (5-9: 1, 1-4: 2)
People in group quarters in 2010:
40 people in nursing facilities/skilled-nursing facilities
People in group quarters in 2000:
36 people in nursing homes
Fatal accident statistics in 2011:
Fatal accident count: 1
Vehicles involved in fatal accidents: 2
Fatal accidents caused by drunken drivers: 0
Fatalities: 1
Persons involved in fatal accidents: 3
Pedestrians involved in fatal accidents: 0
2004 - 2018 National Fire Incident Reporting System (NFIRS) incidents
According to the data from the years 2004 - 2018 the average number of fire incidents per year is 8. The highest number of reported fires - 14 took place in 2012, and the least - 0 in 2011. The data has a decreasing trend.
When looking into fire subcategories, the most incidents belonged to: Outside Fires (42.5%), and Structure Fires (39.4%).
Fire incident types reported to NFIRS in Zip Code 51450


+$2,577
-$74
(% of AGI for various income ranges: -42.6% for AGIs below $10k, 2.5% for AGIs $10k-25k, -1.4% for AGIs $25k-50k, 2.2% for AGIs $50k-75k, 4.0% for AGIs over 100k) Nearest zip codes: 51466, 50583, 51436, 51433, 50535, 50561.
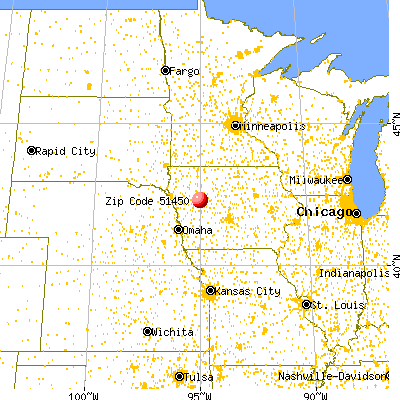


 According to the data from the years 2004 - 2018 the average number of fire incidents per year is 8. The highest number of reported fires - 14 took place in 2012, and the least - 0 in 2011. The data has a decreasing trend.
 When looking into fire subcategories, the most incidents belonged to: Outside Fires (42.5%), and Structure Fires (39.4%).