Estimated zip code population in 2022: 932 Zip code population in 2010: 1,071 Zip code population in 2000: 1,113
Houses and condos: 421 Renter-occupied apartments: 39
% of renters here:
10%
State:
28%
March 2022 cost of living index in zip code 52658: 84.8 (less than average, U.S. average is 100)
Land area: 45.5 sq. mi. Water area: 5.2 sq. mi.
Population density: 20 people per square mile
(very low).
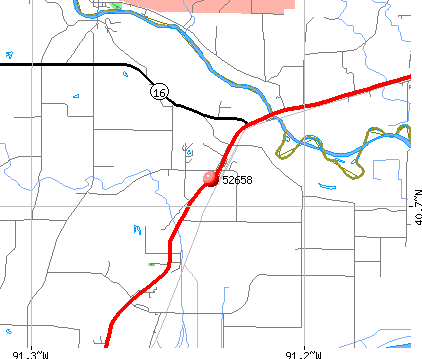
OSM Map
General Map
Google Map
MSN Map
OSM Map
General Map
Google Map
MSN Map
OSM Map
General Map
Google Map
MSN Map
OSM Map
General Map
Google Map
MSN Map
Please wait while loading the map...
Real estate property taxes paid for housing units in 2022:
This zip code:
0.9% ($1,851)
Iowa:
1.4% ($2,724)
Median real estate property taxes paid for housing units with mortgages in 2022: $1,793 (0.9%) Median real estate property taxes paid for housing units with no mortgage in 2022: $1,884 (0.9%)
Business Search- 14 Million verified businesses
Males: 448
(48.1%)
Females: 483
(51.9%)
For population 25 years and over in 52658:
High school or higher: 98.0%
Bachelor's degree or higher: 26.0%
Graduate or professional degree: 10.8%
Unemployed: 2.8%
Mean travel time to work (commute): 22.6 minutes
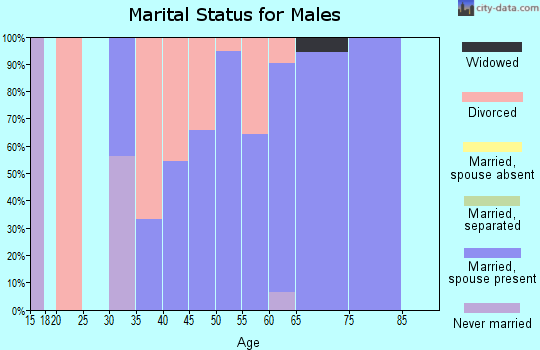
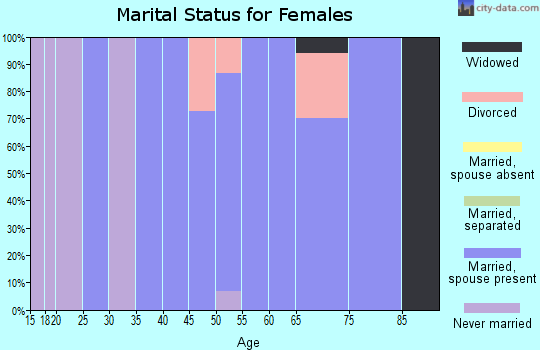
For population 15 years and over in 52658:
Never married: 12.1%
Now married: 69.4%
Separated: 2.4%
Widowed: 6.9%
Divorced: 9.2%
Zip code 52658 compared to state average:
Black race population percentage significantly below state average.
Median age significantly above state average.
Foreign-born population percentage significantly below state average.
Renting percentage significantly below state average.
Length of stay since moving in significantly above state average.
Estimated median house/condo value in 2022: $203,387
52658:
$203,387
Iowa:
$194,600
According to our research of Iowa and other state lists, there was 1 registered sex offender living in 52658 zip code as of April 27, 2024. The ratio of all residents to sex offenders in zip code 52658 is 799 to 1. The ratio of registered sex offenders to all residents in this zip code is lower than the state average.
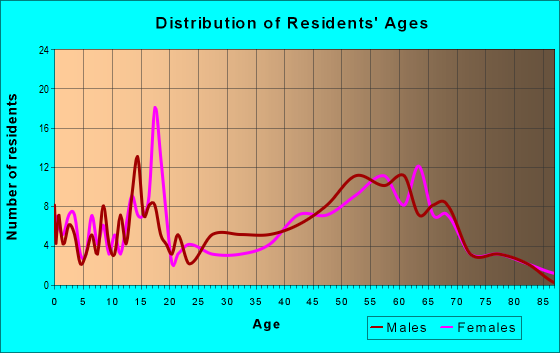
Median resident age:
This zip code:
56.3 years
Iowa median age:
38.9 years
Average household size:
This zip code:
2.3 people
Iowa:
2.3 people
Averages for the 2020 tax year for zip code 52658, filed in 2021:
Average Adjusted Gross Income (AGI) in 2020: $67,702 (Individual Income Tax Returns)
Here:
$67,702
State:
$71,087
Salary/wage: $57,472 (reported on 78.2% of returns)
Here:
$57,472
State:
$57,361
(% of AGI for various income ranges: 1120.0% for AGIs below $25k, 3225.6% for AGIs $25k-50k, 6431.7% for AGIs $50k-75k, 7945.0% for AGIs $75k-100k, 19664.3% for AGIs $100k-200k)
Taxable interest for individuals: $771 (reported on 50.9% of returns)
This zip code:
$771
Iowa:
$1,633
(% of AGI for various income ranges: 18.9% for AGIs below $25k, 62.2% for AGIs $25k-50k, 91.7% for AGIs $50k-75k, 92.5% for AGIs $75k-100k, 72.9% for AGIs $100k-200k)
Ordinary dividends: $3,600 (reported on 27.3% of returns)
Here:
$3,600
State:
$5,432
(% of AGI for various income ranges: 21.1% for AGIs below $25k, 110.0% for AGIs $25k-50k, 176.7% for AGIs $50k-75k, 177.5% for AGIs $75k-100k, 350.0% for AGIs $100k-200k)
Net capital gain/loss in AGI: +$4,183 (reported on 21.8% of returns)
Here:
+$4,183
State:
+$15,243
(% of AGI for various income ranges: 3.3% for AGIs below $25k, 44.4% for AGIs $25k-50k, 48.3% for AGIs $50k-75k, 452.5% for AGIs $75k-100k, 355.7% for AGIs $100k-200k)
Profit/loss from business: +$4,900 (reported on 14.5% of returns)
Here:
+$4,900
State:
+$11,763
(% of AGI for various income ranges: 278.9% for AGIs $25k-50k, 201.4% for AGIs $100k-200k)
Taxable individual retirement arrangement distribution: $15,200 (reported on 12.7% of returns)
52658:
$15,200
Iowa:
$17,324
(% of AGI for various income ranges: 645.6% for AGIs $25k-50k, 1207.5% for AGIs $75k-100k)
Total itemized deductions: $17,667 (reported on 5.5% of returns)
Here:
$17,667
State:
$33,775
(% of AGI for various income ranges: 883.3% for AGIs $50k-75k)
Taxes paid: $4,833 (reported on 5.5% of returns)
52658:
$4,833
State:
$7,704
(% of AGI for various income ranges: 241.7% for AGIs $50k-75k)
Earned income credit: $2,000 (reported on 7.3% of returns)
Here:
$2,000
State:
$2,195
(% of AGI for various income ranges: 88.9% for AGIs below $25k)
Percentage of individuals using paid preparers for their 2020 taxes: 94.5%
Here:
95%
State:
95%
(% for various income ranges: 86.7% for AGIs below $25k, 100.0% for AGIs $25k-50k, 90.0% for AGIs $50k-75k, 100.0% for AGIs $75k-100k, 100.0% for AGIs $100k-200k)
Averages for the 2012 tax year for zip code 52658, filed in 2013:
Average Adjusted Gross Income (AGI) in 2012: $64,581 (Individual Income Tax Returns)
Here:
$64,581
State:
$58,860
Salary/wage: $47,560 (reported on 82.7% of returns)
Here:
$47,560
State:
$46,659
(% of AGI for various income ranges: 64.6% for AGIs below $25k, 67.1% for AGIs $25k-50k, 69.4% for AGIs $50k-75k, 78.5% for AGIs $75k-100k, 50.6% for AGIs $100k-200k)
Taxable interest for individuals: $834 (reported on 55.8% of returns)
This zip code:
$834
Iowa:
$1,537
(% of AGI for various income ranges: 1.4% for AGIs below $25k, 1.4% for AGIs $25k-50k, 0.9% for AGIs $50k-75k, 0.3% for AGIs $75k-100k, 0.5% for AGIs $100k-200k)
Ordinary dividends: $1,992 (reported on 23.1% of returns)
Here:
$1,992
State:
$4,542
(% of AGI for various income ranges: 2.1% for AGIs below $25k, 1.7% for AGIs $25k-50k, 1.4% for AGIs $50k-75k, 0.3% for AGIs $100k-200k)
Net capital gain/loss in AGI: +$14,580 (reported on 19.2% of returns)
Here:
+$14,580
State:
+$11,802
(% of AGI for various income ranges: 0.8% for AGIs $25k-50k, 0.7% for AGIs $50k-75k, 8.4% for AGIs $100k-200k)
Profit/loss from business: +$8,388 (reported on 15.4% of returns)
Here:
+$8,388
State:
+$10,509
(% of AGI for various income ranges: 6.6% for AGIs below $25k, 0.9% for AGIs $25k-50k, 9.6% for AGIs $75k-100k)
Taxable individual retirement arrangement distribution: $8,529 (reported on 13.5% of returns)
52658:
$8,529
Iowa:
$11,773
Total itemized deductions: $19,906 (17% of AGI, reported on 30.8% of returns)
Here:
$19,906
State:
$21,278
Here:
16.9% of AGI
State:
18.9% of AGI
(% of AGI for various income ranges: 15.2% for AGIs $25k-50k, 7.3% for AGIs $50k-75k, 11.5% for AGIs $75k-100k, 9.2% for AGIs $100k-200k)
Charity contributions: $3,418 (reported on 21.2% of returns)
Here:
$3,418
State:
$4,044
(% of AGI for various income ranges: 3.5% for AGIs $25k-50k, 1.7% for AGIs $75k-100k, 0.8% for AGIs $100k-200k)
Taxes paid: $7,700 (reported on 30.8% of returns)
52658:
$7,700
State:
$8,846
(% of AGI for various income ranges: 2.5% for AGIs $25k-50k, 1.9% for AGIs $50k-75k, 3.9% for AGIs $75k-100k, 4.9% for AGIs $100k-200k)
Earned income credit: $1,860 (reported on 9.6% of returns)
Here:
$1,860
State:
$2,098
(% of AGI for various income ranges: 4.5% for AGIs below $25k)
Percentage of individuals using paid preparers for their 2012 taxes: 78.8%
Here:
79%
State:
65%
(% for various income ranges: 70.6% for AGIs below $25k, 83.3% for AGIs $25k-50k, 77.8% for AGIs $50k-75k, 83.3% for AGIs $75k-100k, 87.5% for AGIs $100k-200k)
Averages for the 2004 tax year for zip code 52658, filed in 2005:
Average Adjusted Gross Income (AGI) in 2004: $46,270 (Individual Income Tax Returns)
Here:
$46,270
State:
$43,875
Salary/wage: $40,116 (reported on 82.4% of returns)
Here:
$40,116
State:
$38,265
(% of AGI for various income ranges: 94.7% for AGIs below $10k, 64.3% for AGIs $10k-25k, 73.7% for AGIs $25k-50k, 76.7% for AGIs $50k-75k, 75.5% for AGIs $75k-100k, 63.9% for AGIs over 100k)
Taxable interest for individuals: $1,373 (reported on 59.9% of returns)
This zip code:
$1,373
Iowa:
$1,768
(% of AGI for various income ranges: 7.8% for AGIs below $10k, 5.4% for AGIs $10k-25k, 3.0% for AGIs $25k-50k, 1.2% for AGIs $50k-75k, 0.3% for AGIs $75k-100k, 0.9% for AGIs over 100k)
Taxable dividends: $1,907 (reported on 31.5% of returns)
Here:
$1,907
State:
$2,510
(% of AGI for various income ranges: 1.4% for AGIs below $10k, 2.0% for AGIs $10k-25k, 1.9% for AGIs $25k-50k, 0.6% for AGIs $50k-75k, 1.2% for AGIs $75k-100k, 1.2% for AGIs over 100k)
Net capital gain/loss: +$2,875 (reported on 21.9% of returns)
Here:
+$2,875
State:
+$6,139
(% of AGI for various income ranges: 0.7% for AGIs $10k-25k, -0.6% for AGIs $25k-50k, 0.6% for AGIs $50k-75k, -0.2% for AGIs $75k-100k, 4.5% for AGIs over 100k)
Profit/loss from business: +$3,345 (reported on 17.0% of returns)
Here:
+$3,345
State:
+$8,574
(% of AGI for various income ranges: -7.1% for AGIs below $10k, 5.8% for AGIs $10k-25k, 2.9% for AGIs $25k-50k, 2.9% for AGIs $50k-75k, -1.4% for AGIs over 100k)
Total itemized deductions: $18,306 (22% of AGI, reported on 28.2% of returns)
Here:
$18,306
State:
$16,976
Here:
21.7% of AGI
State:
20.8% of AGI
(% of AGI for various income ranges: 11.5% for AGIs $10k-25k, 12.2% for AGIs $25k-50k, 7.6% for AGIs $50k-75k, 15.8% for AGIs $75k-100k, 11.3% for AGIs over 100k)
Charity contributions deductions: $2,844 (3% of AGI, reported on 23.9% of returns)
Here:
$2,844
State:
$3,089
Here:
3.1% of AGI
State:
3.6% of AGI
(% of AGI for various income ranges: 1.7% for AGIs $25k-50k, 0.8% for AGIs $50k-75k, 2.1% for AGIs $75k-100k, 1.9% for AGIs over 100k)
Total tax: $6,635 (reported on 79.8% of returns)
52658:
$6,635
State:
$6,177
(% of AGI for various income ranges: 3.2% for AGIs below $10k, 4.5% for AGIs $10k-25k, 6.5% for AGIs $25k-50k, 9.4% for AGIs $50k-75k, 10.1% for AGIs $75k-100k, 19.9% for AGIs over 100k)
Earned income credit: $1,328 (reported on 11.4% of returns)
Here:
$1,328
State:
$1,540
Percentage of individuals using paid preparers for their 2004 taxes: 82.6%
Here:
83%
State:
70%
(% for various income ranges: 69.4% for AGIs below $10k, 80.6% for AGIs $10k-25k, 89.8% for AGIs $25k-50k, 86.8% for AGIs $50k-75k, 82.2% for AGIs $75k-100k, 86.5% for AGIs over 100k)
Household received Food Stamps/SNAP in the past 12 months: 27 Household did not receive Food Stamps/SNAP in the past 12 months: 385
Women who had a birth in the past 12 months: 7 (7 now married, 0 unmarried) Women who did not have a birth in the past 12 months: 128 (57 now married, 71 unmarried)
Housing units in zip code 52658 with a mortgage: 142 (5 second mortgage, 5 both second mortgage and home equity loan) Median monthly owner costs for units with a mortgage: $1,264 Median monthly owner costs for units without a mortgage: $544
Residents with income below the poverty level in 2022:
This zip code:
8.1%
Whole state:
11.0%
Residents with income below 50% of the poverty level in 2022:
This zip code:
0.9%
Whole state:
5.5%
Median number of rooms in houses and condos:
Here:
6.6
State:
6.8
Median number of rooms in apartments:
Here:
6.8
State:
4.2
Notable locations in this zip code not listed on our city pages
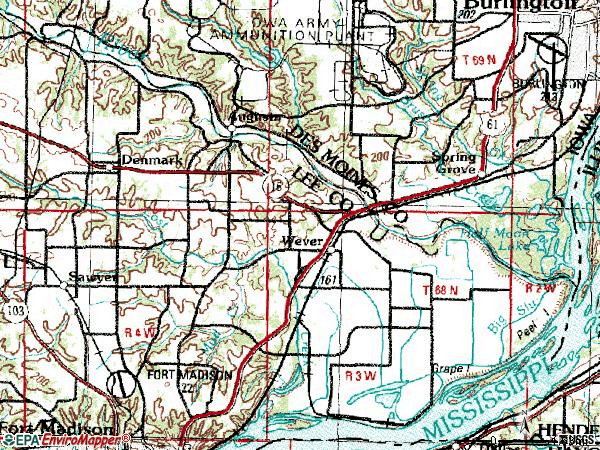
Notable locations in zip code 52658: Mount Ayr Wastewater Treatment Plant (A), Green Bay Access (B), Skunk River Access (C), Augusta Access (D), Wever (E), Wever Fire and Rescue Department (F). Display/hide their locations on the map
Streams, rivers, and creeks: Big Slough (A), Skunk River (B), Grape Chute (C), Deeds Creek (D), Lead Island Chute (E), Mud Creek (F). Display/hide their locations on the map
Size of family households: 223 2-persons, 20 3-persons, 22 4-persons, 22 5-persons, 22 6-persons
Size of nonfamily households: 97 1-person, 5 2-persons
149 married couples with children.
42 single-parent households (21 men, 21 women).
100.7% of residents of 52658 zip code speak English at home.
Foreign born population: 0 (0.0%)
:
0.0%
Whole state:
6.0%
34%German
23%American
7%Irish
3%English
3%Czech
2%Italian
2%Norwegian
Facilities with environmental interests located in this zip code:
BEACH'S LIMESTONE (3316 OLD QUARRY ROAD in WEVER, IA)
National Pollutant Discharge Elimination System NON-MAJOR (Tracking pollutant discharge elimination systems) - permit Business SIC classification: CRUSHED AND BROKEN LIMESTONE
COLUSA ELEVATOR (2136 GREEN BAY ROAD in WEVER, IA)
AIR MINOR (AIRS/AFS) Business SIC classification: NONCLASSIFIABLE ESTABLISHMENTS Alternative names: GREEN BAY ELEV CO.
Housing units lacking complete kitchen facilities: 5.2%
35.5%Utility gas
35.2%Bottled, tank, or LP gas
28.7%Electricity
1.0%Wood
Population in 1990: 546. Population change in the 1990s: +567 (+103.8%).
Place of birth for U.S.-born residents:
This state: 696
Northeast: 21
Midwest: 167
South: 21
West: 22
78% of the 52658 zip code residents lived in the same house 5 years ago. Out of people who lived in different houses, 60% lived in this county. Out of people who lived in different counties, 50% lived in Iowa.
92% of the 52658 zip code residents lived in the same house 1 year ago. Out of people who lived in different houses, 44% moved from this county. Out of people who lived in different houses, 56% moved from different state.
Private vs. public school enrollment:
Students in private schools in grades 1 to 8 (elementary and middle school): 20
Here:
21.7%
Iowa:
10.6%
Students in private schools in grades 9 to 12 (high school): 14
Here:
35.5%
Iowa:
7.9%
Students in private undergraduate colleges:
Here:
0.0%
Iowa:
23.9%
Occupation by median earnings in the past 12 months ($)
100,555Installation, maintenance, and repair occupations
77,072Management occupations
75,882Education, training, and library occupations
74,696Architecture and engineering occupations
56,802Health diagnosing and treating practitioners and other technical occupations
49,793Building and grounds cleaning and maintenance occupations
Companies with federal contracts located in this zip code:
DENMARK CLEANING SERVICE (503 TURNER AVENUE in WEVER, IA; small business) : $10,701 in 3 contractsfrom 2002 to 2003
$10,301 with Army for Custodial Janitorial Services. Signed on 2003-01-07. Completion date: 2003-01-31.
$400, same as above.Signed on 2002-11-17. Completion date: 2003-01-31.
$0, same as above.Signed on 2003-01-07. Completion date: 2003-01-31.
Top industries in this zip code by the number of employees in 2005:
Finance and Insurance: Commercial Banking (10-19 employees: 1 establishment)
Accommodation and Food Services: Full-Service Restaurants (10-19: 1)
Wholesale Trade: Grain and Field Bean Merchant Wholesalers (5-9: 1)
Construction: New Single-Family Housing Construction (except Operative Builders) (1-4: 2)
Fatal accident statistics in 2012:
Fatal accident count: 2
Vehicles involved in fatal accidents: 4
Fatal accidents caused by drunken drivers: 0
Fatalities: 2
Persons involved in fatal accidents: 4
Pedestrians involved in fatal accidents: 0
Fatal accident statistics in 2011:
Fatal accident count: 1
Vehicles involved in fatal accidents: 1
Fatal accidents caused by drunken drivers: 1
Fatalities: 1
Persons involved in fatal accidents: 2
Pedestrians involved in fatal accidents: 0
2002 - 2018 National Fire Incident Reporting System (NFIRS) incidents
According to the data from the years 2002 - 2018 the average number of fires per year is 7. The highest number of fire incidents - 19 took place in 2016, and the least - 3 in 2003. The data has a decreasing trend.
When looking into fire subcategories, the most reports belonged to: Outside Fires (48.0%), and Structure Fires (29.6%).
Fire incident types reported to NFIRS in Zip Code 52658


 Nearest zip codes: 52638, 52624, 62358, 52627, 52655, 62330.


 According to the data from the years 2002 - 2018 the average number of fires per year is 7. The highest number of fire incidents - 19 took place in 2016, and the least - 3 in 2003. The data has a decreasing trend.
 When looking into fire subcategories, the most reports belonged to: Outside Fires (48.0%), and Structure Fires (29.6%).