Estimated zip code population in 2022: 1,086 Zip code population in 2010: 1,115 Zip code population in 2000: 1,101
Houses and condos: 451 Renter-occupied apartments: 29
% of renters here:
7%
State:
32%
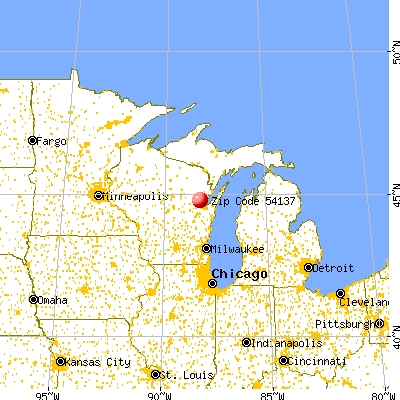
March 2022 cost of living index in zip code 54137: 85.7 (less than average, U.S. average is 100)
Land area: 26.2 sq. mi. Water area: 0.0 sq. mi.
Population density: 42 people per square mile
(very low).
OSM Map
General Map
Google Map
MSN Map
OSM Map
General Map
Google Map
MSN Map
OSM Map
General Map
Google Map
MSN Map
OSM Map
General Map
Google Map
MSN Map
Please wait while loading the map...
Real estate property taxes paid for housing units in 2022:
This zip code:
1.0% ($2,498)
Wisconsin:
1.4% ($3,497)
Median real estate property taxes paid for housing units with mortgages in 2022: $2,672 (1.0%) Median real estate property taxes paid for housing units with no mortgage in 2022: $2,386 (1.3%)
Business Search- 14 Million verified businesses
Males: 576
(53.1%)
Females: 510
(46.9%)
For population 25 years and over in 54137:
High school or higher: 94.0%
Bachelor's degree or higher: 9.4%
Graduate or professional degree: 2.8%
Unemployed: 0.9%
Mean travel time to work (commute): 26.8 minutes
For population 15 years and over in 54137:
Never married: 22.2%
Now married: 63.7%
Separated: 0.0%
Widowed: 7.0%
Divorced: 7.1%
Zip code 54137 compared to state average:
Unemployed percentage significantly below state average.
Black race population percentage significantly below state average.
Hispanic race population percentage significantly below state average.
Foreign-born population percentage significantly below state average.
Renting percentage significantly below state average.
Length of stay since moving in significantly above state average.
Percentage of population with a bachelor's degree or higher significantly below state average.
Estimated median house/condo value in 2022: $244,716
54137:
$244,716
Wisconsin:
$252,800
According to our research of Wisconsin and other state lists, there were 3 registered sex offenders living in 54137 zip code as of May 23, 2024. The ratio of all residents to sex offenders in zip code 54137 is 361 to 1. The ratio of registered sex offenders to all residents in this zip code is near the state average.
Median resident age:
This zip code:
40.8 years
Wisconsin median age:
40.4 years
Average household size:
This zip code:
2.4 people
Wisconsin:
2.3 people
Averages for the 2020 tax year for zip code 54137, filed in 2021:
Average Adjusted Gross Income (AGI) in 2020: $63,262 (Individual Income Tax Returns)
Here:
$63,262
State:
$72,319
Salary/wage: $55,563 (reported on 84.5% of returns)
Here:
$55,563
State:
$59,242
(% of AGI for various income ranges: 1323.3% for AGIs below $25k, 3720.0% for AGIs $25k-50k, 6732.9% for AGIs $50k-75k, 10662.0% for AGIs $75k-100k, 20451.7% for AGIs $100k-200k)
Taxable interest for individuals: $724 (reported on 43.1% of returns)
This zip code:
$724
Wisconsin:
$1,431
(% of AGI for various income ranges: 38.9% for AGIs below $25k, 31.0% for AGIs $25k-50k, 61.4% for AGIs $50k-75k, 62.0% for AGIs $75k-100k, 68.3% for AGIs $100k-200k)
Ordinary dividends: $1,685 (reported on 22.4% of returns)
Here:
$1,685
State:
$6,481
(% of AGI for various income ranges: 18.9% for AGIs below $25k, 71.0% for AGIs $25k-50k, 35.7% for AGIs $50k-75k, 60.0% for AGIs $75k-100k, 126.7% for AGIs $100k-200k)
Net capital gain/loss in AGI: +$6,609 (reported on 19.0% of returns)
Here:
+$6,609
State:
+$18,329
(% of AGI for various income ranges: 104.0% for AGIs $25k-50k, 277.1% for AGIs $50k-75k, 715.0% for AGIs $100k-200k)
Profit/loss from business: +$13,717 (reported on 10.3% of returns)
Here:
+$13,717
State:
+$14,562
(% of AGI for various income ranges: 152.0% for AGIs $25k-50k, 1342.0% for AGIs $75k-100k)
Taxable individual retirement arrangement distribution: $14,756 (reported on 15.5% of returns)
54137:
$14,756
Wisconsin:
$19,348
(% of AGI for various income ranges: 171.1% for AGIs below $25k, 654.0% for AGIs $25k-50k, 1040.0% for AGIs $75k-100k)
Total itemized deductions: $21,133 (reported on 5.2% of returns)
Here:
$21,133
State:
$33,000
(% of AGI for various income ranges: 905.7% for AGIs $50k-75k)
Taxes paid: $6,400 (reported on 5.2% of returns)
54137:
$6,400
State:
$8,228
(% of AGI for various income ranges: 274.3% for AGIs $50k-75k)
Earned income credit: $1,520 (reported on 8.6% of returns)
Here:
$1,520
State:
$2,155
(% of AGI for various income ranges: 84.4% for AGIs below $25k)
Percentage of individuals using paid preparers for their 2020 taxes: 96.6%
Here:
97%
State:
94%
(% for various income ranges: 86.7% for AGIs below $25k, 100.0% for AGIs $25k-50k, 100.0% for AGIs $50k-75k, 100.0% for AGIs $75k-100k, 100.0% for AGIs $100k-200k)
Averages for the 2012 tax year for zip code 54137, filed in 2013:
Average Adjusted Gross Income (AGI) in 2012: $47,151 (Individual Income Tax Returns)
Here:
$47,151
State:
$57,939
Salary/wage: $41,833 (reported on 83.6% of returns)
Here:
$41,833
State:
$48,248
(% of AGI for various income ranges: 70.7% for AGIs below $25k, 77.8% for AGIs $25k-50k, 78.7% for AGIs $50k-75k, 82.2% for AGIs $75k-100k, 61.6% for AGIs $100k-200k)
Taxable interest for individuals: $1,061 (reported on 41.8% of returns)
This zip code:
$1,061
Wisconsin:
$1,224
(% of AGI for various income ranges: 2.1% for AGIs below $25k, 1.9% for AGIs $25k-50k, 0.8% for AGIs $50k-75k, 0.3% for AGIs $75k-100k, 0.6% for AGIs $100k-200k)
Ordinary dividends: $1,446 (reported on 23.6% of returns)
Here:
$1,446
State:
$5,137
(% of AGI for various income ranges: 1.4% for AGIs below $25k, 1.2% for AGIs $25k-50k, 0.8% for AGIs $50k-75k, 0.8% for AGIs $75k-100k)
Net capital gain/loss in AGI: +$3,200 (reported on 16.4% of returns)
Here:
+$3,200
State:
+$11,137
(% of AGI for various income ranges: 2.0% for AGIs $25k-50k, 1.9% for AGIs $50k-75k, 3.0% for AGIs $75k-100k)
Profit/loss from business: +$6,271 (reported on 12.7% of returns)
Here:
+$6,271
State:
+$11,943
Taxable individual retirement arrangement distribution: $10,978 (reported on 16.4% of returns)
54137:
$10,978
Wisconsin:
$14,087
(% of AGI for various income ranges: 6.7% for AGIs below $25k, 5.6% for AGIs $25k-50k, 9.2% for AGIs $50k-75k)
Total itemized deductions: $16,890 (22% of AGI, reported on 36.4% of returns)
Here:
$16,890
State:
$22,257
Here:
22.3% of AGI
State:
20.1% of AGI
(% of AGI for various income ranges: 14.7% for AGIs $25k-50k, 13.0% for AGIs $50k-75k, 15.0% for AGIs $75k-100k, 14.2% for AGIs $100k-200k)
Charity contributions: $1,993 (reported on 25.5% of returns)
Here:
$1,993
State:
$3,370
(% of AGI for various income ranges: 0.6% for AGIs $25k-50k, 1.0% for AGIs $50k-75k, 0.9% for AGIs $75k-100k, 2.0% for AGIs $100k-200k)
Taxes paid: $7,345 (reported on 36.4% of returns)
54137:
$7,345
State:
$10,731
(% of AGI for various income ranges: 4.2% for AGIs $25k-50k, 5.7% for AGIs $50k-75k, 6.8% for AGIs $75k-100k, 7.6% for AGIs $100k-200k)
Earned income credit: $2,317 (reported on 10.9% of returns)
Here:
$2,317
State:
$2,094
(% of AGI for various income ranges: 6.4% for AGIs below $25k)
Percentage of individuals using paid preparers for their 2012 taxes: 61.8%
Here:
62%
State:
54%
(% for various income ranges: 52.6% for AGIs below $25k, 66.7% for AGIs $25k-50k, 70.0% for AGIs $50k-75k, 57.1% for AGIs $75k-100k, 75.0% for AGIs $100k-200k)
Averages for the 2004 tax year for zip code 54137, filed in 2005:
Average Adjusted Gross Income (AGI) in 2004: $40,080 (Individual Income Tax Returns)
Here:
$40,080
State:
$47,735
Salary/wage: $38,019 (reported on 84.9% of returns)
Here:
$38,019
State:
$41,540
(% of AGI for various income ranges: 109.7% for AGIs below $10k, 77.6% for AGIs $10k-25k, 82.8% for AGIs $25k-50k, 82.1% for AGIs $50k-75k, 88.3% for AGIs $75k-100k, 62.8% for AGIs over 100k)
Taxable interest for individuals: $1,326 (reported on 51.5% of returns)
This zip code:
$1,326
Wisconsin:
$1,420
(% of AGI for various income ranges: 13.5% for AGIs below $10k, 3.0% for AGIs $10k-25k, 2.5% for AGIs $25k-50k, 1.2% for AGIs $50k-75k, 0.3% for AGIs $75k-100k, 1.4% for AGIs over 100k)
Taxable dividends: $937 (reported on 28.8% of returns)
Here:
$937
State:
$2,869
(% of AGI for various income ranges: 2.6% for AGIs below $10k, 1.1% for AGIs $10k-25k, 0.9% for AGIs $25k-50k, 0.4% for AGIs $50k-75k, 0.5% for AGIs $75k-100k, 0.7% for AGIs over 100k)
Net capital gain/loss: +$4,395 (reported on 23.5% of returns)
Here:
+$4,395
State:
+$9,569
(% of AGI for various income ranges: 7.7% for AGIs below $10k, 3.0% for AGIs $10k-25k, 3.0% for AGIs $25k-50k, 1.8% for AGIs $50k-75k, 0.0% for AGIs $75k-100k, 6.0% for AGIs over 100k)
Profit/loss from business: +$2,887 (reported on 9.7% of returns)
Here:
+$2,887
State:
+$10,417
Profit/loss from farming: +$474 (reported on 10.4% of returns)
Here:
+$474
State:
-$2,654
(% of AGI for various income ranges: -12.3% for AGIs below $10k, 1.2% for AGIs $10k-25k, 1.3% for AGIs $25k-50k, -0.5% for AGIs $50k-75k)
IRA payment deduction: $2,364 (reported on 2.0% of returns)
54137:
$2,364
Wisconsin:
$2,900
Total itemized deductions: $15,545 (24% of AGI, reported on 36.9% of returns)
Here:
$15,545
State:
$18,160
Here:
24.0% of AGI
State:
21.1% of AGI
(% of AGI for various income ranges: 8.6% for AGIs $10k-25k, 11.7% for AGIs $25k-50k, 14.3% for AGIs $50k-75k, 18.8% for AGIs $75k-100k, 17.0% for AGIs over 100k)
Charity contributions deductions: $1,196 (2% of AGI, reported on 33.6% of returns)
Here:
$1,196
State:
$2,711
Here:
1.8% of AGI
State:
3.0% of AGI
(% of AGI for various income ranges: 2.9% for AGIs below $10k, 0.8% for AGIs $25k-50k, 1.0% for AGIs $50k-75k, 1.5% for AGIs $75k-100k, 0.9% for AGIs over 100k)
Total tax: $4,372 (reported on 77.6% of returns)
54137:
$4,372
State:
$7,114
(% of AGI for various income ranges: 3.9% for AGIs below $10k, 4.9% for AGIs $10k-25k, 6.9% for AGIs $25k-50k, 7.6% for AGIs $50k-75k, 9.5% for AGIs $75k-100k, 13.6% for AGIs over 100k)
Earned income credit: $1,220 (reported on 7.5% of returns)
Here:
$1,220
State:
$1,544
Percentage of individuals using paid preparers for their 2004 taxes: 66.4%
Here:
66%
State:
57%
(% for various income ranges: 65.4% for AGIs below $10k, 61.6% for AGIs $10k-25k, 63.5% for AGIs $25k-50k, 69.6% for AGIs $50k-75k, 74.1% for AGIs $75k-100k, 80.0% for AGIs over 100k)
Household received Food Stamps/SNAP in the past 12 months: 5 Household did not receive Food Stamps/SNAP in the past 12 months: 436
Women who had a birth in the past 12 months: 4 (4 now married, 0 unmarried) Women who did not have a birth in the past 12 months: 231 (150 now married, 80 unmarried)
Housing units in zip code 54137 with a mortgage: 275 (24 second mortgage, 25 both second mortgage and home equity loan) Median monthly owner costs for units with a mortgage: $1,370 Median monthly owner costs for units without a mortgage: $491
Residents with income below the poverty level in 2022:
This zip code:
5.0%
Whole state:
10.7%
Residents with income below 50% of the poverty level in 2022:
This zip code:
1.6%
Whole state:
5.7%
Median number of rooms in houses and condos:
Here:
6.6
State:
6.5
Median number of rooms in apartments:
Here:
6.7
State:
4.1
Notable locations in this zip code not listed on our city pages
Size of family households: 161 2-persons, 35 3-persons, 68 4-persons, 12 5-persons, 23 6-persons
Size of nonfamily households: 119 1-person, 18 2-persons, 4 3-persons
207 married couples with children.
13 single-parent households (3 men, 10 women).
92.3% of residents of 54137 zip code speak English at home.
6.2% of residents speak Spanish at home (95% very well, 5% not well).
0.6% of residents speak other Indo-European language at home (100% very well).
0.3% of residents speak Asian or Pacific Island language at home (100% very well).
Foreign born population: 11 (1.1%) (75.1% of them are naturalized citizens)
This zip code:
1.1%
Whole state:
5.0%
27%Japan
27%Malaysia
32%German
26%Polish
18%Dutch
13%American
4%Swedish
3%Irish
0%Belgian
Year of entry for the foreign-born population
122010 or later
52000 to 2009
01990 to 1999
5Before 1990
45.5%Utility gas
37.6%Bottled, tank, or LP gas
6.9%Electricity
5.3%Wood
4.4%Fuel oil, kerosene, etc.
0.9%Other fuel
Population in 1990: 883. Population change in the 1990s: +218 (+24.7%).
Place of birth for U.S.-born residents:
This state: 970
Midwest: 75
South: 3
West: 9
65% of the 54137 zip code residents lived in the same house 5 years ago. Out of people who lived in different houses, 21% lived in this county. Out of people who lived in different counties, 50% lived in Wisconsin.
94% of the 54137 zip code residents lived in the same house 1 year ago. Out of people who lived in different houses, 71% moved from different county within same state. Out of people who lived in different houses, 31% moved from different state. Out of people who lived in different houses, 6% moved from abroad.
Private vs. public school enrollment:
Students in private schools in grades 1 to 8 (elementary and middle school): 9
Here:
9.5%
Wisconsin:
16.7%
Students in private schools in grades 9 to 12 (high school): 1
Here:
3.2%
Wisconsin:
12.5%
Students in private undergraduate colleges:
Here:
0.0%
Wisconsin:
17.5%
Occupation by median earnings in the past 12 months ($)
88,966Installation, maintenance, and repair occupations
88,414Business and financial operations occupations
82,217Management occupations
74,968Architecture and engineering occupations
65,767Sales and related occupations
60,447Material moving occupations
Top industries in this zip code by the number of employees in 2005:
Accommodation and Food Services: Full-Service Restaurants (5-9 employees: 1 establishment)
Construction: Residential Remodelers (1-4: 1)
Real Estate and Rental and Leasing: Offices of Real Estate Agents and Brokers (1-4: 1)
Accommodation and Food Services: Drinking Places (Alcoholic Beverages) (1-4: 1)
Construction: New Single-Family Housing Construction (except Operative Builders) (1-4: 1)
Construction: Siding Contractors (1-4: 1)
People in group quarters in 2010:
14 people in correctional residential facilities
Fatal accident statistics in 2012:
Fatal accident count: 1
Vehicles involved in fatal accidents: 1
Fatal accidents caused by drunken drivers: 0
Fatalities: 1
Persons involved in fatal accidents: 1
Pedestrians involved in fatal accidents: 0
Home Mortgage Disclosure Act Aggregated Statistics For Year 2009 (Based on 2 partial tracts)
A) FHA, FSA/RHS & VA Home Purchase Loans
B) Conventional Home Purchase Loans
C) Refinancings
D) Home Improvement Loans
F) Non-occupant Loans on < 5 Family Dwellings (A B C & D)
G) Loans On Manufactured Home Dwelling (A B C & D)
Number
Average Value
Number
Average Value
Number
Average Value
Number
Average Value
Number
Average Value
Number
Average Value
LOANS ORIGINATED
5
$166,610
8
$130,505
116
$157,881
3
$85,630
2
$160,525
3
$95,877
APPLICATIONS APPROVED, NOT ACCEPTED
0
$0
0
$0
12
$176,625
0
$0
0
$0
0
$0
APPLICATIONS DENIED
1
$138,580
1
$42,780
25
$175,112
2
$23,285
0
$0
2
$87,115
APPLICATIONS WITHDRAWN
0
$0
1
$201,190
16
$167,211
0
$0
0
$0
0
$0
FILES CLOSED FOR INCOMPLETENESS
0
$0
0
$0
3
$181,880
0
$0
0
$0
0
$0
Aggregated Statistics For Year 2008 (Based on 2 partial tracts)
A) FHA, FSA/RHS & VA Home Purchase Loans
B) Conventional Home Purchase Loans
C) Refinancings
D) Home Improvement Loans
F) Non-occupant Loans on < 5 Family Dwellings (A B C & D)
G) Loans On Manufactured Home Dwelling (A B C & D)
Number
Average Value
Number
Average Value
Number
Average Value
Number
Average Value
Number
Average Value
Number
Average Value
LOANS ORIGINATED
3
$193,020
13
$161,256
72
$161,273
7
$45,770
2
$201,190
2
$135,795
APPLICATIONS APPROVED, NOT ACCEPTED
1
$135,910
1
$216,340
10
$155,358
1
$59,490
0
$0
0
$0
APPLICATIONS DENIED
0
$0
1
$93,130
26
$181,788
2
$63,275
1
$104,270
2
$86,000
APPLICATIONS WITHDRAWN
0
$0
1
$133,900
13
$171,145
0
$0
1
$100,710
1
$96,030
FILES CLOSED FOR INCOMPLETENESS
0
$0
1
$102,490
3
$198,293
0
$0
0
$0
0
$0
Aggregated Statistics For Year 2007 (Based on 2 partial tracts)
A) FHA, FSA/RHS & VA Home Purchase Loans
B) Conventional Home Purchase Loans
C) Refinancings
D) Home Improvement Loans
F) Non-occupant Loans on < 5 Family Dwellings (A B C & D)
G) Loans On Manufactured Home Dwelling (A B C & D)
Number
Average Value
Number
Average Value
Number
Average Value
Number
Average Value
Number
Average Value
Number
Average Value
LOANS ORIGINATED
2
$130,450
21
$133,754
78
$137,947
10
$51,667
2
$166,655
5
$96,828
APPLICATIONS APPROVED, NOT ACCEPTED
0
$0
2
$139,805
11
$138,643
2
$65,835
1
$57,930
1
$66,170
APPLICATIONS DENIED
0
$0
3
$127,367
34
$146,471
5
$77,802
2
$111,510
2
$99,145
APPLICATIONS WITHDRAWN
0
$0
2
$101,710
13
$158,239
1
$59,710
0
$0
1
$53,030
FILES CLOSED FOR INCOMPLETENESS
0
$0
0
$0
3
$193,613
0
$0
0
$0
0
$0
Aggregated Statistics For Year 2006 (Based on 2 partial tracts)
A) FHA, FSA/RHS & VA Home Purchase Loans
B) Conventional Home Purchase Loans
C) Refinancings
D) Home Improvement Loans
F) Non-occupant Loans on < 5 Family Dwellings (A B C & D)
G) Loans On Manufactured Home Dwelling (A B C & D)
Number
Average Value
Number
Average Value
Number
Average Value
Number
Average Value
Number
Average Value
Number
Average Value
LOANS ORIGINATED
2
$127,105
36
$133,439
79
$131,232
11
$47,051
5
$138,404
5
$76,776
APPLICATIONS APPROVED, NOT ACCEPTED
1
$101,600
3
$153,733
13
$135,651
2
$35,200
1
$80,650
1
$64,610
APPLICATIONS DENIED
1
$81,540
7
$79,699
34
$139,473
5
$48,036
0
$0
4
$87,450
APPLICATIONS WITHDRAWN
0
$0
4
$105,272
19
$133,094
1
$95,360
0
$0
0
$0
FILES CLOSED FOR INCOMPLETENESS
0
$0
1
$188,270
6
$123,320
0
$0
0
$0
0
$0
Aggregated Statistics For Year 2005 (Based on 2 partial tracts)
A) FHA, FSA/RHS & VA Home Purchase Loans
B) Conventional Home Purchase Loans
C) Refinancings
D) Home Improvement Loans
F) Non-occupant Loans on < 5 Family Dwellings (A B C & D)
G) Loans On Manufactured Home Dwelling (A B C & D)
Number
Average Value
Number
Average Value
Number
Average Value
Number
Average Value
Number
Average Value
Number
Average Value
LOANS ORIGINATED
2
$102,935
40
$148,908
93
$139,389
11
$41,603
5
$155,426
5
$70,850
APPLICATIONS APPROVED, NOT ACCEPTED
0
$0
2
$150,725
10
$136,398
1
$14,040
0
$0
0
$0
APPLICATIONS DENIED
1
$81,770
9
$139,869
41
$157,476
3
$45,527
2
$317,935
7
$78,361
APPLICATIONS WITHDRAWN
0
$0
5
$126,194
16
$130,951
1
$83,770
0
$0
0
$0
FILES CLOSED FOR INCOMPLETENESS
0
$0
1
$208,320
10
$164,248
1
$37,880
0
$0
1
$89,790
Aggregated Statistics For Year 2004 (Based on 2 partial tracts)
A) FHA, FSA/RHS & VA Home Purchase Loans
B) Conventional Home Purchase Loans
C) Refinancings
D) Home Improvement Loans
F) Non-occupant Loans on < 5 Family Dwellings (A B C & D)
G) Loans On Manufactured Home Dwelling (A B C & D)


+$474
-$2,654
(% of AGI for various income ranges: -12.3% for AGIs below $10k, 1.2% for AGIs $10k-25k, 1.3% for AGIs $25k-50k, -0.5% for AGIs $50k-75k)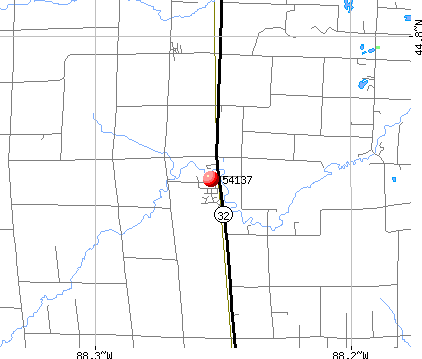 Nearest zip codes: 54127, 54162, 54111, 54154, 54171, 54124.


