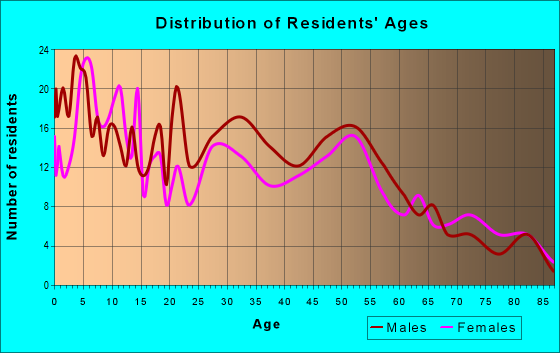
Estimated zip code population in 2022: 1,976 Zip code population in 2010: 2,036 Zip code population in 2000: 1,955
Houses and condos: 780 Renter-occupied apartments: 189
% of renters here:
26%
State:
32%
March 2022 cost of living index in zip code 54425: 86.3 (less than average, U.S. average is 100)
Land area: 44.1 sq. mi. Water area: 0.1 sq. mi.
Population density: 45 people per square mile
(very low).
OSM Map
General Map
Google Map
MSN Map
OSM Map
General Map
Google Map
MSN Map
OSM Map
General Map
Google Map
MSN Map
OSM Map
General Map
Google Map
MSN Map
Please wait while loading the map...
Real estate property taxes paid for housing units in 2022:
This zip code:
1.4% ($2,385)
Wisconsin:
1.4% ($3,497)
Median real estate property taxes paid for housing units with mortgages in 2022: $2,641 (1.4%) Median real estate property taxes paid for housing units with no mortgage in 2022: $2,163 (1.6%)
Business Search- 14 Million verified businesses
Males: 1,037
(52.5%)
Females: 939
(47.5%)
For population 25 years and over in 54425:
High school or higher: 83.9%
Bachelor's degree or higher: 11.3%
Graduate or professional degree: 3.0%
Unemployed: 1.7%
Mean travel time to work (commute): 21.4 minutes
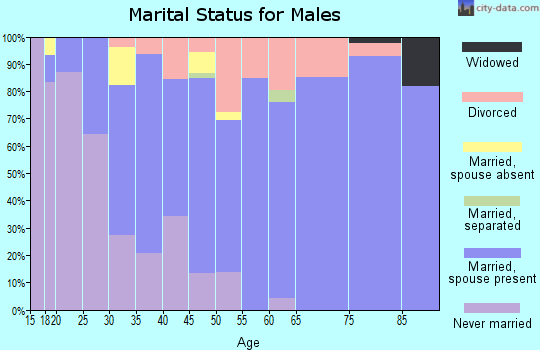
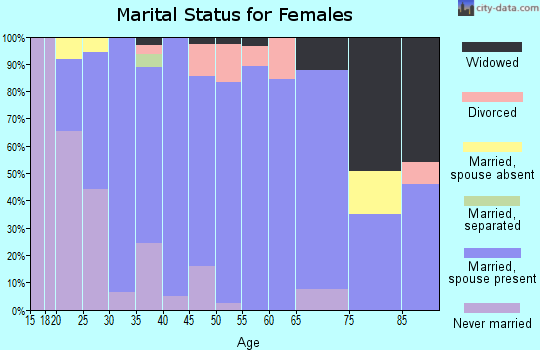
For population 15 years and over in 54425:
Never married: 28.0%
Now married: 54.4%
Separated: 2.1%
Widowed: 5.3%
Divorced: 10.3%
Zip code 54425 compared to state average:
Black race population percentage significantly below state average.
Median age below state average.
Length of stay since moving in significantly above state average.
Number of college students below state average.
Percentage of population with a bachelor's degree or higher significantly below state average.
Estimated median house/condo value in 2022: $171,847
54425:
$171,847
Wisconsin:
$252,800
According to our research of Wisconsin and other state lists, there were 6 registered sex offenders living in 54425 zip code as of May 20, 2024. The ratio of all residents to sex offenders in zip code 54425 is 347 to 1. The ratio of registered sex offenders to all residents in this zip code is near the state average.
Median resident age:
This zip code:
34.2 years
Wisconsin median age:
40.4 years
Average household size:
This zip code:
2.7 people
Wisconsin:
2.3 people
Averages for the 2020 tax year for zip code 54425, filed in 2021:
Average Adjusted Gross Income (AGI) in 2020: $51,158 (Individual Income Tax Returns)
Here:
$51,158
State:
$72,319
Salary/wage: $44,930 (reported on 84.3% of returns)
Here:
$44,930
State:
$59,242
(% of AGI for various income ranges: 1584.3% for AGIs below $25k, 4634.4% for AGIs $25k-50k, 7740.0% for AGIs $50k-75k, 11146.0% for AGIs $75k-100k, 18945.0% for AGIs $100k-200k)
Taxable interest for individuals: $1,009 (reported on 38.6% of returns)
This zip code:
$1,009
Wisconsin:
$1,431
(% of AGI for various income ranges: 32.9% for AGIs below $25k, 42.8% for AGIs $25k-50k, 86.0% for AGIs $50k-75k, 50.0% for AGIs $75k-100k, 222.5% for AGIs $100k-200k)
Ordinary dividends: $2,900 (reported on 13.3% of returns)
Here:
$2,900
State:
$6,481
(% of AGI for various income ranges: 21.7% for AGIs $25k-50k, 40.0% for AGIs $50k-75k, 600.0% for AGIs $100k-200k)
Net capital gain/loss in AGI: +$17,736 (reported on 16.9% of returns)
Here:
+$17,736
State:
+$18,329
(% of AGI for various income ranges: 49.3% for AGIs below $25k, 45.6% for AGIs $25k-50k, 345.0% for AGIs $50k-75k, 4967.5% for AGIs $100k-200k)
Profit/loss from business: +$10,710 (reported on 12.0% of returns)
Here:
+$10,710
State:
+$14,562
(% of AGI for various income ranges: 105.0% for AGIs below $25k, 140.0% for AGIs $25k-50k, 366.0% for AGIs $50k-75k, 612.0% for AGIs $75k-100k)
Taxable individual retirement arrangement distribution: $12,075 (reported on 9.6% of returns)
54425:
$12,075
Wisconsin:
$19,348
(% of AGI for various income ranges: 302.1% for AGIs below $25k, 543.0% for AGIs $50k-75k)
Earned income credit: $1,850 (reported on 14.5% of returns)
Here:
$1,850
State:
$2,155
(% of AGI for various income ranges: 77.9% for AGIs below $25k, 62.8% for AGIs $25k-50k)
Percentage of individuals using paid preparers for their 2020 taxes: 91.6%
Here:
92%
State:
94%
(% for various income ranges: 95.8% for AGIs below $25k, 88.9% for AGIs $25k-50k, 87.5% for AGIs $50k-75k, 87.5% for AGIs $75k-100k, 100.0% for AGIs $100k-200k)
Averages for the 2012 tax year for zip code 54425, filed in 2013:
Average Adjusted Gross Income (AGI) in 2012: $43,655 (Individual Income Tax Returns)
Here:
$43,655
State:
$57,939
Salary/wage: $37,363 (reported on 85.9% of returns)
Here:
$37,363
State:
$48,248
(% of AGI for various income ranges: 71.5% for AGIs below $25k, 83.5% for AGIs $25k-50k, 82.1% for AGIs $50k-75k, 77.4% for AGIs $75k-100k, 54.6% for AGIs $100k-200k)
Taxable interest for individuals: $974 (reported on 41.2% of returns)
This zip code:
$974
Wisconsin:
$1,224
(% of AGI for various income ranges: 1.4% for AGIs below $25k, 0.4% for AGIs $25k-50k, 0.4% for AGIs $50k-75k, 0.8% for AGIs $75k-100k, 1.7% for AGIs $100k-200k)
Ordinary dividends: $1,955 (reported on 12.9% of returns)
Here:
$1,955
State:
$5,137
(% of AGI for various income ranges: 0.1% for AGIs below $25k, 0.5% for AGIs $25k-50k, 0.4% for AGIs $50k-75k, 1.3% for AGIs $100k-200k)
Net capital gain/loss in AGI: +$5,621 (reported on 16.5% of returns)
Here:
+$5,621
State:
+$11,137
(% of AGI for various income ranges: 3.4% for AGIs below $25k, 1.1% for AGIs $25k-50k, 4.8% for AGIs $50k-75k, 1.4% for AGIs $100k-200k)
Profit/loss from business: +$8,175 (reported on 14.1% of returns)
Here:
+$8,175
State:
+$11,943
(% of AGI for various income ranges: 7.3% for AGIs below $25k, 2.4% for AGIs $25k-50k, 5.3% for AGIs $50k-75k)
Taxable individual retirement arrangement distribution: $10,622 (reported on 10.6% of returns)
54425:
$10,622
Wisconsin:
$14,087
(% of AGI for various income ranges: 5.5% for AGIs below $25k, 3.1% for AGIs $25k-50k, 8.4% for AGIs $75k-100k)
Total itemized deductions: $17,550 (18% of AGI, reported on 16.5% of returns)
Here:
$17,550
State:
$22,257
Here:
17.9% of AGI
State:
20.1% of AGI
(% of AGI for various income ranges: 6.1% for AGIs $25k-50k, 6.2% for AGIs $50k-75k, 11.0% for AGIs $75k-100k, 8.2% for AGIs $100k-200k)
Charity contributions: $1,912 (reported on 9.4% of returns)
Here:
$1,912
State:
$3,370
(% of AGI for various income ranges: 0.5% for AGIs $25k-50k, 1.5% for AGIs $75k-100k, 0.4% for AGIs $100k-200k)
Taxes paid: $8,014 (reported on 16.5% of returns)
54425:
$8,014
State:
$10,731
(% of AGI for various income ranges: 1.8% for AGIs $25k-50k, 2.2% for AGIs $50k-75k, 4.3% for AGIs $75k-100k, 5.6% for AGIs $100k-200k)
Earned income credit: $1,915 (reported on 15.3% of returns)
Here:
$1,915
State:
$2,094
(% of AGI for various income ranges: 4.1% for AGIs below $25k, 0.8% for AGIs $25k-50k)
Percentage of individuals using paid preparers for their 2012 taxes: 64.7%
Here:
65%
State:
54%
(% for various income ranges: 57.6% for AGIs below $25k, 62.1% for AGIs $25k-50k, 69.2% for AGIs $50k-75k, 83.3% for AGIs $75k-100k, 100.0% for AGIs $100k-200k)
Averages for the 2004 tax year for zip code 54425, filed in 2005:
Average Adjusted Gross Income (AGI) in 2004: $33,173 (Individual Income Tax Returns)
Here:
$33,173
State:
$47,735
Salary/wage: $30,596 (reported on 87.2% of returns)
Here:
$30,596
State:
$41,540
(% of AGI for various income ranges: 215.8% for AGIs below $10k, 75.3% for AGIs $10k-25k, 82.0% for AGIs $25k-50k, 80.9% for AGIs $50k-75k, 77.1% for AGIs $75k-100k, 67.1% for AGIs over 100k)
Taxable interest for individuals: $1,328 (reported on 53.9% of returns)
This zip code:
$1,328
Wisconsin:
$1,420
(% of AGI for various income ranges: 13.9% for AGIs below $10k, 2.4% for AGIs $10k-25k, 2.0% for AGIs $25k-50k, 0.8% for AGIs $50k-75k, 1.2% for AGIs $75k-100k, 5.6% for AGIs over 100k)
Taxable dividends: $962 (reported on 19.0% of returns)
Here:
$962
State:
$2,869
(% of AGI for various income ranges: 3.0% for AGIs below $10k, 1.0% for AGIs $10k-25k, 0.4% for AGIs $25k-50k, 0.5% for AGIs $50k-75k, 0.9% for AGIs $75k-100k)
Net capital gain/loss: +$5,323 (reported on 18.4% of returns)
Here:
+$5,323
State:
+$9,569
(% of AGI for various income ranges: 22.7% for AGIs below $10k, 3.8% for AGIs $10k-25k, 2.3% for AGIs $25k-50k, 2.6% for AGIs $50k-75k, 5.0% for AGIs $75k-100k)
Profit/loss from business: +$6,629 (reported on 16.6% of returns)
Here:
+$6,629
State:
+$10,417
(% of AGI for various income ranges: 3.3% for AGIs below $10k, 5.5% for AGIs $10k-25k, 4.2% for AGIs $25k-50k, 1.5% for AGIs $50k-75k, 5.7% for AGIs $75k-100k)
Profit/loss from farming: +$3,967 (reported on 10.8% of returns)
Here:
+$3,967
State:
-$2,654
(% of AGI for various income ranges: -35.2% for AGIs below $10k, 3.1% for AGIs $10k-25k, 1.5% for AGIs $25k-50k, 2.9% for AGIs $50k-75k)
IRA payment deduction: $2,820 (reported on 5.9% of returns)
54425:
$2,820
Wisconsin:
$2,900
Total itemized deductions: $13,551 (21% of AGI, reported on 19.8% of returns)
Here:
$13,551
State:
$18,160
Here:
20.9% of AGI
State:
21.1% of AGI
(% of AGI for various income ranges: 5.2% for AGIs $10k-25k, 6.5% for AGIs $25k-50k, 9.0% for AGIs $50k-75k, 13.7% for AGIs $75k-100k, 9.0% for AGIs over 100k)
Charity contributions deductions: $1,535 (2% of AGI, reported on 15.3% of returns)
Here:
$1,535
State:
$2,711
Here:
2.3% of AGI
State:
3.0% of AGI
(% of AGI for various income ranges: 0.5% for AGIs $10k-25k, 0.4% for AGIs $25k-50k, 0.6% for AGIs $50k-75k, 1.6% for AGIs $75k-100k, 1.3% for AGIs over 100k)
Total tax: $3,651 (reported on 76.7% of returns)
54425:
$3,651
State:
$7,114
(% of AGI for various income ranges: 3.9% for AGIs below $10k, 4.9% for AGIs $10k-25k, 6.5% for AGIs $25k-50k, 7.2% for AGIs $50k-75k, 9.5% for AGIs $75k-100k, 22.3% for AGIs over 100k)
Earned income credit: $1,327 (reported on 13.4% of returns)
Here:
$1,327
State:
$1,544
Percentage of individuals using paid preparers for their 2004 taxes: 70.0%
Here:
70%
State:
57%
(% for various income ranges: 56.2% for AGIs below $10k, 72.6% for AGIs $10k-25k, 69.4% for AGIs $25k-50k, 77.1% for AGIs $50k-75k, 87.8% for AGIs $75k-100k, 100.0% for AGIs over 100k)
Household received Food Stamps/SNAP in the past 12 months: 71 Household did not receive Food Stamps/SNAP in the past 12 months: 666
Women who had a birth in the past 12 months: 33 (24 now married, 8 unmarried) Women who did not have a birth in the past 12 months: 359 (175 now married, 184 unmarried)
Housing units in zip code 54425 with a mortgage: 302 (43 second mortgage, 1 home equity loan, 36 both second mortgage and home equity loan) Houses without a mortgage: 5
Median monthly owner costs for units with a mortgage: $1,323 Median monthly owner costs for units without a mortgage: $513
Residents with income below the poverty level in 2022:
This zip code:
11.4%
Whole state:
10.7%
Residents with income below 50% of the poverty level in 2022:
This zip code:
6.4%
Whole state:
5.7%
Median number of rooms in houses and condos:
Here:
6.8
State:
6.5
Median number of rooms in apartments:
Here:
4.1
State:
4.1
Notable locations in this zip code not listed on our city pages
Churches in zip code 54425 include: Peace United Church of Christ (A), Saint Louis Church (B), Saint Peter Lutheran Church (C). Display/hide their locations on the map
In group quarters: 13 (-1 institutionalized population)
Size of family households: 245 2-persons, 111 3-persons, 45 4-persons, 45 5-persons, 27 6-persons, 29 7-or-more-persons
Size of nonfamily households: 212 1-person, 17 2-persons, 1 5-persons
440 married couples with children.
142 single-parent households (73 men, 69 women).
83.9% of residents of 54425 zip code speak English at home.
7.7% of residents speak Spanish at home (19% very well, 14% well, 43% not well, 24% not at all).
9.3% of residents speak other Indo-European language at home (59% very well, 34% well, 5% not well, 2% not at all).
Foreign born population: 109 (5.5%) (18.2% of them are naturalized citizens)
This zip code:
5.5%
Whole state:
5.0%
57%Honduras
26%Mexico
16%El Salvador
3%Germany
50%German
10%Pennsylvania German
5%Swiss
5%American
4%Polish
3%English
3%European
Year of entry for the foreign-born population
742010 or later
82000 to 2009
131990 to 1999
21Before 1990
Facilities with environmental interests located in this zip code:
DORCHESTER WASTEWATER TREATMENT FACILITY (3RD AVENUE in DORCHESTER, WI)
National Pollutant Discharge Elimination System NON-MAJOR (Tracking pollutant discharge elimination systems) - permit National Pollutant Discharge Elimination System NON-MAJOR (Tracking pollutant discharge elimination systems) - permit STATE MASTER (Wisconsin database) - PCS-WI0021571, WASTEWATER FACILITY Business SIC classification: SEWERAGE SYSTEMS Organizations: VILLAGE OF DORCHESTER Alternative names: DORCHESTER VILLAGE
DORCHESTER EL (300 W WASHINGTON ST in DORCHESTER, WI)
(National Center for Education Statistics) - STATE ID-0100 Organizations: COLBY SCH DIST (SCHOOL DISTRICT)
DORCHESTER STATE BANK (101 W CENTER AVE in DORCHESTER, WI)
(Resource Conservation and Recovery Act (tracking hazardous waste))
COOPERATIVE SER (PO BOX 260 in DORCHESTER, WI)
COMPLIANCE ACTIVITY (Tracking inspections of insecticide, fungicide, and rodenticide, and toxic substances)
Housing units lacking complete plumbing facilities: 1.7%
41.2%Utility gas
30.0%Bottled, tank, or LP gas
13.0%Wood
9.6%Electricity
5.9%Fuel oil, kerosene, etc.
Population in 1990: 1,860. Population change in the 1990s: +95 (+5.1%).
Place of birth for U.S.-born residents:
This state: 1,597
Northeast: 59
Midwest: 136
South: 43
West: 20
63% of the 54425 zip code residents lived in the same house 5 years ago. Out of people who lived in different houses, 46% lived in this county. Out of people who lived in different counties, 50% lived in Wisconsin.
93% of the 54425 zip code residents lived in the same house 1 year ago. Out of people who lived in different houses, 35% moved from this county. Out of people who lived in different houses, 49% moved from different county within same state. Out of people who lived in different houses, 14% moved from different state. Out of people who lived in different houses, 6% moved from abroad.
Private vs. public school enrollment:
Students in private schools in grades 1 to 8 (elementary and middle school): 79
Here:
34.7%
Wisconsin:
16.7%
Students in private schools in grades 9 to 12 (high school): 12
Here:
12.3%
Wisconsin:
12.5%
Students in private undergraduate colleges: 1
Here:
6.8%
Wisconsin:
17.5%
Occupation by median earnings in the past 12 months ($)
70,232Transportation occupations
63,376Health diagnosing and treating practitioners and other technical occupations
57,810Installation, maintenance, and repair occupations
50,798Architecture and engineering occupations
50,241Education, training, and library occupations
48,834Community and social service occupations
Top industries in this zip code by the number of employees in 2005:
Health Care and Social Assistance: Residential Mental Retardation Facilities (20-49 employees: 1 establishment)
Finance and Insurance: Commercial Banking (20-49: 1)
Wholesale Trade: Farm and Garden Machinery and Equipment Merchant Wholesalers (20-49: 1)
Home Mortgage Disclosure Act Aggregated Statistics For Year 2009 (Based on 2 partial tracts)
A) FHA, FSA/RHS & VA Home Purchase Loans
B) Conventional Home Purchase Loans
C) Refinancings
D) Home Improvement Loans
F) Non-occupant Loans on < 5 Family Dwellings (A B C & D)
G) Loans On Manufactured Home Dwelling (A B C & D)
Number
Average Value
Number
Average Value
Number
Average Value
Number
Average Value
Number
Average Value
Number
Average Value
LOANS ORIGINATED
1
$71,640
5
$75,570
29
$107,134
2
$43,605
3
$80,267
4
$24,858
APPLICATIONS APPROVED, NOT ACCEPTED
0
$0
0
$0
1
$129,140
0
$0
0
$0
0
$0
APPLICATIONS DENIED
0
$0
2
$39,415
5
$203,948
0
$0
0
$0
1
$12,700
APPLICATIONS WITHDRAWN
0
$0
0
$0
0
$0
0
$0
0
$0
0
$0
FILES CLOSED FOR INCOMPLETENESS
0
$0
0
$0
0
$0
0
$0
0
$0
0
$0
Aggregated Statistics For Year 2008 (Based on 2 partial tracts)
A) FHA, FSA/RHS & VA Home Purchase Loans
B) Conventional Home Purchase Loans
C) Refinancings
D) Home Improvement Loans
F) Non-occupant Loans on < 5 Family Dwellings (A B C & D)
G) Loans On Manufactured Home Dwelling (A B C & D)
Number
Average Value
Number
Average Value
Number
Average Value
Number
Average Value
Number
Average Value
Number
Average Value
LOANS ORIGINATED
1
$58,220
7
$79,547
19
$116,736
2
$49,360
3
$92,727
3
$52,233
APPLICATIONS APPROVED, NOT ACCEPTED
0
$0
1
$99,190
2
$86,255
0
$0
0
$0
0
$0
APPLICATIONS DENIED
0
$0
2
$55,945
6
$118,083
1
$27,070
0
$0
1
$31,150
APPLICATIONS WITHDRAWN
0
$0
0
$0
2
$115,250
0
$0
0
$0
0
$0
FILES CLOSED FOR INCOMPLETENESS
0
$0
0
$0
0
$0
0
$0
0
$0
0
$0
Aggregated Statistics For Year 2007 (Based on 2 partial tracts)
A) FHA, FSA/RHS & VA Home Purchase Loans
B) Conventional Home Purchase Loans
C) Refinancings
D) Home Improvement Loans
F) Non-occupant Loans on < 5 Family Dwellings (A B C & D)
G) Loans On Manufactured Home Dwelling (A B C & D)
Number
Average Value
Number
Average Value
Number
Average Value
Number
Average Value
Number
Average Value
Number
Average Value
LOANS ORIGINATED
1
$79,550
7
$95,259
17
$110,752
3
$57,503
3
$169,877
4
$21,325
APPLICATIONS APPROVED, NOT ACCEPTED
0
$0
0
$0
1
$93,680
0
$0
0
$0
0
$0
APPLICATIONS DENIED
0
$0
3
$102,550
4
$90,150
0
$0
0
$0
0
$0
APPLICATIONS WITHDRAWN
0
$0
0
$0
2
$99,315
0
$0
0
$0
0
$0
FILES CLOSED FOR INCOMPLETENESS
0
$0
0
$0
0
$0
0
$0
0
$0
0
$0
Aggregated Statistics For Year 2006 (Based on 2 partial tracts)
B) Conventional Home Purchase Loans
C) Refinancings
D) Home Improvement Loans
F) Non-occupant Loans on < 5 Family Dwellings (A B C & D)
G) Loans On Manufactured Home Dwelling (A B C & D)
Number
Average Value
Number
Average Value
Number
Average Value
Number
Average Value
Number
Average Value
LOANS ORIGINATED
8
$84,909
20
$123,957
4
$47,082
3
$186,967
3
$40,493
APPLICATIONS APPROVED, NOT ACCEPTED
1
$89,850
2
$96,560
0
$0
0
$0
0
$0
APPLICATIONS DENIED
3
$52,950
6
$101,032
0
$0
1
$85,540
0
$0
APPLICATIONS WITHDRAWN
1
$84,100
3
$96,240
0
$0
0
$0
0
$0
FILES CLOSED FOR INCOMPLETENESS
0
$0
2
$110,575
0
$0
0
$0
0
$0
Aggregated Statistics For Year 2005 (Based on 2 partial tracts)
A) FHA, FSA/RHS & VA Home Purchase Loans
B) Conventional Home Purchase Loans
C) Refinancings
D) Home Improvement Loans
F) Non-occupant Loans on < 5 Family Dwellings (A B C & D)
G) Loans On Manufactured Home Dwelling (A B C & D)
Number
Average Value
Number
Average Value
Number
Average Value
Number
Average Value
Number
Average Value
Number
Average Value
LOANS ORIGINATED
1
$57,260
7
$79,959
22
$79,220
5
$53,430
1
$132,740
3
$20,447
APPLICATIONS APPROVED, NOT ACCEPTED
0
$0
2
$48,640
2
$126,030
0
$0
0
$0
0
$0
APPLICATIONS DENIED
0
$0
1
$82,660
5
$104,610
1
$53,190
0
$0
1
$19,650
APPLICATIONS WITHDRAWN
0
$0
1
$66,850
3
$109,097
1
$69,480
0
$0
0
$0
FILES CLOSED FOR INCOMPLETENESS
0
$0
0
$0
1
$66,850
0
$0
0
$0
0
$0
Aggregated Statistics For Year 2004 (Based on 2 partial tracts)
B) Conventional Home Purchase Loans
C) Refinancings
D) Home Improvement Loans
F) Non-occupant Loans on < 5 Family Dwellings (A B C & D)
G) Loans On Manufactured Home Dwelling (A B C & D)
Number
Average Value
Number
Average Value
Number
Average Value
Number
Average Value
Number
Average Value
LOANS ORIGINATED
5
$77,104
23
$113,247
3
$26,917
1
$47,680
2
$30,070
APPLICATIONS APPROVED, NOT ACCEPTED
1
$40,250
1
$113,330
0
$0
0
$0
0
$0
APPLICATIONS DENIED
3
$76,273
9
$87,773
1
$54,390
0
$0
1
$76,670
APPLICATIONS WITHDRAWN
0
$0
4
$81,405
0
$0
0
$0
0
$0
FILES CLOSED FOR INCOMPLETENESS
0
$0
2
$80,985
0
$0
0
$0
0
$0
Aggregated Statistics For Year 2003 (Based on 2 partial tracts)
B) Conventional Home Purchase Loans
C) Refinancings
D) Home Improvement Loans
F) Non-occupant Loans on < 5 Family Dwellings (A B C & D)
Number
Average Value
Number
Average Value
Number
Average Value
Number
Average Value
LOANS ORIGINATED
5
$75,858
27
$78,571
3
$22,283
2
$52,470
APPLICATIONS APPROVED, NOT ACCEPTED
1
$56,310
2
$58,580
0
$0
0
$0
APPLICATIONS DENIED
2
$75,235
6
$83,740
1
$34,260
0
$0
APPLICATIONS WITHDRAWN
1
$152,390
2
$104,345
0
$0
0
$0
FILES CLOSED FOR INCOMPLETENESS
0
$0
1
$83,380
0
$0
0
$0
Aggregated Statistics For Year 2002 (Based on 2 partial tracts)
B) Conventional Home Purchase Loans
C) Refinancings
D) Home Improvement Loans
Number
Average Value
Number
Average Value
Number
Average Value
LOANS ORIGINATED
6
$72,040
24
$78,848
6
$35,182
APPLICATIONS APPROVED, NOT ACCEPTED
0
$0
1
$42,890
0
$0
APPLICATIONS DENIED
1
$49,360
4
$43,668
1
$23,720
APPLICATIONS WITHDRAWN
1
$87,450
2
$88,295
0
$0
FILES CLOSED FOR INCOMPLETENESS
0
$0
0
$0
0
$0
Aggregated Statistics For Year 2001 (Based on 2 partial tracts)
B) Conventional Home Purchase Loans
C) Refinancings
D) Home Improvement Loans
F) Non-occupant Loans on < 5 Family Dwellings (A B C & D)
Number
Average Value
Number
Average Value
Number
Average Value
Number
Average Value
LOANS ORIGINATED
9
$61,098
18
$73,224
4
$32,225
1
$98,240
APPLICATIONS APPROVED, NOT ACCEPTED
0
$0
2
$78,830
0
$0
0
$0
APPLICATIONS DENIED
2
$39,655
4
$55,468
1
$25,400
0
$0
APPLICATIONS WITHDRAWN
1
$49,120
3
$74,757
0
$0
0
$0
FILES CLOSED FOR INCOMPLETENESS
0
$0
0
$0
0
$0
0
$0
Aggregated Statistics For Year 2000 (Based on 2 partial tracts)
B) Conventional Home Purchase Loans
C) Refinancings
D) Home Improvement Loans
Number
Average Value
Number
Average Value
Number
Average Value
LOANS ORIGINATED
7
$59,797
7
$59,284
7
$20,229
APPLICATIONS APPROVED, NOT ACCEPTED
1
$52,470
0
$0
0
$0
APPLICATIONS DENIED
3
$42,250
4
$45,882
0
$0
APPLICATIONS WITHDRAWN
1
$29,230
2
$43,130
1
$13,420
FILES CLOSED FOR INCOMPLETENESS
0
$0
0
$0
0
$0
Aggregated Statistics For Year 1999 (Based on 1 partial tract)


+$3,967
-$2,654
(% of AGI for various income ranges: -35.2% for AGIs below $10k, 3.1% for AGIs $10k-25k, 1.5% for AGIs $25k-50k, 2.9% for AGIs $50k-75k) Nearest zip codes: 54405, 54480, 54422, 54421, 54488, 54451.