Estimated zip code population in 2022: 4,528 Zip code population in 2010: 4,422 Zip code population in 2000: 4,093
Houses and condos: 1,749 Renter-occupied apartments: 126
% of renters here:
8%
State:
28%
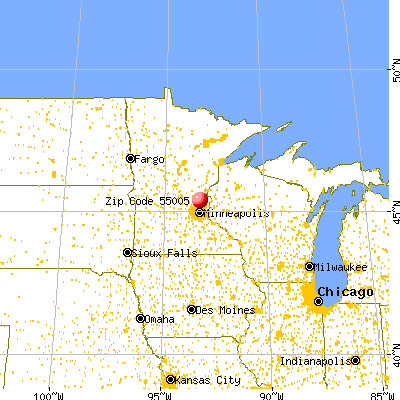
March 2022 cost of living index in zip code 55005: 98.0 (near average, U.S. average is 100)
Land area: 19.3 sq. mi. Water area: 0.9 sq. mi.
Population density: 235 people per square mile
(very low).
OSM Map
General Map
Google Map
MSN Map
OSM Map
General Map
Google Map
MSN Map
OSM Map
General Map
Google Map
MSN Map
OSM Map
General Map
Google Map
MSN Map
Please wait while loading the map...
Real estate property taxes paid for housing units in 2022:
This zip code:
0.8% ($2,561)
Minnesota:
1.0% ($3,087)
Median real estate property taxes paid for housing units with mortgages in 2022: $2,602 (0.7%) Median real estate property taxes paid for housing units with no mortgage in 2022: $2,447 (0.8%)
Business Search- 14 Million verified businesses
Males: 2,312
(51.1%)
Females: 2,215
(48.9%)
For population 25 years and over in 55005:
High school or higher: 95.1%
Bachelor's degree or higher: 16.2%
Graduate or professional degree: 4.9%
Unemployed: 3.6%
Mean travel time to work (commute): 33.4 minutes
For population 15 years and over in 55005:
Never married: 32.5%
Now married: 58.8%
Separated: 0.6%
Widowed: 1.4%
Divorced: 6.7%
Zip code 55005 compared to state average:
Black race population percentage significantly below state average.
Foreign-born population percentage significantly below state average.
Renting percentage significantly below state average.
Length of stay since moving in significantly above state average.
House age below state average.
Percentage of population with a bachelor's degree or higher significantly below state average.
Estimated median house/condo value in 2022: $335,661
55005:
$335,661
Minnesota:
$314,600
Median resident age:
This zip code:
40.6 years
Minnesota median age:
39.0 years
Average household size:
This zip code:
2.7 people
Minnesota:
2.4 people
Averages for the 2020 tax year for zip code 55005, filed in 2021:
Average Adjusted Gross Income (AGI) in 2020: $74,318 (Individual Income Tax Returns)
Here:
$74,318
State:
$82,178
Salary/wage: $65,936 (reported on 87.3% of returns)
Here:
$65,936
State:
$67,438
(% of AGI for various income ranges: 1146.1% for AGIs below $25k, 3729.0% for AGIs $25k-50k, 6666.9% for AGIs $50k-75k, 10277.7% for AGIs $75k-100k, 20738.8% for AGIs $100k-200k, 65900.0% for AGIs over 200k)
Taxable interest for individuals: $912 (reported on 26.9% of returns)
This zip code:
$912
Minnesota:
$1,814
(% of AGI for various income ranges: 8.5% for AGIs below $25k, 9.0% for AGIs $25k-50k, 39.0% for AGIs $50k-75k, 22.7% for AGIs $75k-100k, 41.2% for AGIs $100k-200k, 1180.0% for AGIs over 200k)
Ordinary dividends: $1,709 (reported on 13.9% of returns)
Here:
$1,709
State:
$6,928
(% of AGI for various income ranges: 12.0% for AGIs below $25k, 13.0% for AGIs $25k-50k, 22.1% for AGIs $50k-75k, 21.8% for AGIs $75k-100k, 68.4% for AGIs $100k-200k, 745.0% for AGIs over 200k)
Net capital gain/loss in AGI: +$10,906 (reported on 13.1% of returns)
Here:
+$10,906
State:
+$20,591
(% of AGI for various income ranges: 6.6% for AGIs below $25k, 19.8% for AGIs $25k-50k, 41.7% for AGIs $50k-75k, 48.2% for AGIs $75k-100k, 232.8% for AGIs $100k-200k, 12060.0% for AGIs over 200k)
Profit/loss from business: +$11,411 (reported on 14.3% of returns)
Here:
+$11,411
State:
+$14,342
(% of AGI for various income ranges: 126.1% for AGIs below $25k, 98.0% for AGIs $25k-50k, 325.2% for AGIs $50k-75k, 218.6% for AGIs $75k-100k, 519.1% for AGIs $100k-200k)
Taxable individual retirement arrangement distribution: $16,938 (reported on 8.6% of returns)
55005:
$16,938
Minnesota:
$20,675
(% of AGI for various income ranges: 71.0% for AGIs below $25k, 139.2% for AGIs $25k-50k, 293.1% for AGIs $50k-75k, 580.9% for AGIs $100k-200k)
Total itemized deductions: $23,642 (reported on 9.8% of returns)
Here:
$23,642
State:
$33,311
(% of AGI for various income ranges: 192.8% for AGIs $25k-50k, 313.1% for AGIs $50k-75k, 411.4% for AGIs $75k-100k, 649.4% for AGIs $100k-200k, 5060.0% for AGIs over 200k)
Charity contributions: $6,521 (reported on 5.7% of returns)
Here:
$6,521
State:
$11,879
(% of AGI for various income ranges: 20.7% for AGIs below $25k, 40.7% for AGIs $50k-75k, 22.7% for AGIs $75k-100k, 90.0% for AGIs $100k-200k, 1860.0% for AGIs over 200k)
Taxes paid: $7,465 (reported on 9.4% of returns)
55005:
$7,465
State:
$8,252
(% of AGI for various income ranges: 36.2% for AGIs $25k-50k, 103.8% for AGIs $50k-75k, 147.3% for AGIs $75k-100k, 220.0% for AGIs $100k-200k, 1215.0% for AGIs over 200k)
Earned income credit: $1,891 (reported on 9.0% of returns)
Here:
$1,891
State:
$2,055
(% of AGI for various income ranges: 52.9% for AGIs below $25k, 49.8% for AGIs $25k-50k)
Percentage of individuals using paid preparers for their 2020 taxes: 92.7%
Here:
93%
State:
94%
(% for various income ranges: 93.0% for AGIs below $25k, 94.1% for AGIs $25k-50k, 90.0% for AGIs $50k-75k, 93.5% for AGIs $75k-100k, 93.1% for AGIs $100k-200k, 87.5% for AGIs over 200k)
Averages for the 2012 tax year for zip code 55005, filed in 2013:
Average Adjusted Gross Income (AGI) in 2012: $58,944 (Individual Income Tax Returns)
Here:
$58,944
State:
$67,192
Salary/wage: $53,123 (reported on 90.6% of returns)
Here:
$53,123
State:
$55,182
(% of AGI for various income ranges: 76.6% for AGIs below $25k, 83.8% for AGIs $25k-50k, 82.8% for AGIs $50k-75k, 86.8% for AGIs $75k-100k, 87.4% for AGIs $100k-200k, 50.7% for AGIs over 200k)
Taxable interest for individuals: $444 (reported on 30.2% of returns)
This zip code:
$444
Minnesota:
$1,664
(% of AGI for various income ranges: 0.6% for AGIs below $25k, 0.4% for AGIs $25k-50k, 0.2% for AGIs $50k-75k, 0.1% for AGIs $75k-100k, 0.2% for AGIs $100k-200k, 0.3% for AGIs over 200k)
Ordinary dividends: $1,323 (reported on 14.6% of returns)
Here:
$1,323
State:
$5,665
(% of AGI for various income ranges: 0.4% for AGIs below $25k, 0.4% for AGIs $25k-50k, 0.3% for AGIs $50k-75k, 0.2% for AGIs $75k-100k, 0.5% for AGIs $100k-200k)
Net capital gain/loss in AGI: +$1,291 (reported on 10.8% of returns)
Here:
+$1,291
State:
+$16,131
(% of AGI for various income ranges: 0.3% for AGIs $50k-75k, 0.7% for AGIs $100k-200k)
Profit/loss from business: +$7,110 (reported on 14.6% of returns)
Here:
+$7,110
State:
+$12,430
(% of AGI for various income ranges: 7.0% for AGIs below $25k, 1.9% for AGIs $25k-50k, 1.6% for AGIs $50k-75k, 2.0% for AGIs $75k-100k, 1.2% for AGIs $100k-200k)
Taxable individual retirement arrangement distribution: $11,868 (reported on 9.0% of returns)
55005:
$11,868
Minnesota:
$15,212
(% of AGI for various income ranges: 4.3% for AGIs below $25k, 2.2% for AGIs $25k-50k, 1.9% for AGIs $50k-75k, 1.5% for AGIs $75k-100k, 1.8% for AGIs $100k-200k)
Total itemized deductions: $20,331 (22% of AGI, reported on 46.2% of returns)
Here:
$20,331
State:
$24,665
Here:
22.3% of AGI
State:
19.6% of AGI
(% of AGI for various income ranges: 9.9% for AGIs below $25k, 13.8% for AGIs $25k-50k, 15.9% for AGIs $50k-75k, 18.2% for AGIs $75k-100k, 17.4% for AGIs $100k-200k, 13.5% for AGIs over 200k)
Charity contributions: $1,864 (reported on 36.8% of returns)
Here:
$1,864
State:
$3,948
(% of AGI for various income ranges: 0.5% for AGIs below $25k, 0.8% for AGIs $25k-50k, 1.1% for AGIs $50k-75k, 1.2% for AGIs $75k-100k, 1.6% for AGIs $100k-200k, 0.7% for AGIs over 200k)
Taxes paid: $7,441 (reported on 46.2% of returns)
55005:
$7,441
State:
$10,589
(% of AGI for various income ranges: 2.3% for AGIs below $25k, 3.4% for AGIs $25k-50k, 5.1% for AGIs $50k-75k, 6.6% for AGIs $75k-100k, 7.1% for AGIs $100k-200k, 7.4% for AGIs over 200k)
Earned income credit: $1,929 (reported on 13.2% of returns)
Here:
$1,929
State:
$2,037
(% of AGI for various income ranges: 4.9% for AGIs below $25k, 1.0% for AGIs $25k-50k)
Percentage of individuals using paid preparers for their 2012 taxes: 52.8%
Here:
53%
State:
55%
(% for various income ranges: 45.3% for AGIs below $25k, 50.0% for AGIs $25k-50k, 58.3% for AGIs $50k-75k, 58.1% for AGIs $75k-100k, 60.0% for AGIs $100k-200k, 66.7% for AGIs over 200k)
Averages for the 2004 tax year for zip code 55005, filed in 2005:
Average Adjusted Gross Income (AGI) in 2004: $53,102 (Individual Income Tax Returns)
Here:
$53,102
State:
$53,560
Salary/wage: $47,535 (reported on 91.7% of returns)
Here:
$47,535
State:
$46,177
(% of AGI for various income ranges: 115.0% for AGIs below $10k, 80.7% for AGIs $10k-25k, 85.4% for AGIs $25k-50k, 87.6% for AGIs $50k-75k, 92.9% for AGIs $75k-100k, 66.6% for AGIs over 100k)
Taxable interest for individuals: $756 (reported on 42.1% of returns)
This zip code:
$756
Minnesota:
$1,796
(% of AGI for various income ranges: 0.8% for AGIs below $10k, 1.0% for AGIs $10k-25k, 0.4% for AGIs $25k-50k, 0.5% for AGIs $50k-75k, 0.2% for AGIs $75k-100k, 1.0% for AGIs over 100k)
Taxable dividends: $726 (reported on 19.0% of returns)
Here:
$726
State:
$3,096
(% of AGI for various income ranges: 0.3% for AGIs below $10k, 0.3% for AGIs $10k-25k, 0.3% for AGIs $25k-50k, 0.3% for AGIs $50k-75k, 0.2% for AGIs $75k-100k, 0.3% for AGIs over 100k)
Net capital gain/loss: +$9,480 (reported on 13.3% of returns)
Here:
+$9,480
State:
+$10,864
(% of AGI for various income ranges: 0.9% for AGIs below $10k, -0.4% for AGIs $10k-25k, -0.1% for AGIs $25k-50k, 0.1% for AGIs $50k-75k, -0.1% for AGIs $75k-100k, 7.9% for AGIs over 100k)
Profit/loss from business: +$6,982 (reported on 17.3% of returns)
Here:
+$6,982
State:
+$10,442
(% of AGI for various income ranges: 4.1% for AGIs below $10k, 6.8% for AGIs $10k-25k, 4.9% for AGIs $25k-50k, 3.0% for AGIs $50k-75k, 0.6% for AGIs $75k-100k, 0.6% for AGIs over 100k)
IRA payment deduction: $2,474 (reported on 2.0% of returns)
55005:
$2,474
Minnesota:
$2,955
Total itemized deductions: $17,828 (23% of AGI, reported on 52.8% of returns)
Here:
$17,828
State:
$20,035
Here:
22.6% of AGI
State:
21.3% of AGI
(% of AGI for various income ranges: 11.7% for AGIs below $10k, 11.1% for AGIs $10k-25k, 17.7% for AGIs $25k-50k, 20.2% for AGIs $50k-75k, 19.8% for AGIs $75k-100k, 15.5% for AGIs over 100k)
Charity contributions deductions: $1,836 (2% of AGI, reported on 45.7% of returns)
Here:
$1,836
State:
$3,333
Here:
2.2% of AGI
State:
3.4% of AGI
(% of AGI for various income ranges: 1.0% for AGIs below $10k, 0.7% for AGIs $10k-25k, 1.1% for AGIs $25k-50k, 1.9% for AGIs $50k-75k, 1.6% for AGIs $75k-100k, 1.8% for AGIs over 100k)
Total tax: $6,883 (reported on 82.0% of returns)
55005:
$6,883
State:
$8,485
(% of AGI for various income ranges: 3.7% for AGIs below $10k, 4.7% for AGIs $10k-25k, 6.9% for AGIs $25k-50k, 7.7% for AGIs $50k-75k, 9.1% for AGIs $75k-100k, 17.5% for AGIs over 100k)
Earned income credit: $1,563 (reported on 10.1% of returns)
Here:
$1,563
State:
$1,523
Percentage of individuals using paid preparers for their 2004 taxes: 58.0%
Here:
58%
State:
59%
(% for various income ranges: 39.5% for AGIs below $10k, 56.3% for AGIs $10k-25k, 57.9% for AGIs $25k-50k, 67.9% for AGIs $50k-75k, 62.1% for AGIs $75k-100k, 66.1% for AGIs over 100k)
Household received Food Stamps/SNAP in the past 12 months: 87 Household did not receive Food Stamps/SNAP in the past 12 months: 1,594
Women who had a birth in the past 12 months: 58 (28 now married, 29 unmarried) Women who did not have a birth in the past 12 months: 991 (499 now married, 492 unmarried)
Housing units in zip code 55005 with a mortgage: 1,131 (60 second mortgage, 55 both second mortgage and home equity loan) Houses without a mortgage: 32
Median monthly owner costs for units with a mortgage: $1,689 Median monthly owner costs for units without a mortgage: $547
Residents with income below the poverty level in 2022:
This zip code:
2.3%
Whole state:
9.6%
Residents with income below 50% of the poverty level in 2022:
This zip code:
1.0%
Whole state:
5.2%
Median number of rooms in houses and condos:
Here:
6.9
State:
7.1
Median number of rooms in apartments:
Here:
5.1
State:
3.8
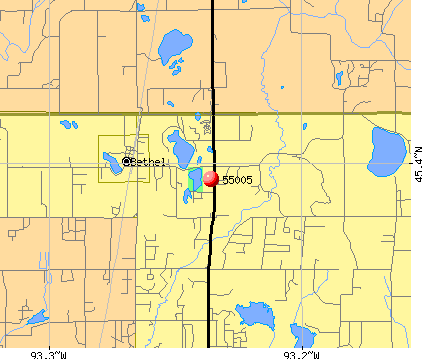
Notable locations in this zip code not listed on our city pages
Churches in zip code 55005 include: Bethel Community Church (A), Saint Andrew Lutheran Church (B), Bible Baptist Church (C). Display/hide their locations on the map
In group quarters: 19 (-1 institutionalized population)
Size of family households: 650 2-persons, 202 3-persons, 250 4-persons, 148 5-persons, 30 6-persons, 5 7-or-more-persons
Size of nonfamily households: 253 1-person, 134 2-persons, 9 3-persons
596 married couples with children.
141 single-parent households (22 men, 119 women).
92.9% of residents of 55005 zip code speak English at home.
2.9% of residents speak Spanish at home (39% very well, 25% well, 36% not well).
0.6% of residents speak other Indo-European language at home (100% very well).
0.3% of residents speak Asian or Pacific Island language at home (82% very well, 18% not well).
2.7% of residents speak other language at home (76% very well, 24% well).
Foreign born population: 130 (2.9%) (56.1% of them are naturalized citizens)
This zip code:
2.9%
Whole state:
8.7%
34%Honduras
26%Israel
8%Japan
8%Colombia
3%Malaysia
3%Thailand
1%El Salvador
36%American
20%German
6%Norwegian
5%Swedish
5%Finnish
3%Jordanian
3%European
Year of entry for the foreign-born population
1422010 or later
392000 to 2009
11990 to 1999
28Before 1990
Facilities with environmental interests located in this zip code:
NATCO TRANSMISSION (24612 ULYSSES ST NE in BETHEL, MN)
STATE MASTER (Minnesota Pollution Control Agency permits and compilance tracking) - RCRAINFO-MND982222465, CESQG, RCRIS-MND982222465, Small Quantity Generators, between 100 kg and 1000 kg of hazardous waste/month (Resource Conservation and Recovery Act (tracking hazardous waste)) - notification USED OIL PROGRAM (Resource Conservation and Recovery Act (tracking hazardous waste)) Business SIC classification: AUTOMOTIVE TRANSMISSION REPAIR SHOPS Business NAICS classification: AUTOMOTIVE TRANSMISSION REPAIR. Organizations: SWANSON TIM (CONTACT/OWNER)
BETHEL (111 WYATT N.W. in BETHEL, MN)
STATE MASTER (Minnesota Pollution Control Agency permits and compilance tracking) - PCS-MN0058475, NPDES NON-MAJOR National Pollutant Discharge Elimination System NON-MAJOR (Tracking pollutant discharge elimination systems) - permit Business SIC classification: SEWERAGE SYSTEMS Business NAICS classification: SEWAGE TREATMENT FACILITIES. Organizations: BETHEL CITY OF (CONTACT/OWNER)
Alternative names: BETHEL WWTP
OAK RIDGE AUTOBODY INC (23428 HIGHWAY 65 NE in EAST BETHEL, MN)
STATE MASTER (Minnesota Pollution Control Agency permits and compilance tracking) - RCRAINFO-MND981951635, HAZARDOUS WASTE PROGRAM, RCRIS-MND981951635, Conditionally Exempt Small Quantity Generators, less than 100 kg/month of hazardous waste (Resource Conservation and Recovery Act (tracking hazardous waste)) - notification Organizations: CHRISTOPHERSON NORM (CONTACT/OWNER)
GENES AUTO (22311 CEDAR DR NW in BETHEL, MN)
STATE MASTER (Minnesota Pollution Control Agency permits and compilance tracking) - RCRAINFO-MND982070443, HAZARDOUS WASTE PROGRAM, RCRIS-MND982070443, Conditionally Exempt Small Quantity Generators, less than 100 kg/month of hazardous waste (Resource Conservation and Recovery Act (tracking hazardous waste)) - notification Business SIC classification: TOP, BODY, AND UPHOLSTERY REPAIR SHOPS AND PAINT SHOPS Business NAICS classification: AUTOMOTIVE BODY, PAINT, AND INTERIOR REPAIR AND MAINTENANCE. Organizations: REID EUGENE (CONTACT/OWNER)
Alternative names: AUTO REPAIR
GERDIN AUTO (23742 UNIVERSITY AVENUE EXT NW in BETHEL, MN)
STATE MASTER (Minnesota Pollution Control Agency permits and compilance tracking) - RCRAINFO-MND086108610, HAZARDOUS WASTE PROGRAM, RCRIS-MND086108610, Small Quantity Generators, between 100 kg and 1000 kg of hazardous waste/month (Resource Conservation and Recovery Act (tracking hazardous waste)) - notification Organizations: GERDIN RANDAL (CONTACT/OWNER)
CENTRAL TRUCK SERVICE INC (23142 HWY 65 NE in EAST BETHEL, MN)
STATE MASTER (Minnesota Pollution Control Agency permits and compilance tracking) - RCRAINFO-MND121186506, SQG, RCRIS-MND121186506, Small Quantity Generators, between 100 kg and 1000 kg of hazardous waste/month (Resource Conservation and Recovery Act (tracking hazardous waste)) Organizations: SIBELL GLEN (CONTACT/OWNER)
PAUL GOTTS AUTO REPAIR (297 SAINT FRANCIS AVE NW in BETHEL, MN)
STATE MASTER (Minnesota Pollution Control Agency permits and compilance tracking) - RCRAINFO-MNR000079129, CESQG, RCRIS-MNR000079129, Conditionally Exempt Small Quantity Generators, less than 100 kg/month of hazardous waste (Resource Conservation and Recovery Act (tracking hazardous waste)) - notification Organizations: GOTT PAUL MICHAEL (CONTACT/OWNER)
, PAUL GOTT S AUTO REPAIR (CONTACT/OWNER)
Alternative names: GOTTS PAUL AUTO REPAIR
AUTO TRUCK HYDRAULIC PARTS STORE (22 NW MAIN ST in BETHEL, MN)
Small Quantity Generators, between 100 kg and 1000 kg of hazardous waste/month (Resource Conservation and Recovery Act (tracking hazardous waste)) - notification Organizations: ZENITH INVESTMENT (CONTACT/OWNER)
BETHEL EARLY CHILDHOOD CNTR (23820 DEWEY ST NW in BETHEL, MN)
Conditionally Exempt Small Quantity Generators, less than 100 kg/month of hazardous waste (Resource Conservation and Recovery Act (tracking hazardous waste)) - notification Organizations: ISD NO 15 (CONTACT/OWNER)
Alternative names: BETHEL ECSE
Housing units lacking complete kitchen facilities: 0.5%
88.0%Utility gas
7.9%Electricity
1.8%Bottled, tank, or LP gas
1.4%Wood
0.6%Fuel oil, kerosene, etc.
Population in 1990: 2,821. Population change in the 1990s: +1,272 (+45.1%).
Place of birth for U.S.-born residents:
This state: 3,721
Northeast: 44
Midwest: 291
South: 118
West: 148
65% of the 55005 zip code residents lived in the same house 5 years ago. Out of people who lived in different houses, 61% lived in this county. Out of people who lived in different counties, 50% lived in Minnesota.
93% of the 55005 zip code residents lived in the same house 1 year ago. Out of people who lived in different houses, 18% moved from this county. Out of people who lived in different houses, 79% moved from different county within same state. Out of people who lived in different houses, 6% moved from different state.
Private vs. public school enrollment:
Students in private schools in grades 1 to 8 (elementary and middle school): 8
Here:
2.3%
Minnesota:
12.9%
Students in private schools in grades 9 to 12 (high school): 6
Here:
2.2%
Minnesota:
8.6%
Students in private undergraduate colleges: 15
Here:
8.3%
Minnesota:
26.2%
Occupation by median earnings in the past 12 months ($)
93,554Management occupations
90,873Computer and mathematical occupations
82,916Health diagnosing and treating practitioners and other technical occupations
82,544Arts, design, entertainment, sports, and media occupations
81,241Fire fighting and prevention, and other protective service workers including supervisors
65,731Transportation occupations
Companies with federal contracts located in this zip code:
MICHALE SCAVO (22813 ZION PKWY N W in BETHEL, MN; small business) : $91,841 in 24 contractsfrom 2005 to 2006
Contracts for Valves, Nonpowered, Hose, Pipe, Tube, Lubrication, and Railing Fittings, Power and Hand Pumps, Hardware, Commercial, and moreby Defense Logistics Agency Signed by year:2000: $0; 2001: $0; 2002: $0; 2003: $0; 2004: $0; 2005: $60,930; 2006: $30,911.
Biggest contracts:
$9,360 with Defense Logistics Agency for Valves, Nonpowered. Signed on 2005-06-22. Completion date: 2005-08-21.
$8,408, same as above.Signed on 2006-04-04. Completion date: 2006-06-02.
$6,039 with Defense Logistics Agency for Hose, Pipe, Tube, Lubrication, and Railing Fittings. Signed on 2006-05-04. Completion date: 2006-06-18.
$5,474, same as above.Signed on 2005-10-20. Completion date: 2005-12-04.
Top industries in this zip code by the number of employees in 2005:
Other Services (except Public Administration): General Automotive Repair (10-19 employees: 2 establishments)
Educational Services: Sports and Recreation Instruction (10-19: 1)
Construction: New Single-Family Housing Construction (except Operative Builders) (1-4: 5)
Other Services (except Public Administration): Commercial and Industrial Machinery and Equipment (except Automotive and Electronic) Repair and Maintenance (5-9: 1, 1-4: 1)
People in group quarters in 2010:
4 people in group homes intended for adults
Fatal accident statistics in 2014:
Fatal accident count: 1
Vehicles involved in fatal accidents: 3
Fatal accidents caused by drunken drivers: 0
Fatalities: 1
Persons involved in fatal accidents: 4
Pedestrians involved in fatal accidents: 0
Fatal accident statistics in 2011:
Fatal accident count: 1
Vehicles involved in fatal accidents: 2
Fatal accidents caused by drunken drivers: 0
Fatalities: 1
Persons involved in fatal accidents: 3
Pedestrians involved in fatal accidents: 0
Home Mortgage Disclosure Act Aggregated Statistics For Year 2009 (Based on 6 partial tracts)
A) FHA, FSA/RHS & VA Home Purchase Loans
B) Conventional Home Purchase Loans
C) Refinancings
D) Home Improvement Loans
F) Non-occupant Loans on < 5 Family Dwellings (A B C & D)
G) Loans On Manufactured Home Dwelling (A B C & D)
Number
Average Value
Number
Average Value
Number
Average Value
Number
Average Value
Number
Average Value
Number
Average Value
LOANS ORIGINATED
57
$172,866
31
$148,902
259
$183,182
17
$83,026
6
$208,345
0
$0
APPLICATIONS APPROVED, NOT ACCEPTED
7
$183,289
3
$233,647
25
$183,669
3
$60,473
0
$0
0
$0
APPLICATIONS DENIED
14
$175,387
4
$112,950
106
$217,067
8
$53,615
1
$133,850
1
$25,080
APPLICATIONS WITHDRAWN
1
$127,790
3
$141,203
53
$200,862
3
$51,227
2
$96,055
0
$0
FILES CLOSED FOR INCOMPLETENESS
3
$112,530
0
$0
22
$209,793
2
$87,695
0
$0
0
$0
Aggregated Statistics For Year 2008 (Based on 6 partial tracts)
A) FHA, FSA/RHS & VA Home Purchase Loans
B) Conventional Home Purchase Loans
C) Refinancings
D) Home Improvement Loans
F) Non-occupant Loans on < 5 Family Dwellings (A B C & D)
G) Loans On Manufactured Home Dwelling (A B C & D)
Number
Average Value
Number
Average Value
Number
Average Value
Number
Average Value
Number
Average Value
Number
Average Value
LOANS ORIGINATED
42
$179,152
46
$197,461
138
$184,065
25
$82,786
17
$170,629
4
$55,830
APPLICATIONS APPROVED, NOT ACCEPTED
2
$179,130
10
$188,093
29
$183,013
8
$58,511
4
$215,388
4
$44,185
APPLICATIONS DENIED
10
$182,758
16
$152,282
96
$211,442
11
$36,870
8
$174,705
5
$43,946
APPLICATIONS WITHDRAWN
3
$172,080
2
$199,690
47
$243,691
8
$118,969
1
$271,590
0
$0
FILES CLOSED FOR INCOMPLETENESS
0
$0
0
$0
12
$193,651
2
$48,910
0
$0
0
$0
Aggregated Statistics For Year 2007 (Based on 6 partial tracts)
A) FHA, FSA/RHS & VA Home Purchase Loans
B) Conventional Home Purchase Loans
C) Refinancings
D) Home Improvement Loans
F) Non-occupant Loans on < 5 Family Dwellings (A B C & D)
G) Loans On Manufactured Home Dwelling (A B C & D)
Number
Average Value
Number
Average Value
Number
Average Value
Number
Average Value
Number
Average Value
Number
Average Value
LOANS ORIGINATED
6
$212,897
93
$195,789
244
$173,555
40
$73,191
18
$159,876
2
$87,775
APPLICATIONS APPROVED, NOT ACCEPTED
0
$0
17
$123,770
46
$202,082
5
$180,960
3
$134,397
1
$449,020
APPLICATIONS DENIED
2
$252,575
29
$170,202
147
$207,388
11
$41,529
5
$178,132
10
$93,418
APPLICATIONS WITHDRAWN
0
$0
11
$180,206
65
$207,454
4
$67,555
6
$157,147
1
$14,330
FILES CLOSED FOR INCOMPLETENESS
0
$0
4
$205,722
25
$220,774
3
$44,367
0
$0
0
$0
Aggregated Statistics For Year 2006 (Based on 6 partial tracts)
A) FHA, FSA/RHS & VA Home Purchase Loans
B) Conventional Home Purchase Loans
C) Refinancings
D) Home Improvement Loans
F) Non-occupant Loans on < 5 Family Dwellings (A B C & D)
G) Loans On Manufactured Home Dwelling (A B C & D)
Number
Average Value
Number
Average Value
Number
Average Value
Number
Average Value
Number
Average Value
Number
Average Value
LOANS ORIGINATED
7
$220,840
146
$181,361
317
$173,812
71
$67,696
28
$172,075
2
$39,665
APPLICATIONS APPROVED, NOT ACCEPTED
0
$0
17
$168,801
68
$179,218
4
$126,002
4
$229,370
3
$39,440
APPLICATIONS DENIED
0
$0
39
$180,781
141
$195,203
13
$82,735
9
$151,046
2
$26,540
APPLICATIONS WITHDRAWN
4
$194,655
20
$172,718
105
$202,895
7
$51,309
4
$197,495
0
$0
FILES CLOSED FOR INCOMPLETENESS
0
$0
7
$165,651
46
$215,869
1
$267,310
1
$164,560
0
$0
Aggregated Statistics For Year 2005 (Based on 6 partial tracts)
A) FHA, FSA/RHS & VA Home Purchase Loans
B) Conventional Home Purchase Loans
C) Refinancings
D) Home Improvement Loans
F) Non-occupant Loans on < 5 Family Dwellings (A B C & D)
G) Loans On Manufactured Home Dwelling (A B C & D)
Number
Average Value
Number
Average Value
Number
Average Value
Number
Average Value
Number
Average Value
Number
Average Value
LOANS ORIGINATED
7
$199,447
234
$186,760
388
$182,497
54
$54,096
23
$161,661
4
$24,938
APPLICATIONS APPROVED, NOT ACCEPTED
2
$303,925
27
$165,663
59
$171,305
8
$70,631
4
$160,365
4
$35,815
APPLICATIONS DENIED
2
$271,680
34
$142,286
184
$186,386
17
$48,662
3
$210,410
14
$37,545
APPLICATIONS WITHDRAWN
0
$0
26
$200,965
132
$195,130
8
$75,015
4
$185,702
1
$35,830
FILES CLOSED FOR INCOMPLETENESS
0
$0
12
$186,252
69
$208,040
4
$67,215
0
$0
0
$0
Aggregated Statistics For Year 2004 (Based on 6 partial tracts)
A) FHA, FSA/RHS & VA Home Purchase Loans
B) Conventional Home Purchase Loans
C) Refinancings
D) Home Improvement Loans
F) Non-occupant Loans on < 5 Family Dwellings (A B C & D)
G) Loans On Manufactured Home Dwelling (A B C & D)
Number
Average Value
Number
Average Value
Number
Average Value
Number
Average Value
Number
Average Value
Number
Average Value
LOANS ORIGINATED
17
$196,656
235
$180,941
366
$171,694
62
$61,034
20
$169,740
4
$29,770
APPLICATIONS APPROVED, NOT ACCEPTED
0
$0
25
$177,978
77
$159,090
2
$29,775
5
$133,934
5
$40,886
APPLICATIONS DENIED
5
$208,832
39
$133,829
130
$181,759
27
$61,203
5
$116,196
11
$47,211
APPLICATIONS WITHDRAWN
0
$0
18
$197,590
110
$180,451
13
$55,125
4
$169,530
0
$0
FILES CLOSED FOR INCOMPLETENESS
0
$0
4
$145,415
44
$188,254
2
$62,695
1
$173,540
0
$0
Aggregated Statistics For Year 2003 (Based on 6 partial tracts)
A) FHA, FSA/RHS & VA Home Purchase Loans
B) Conventional Home Purchase Loans
C) Refinancings
D) Home Improvement Loans
F) Non-occupant Loans on < 5 Family Dwellings (A B C & D)
Number
Average Value
Number
Average Value
Number
Average Value
Number
Average Value
Number
Average Value
LOANS ORIGINATED
19
$186,725
188
$185,065
783
$147,405
48
$30,649
13
$145,772
APPLICATIONS APPROVED, NOT ACCEPTED
1
$224,350
14
$134,789
80
$139,707
9
$41,758
3
$170,393
APPLICATIONS DENIED
0
$0
34
$116,787
206
$138,759
26
$29,006
4
$149,070
APPLICATIONS WITHDRAWN
0
$0
14
$194,853
124
$149,521
5
$20,228
1
$161,410
FILES CLOSED FOR INCOMPLETENESS
3
$172,937
4
$154,830
31
$166,084
2
$52,955
0
$0
Aggregated Statistics For Year 1999 (Based on 2 partial tracts)
A) FHA, FSA/RHS & VA Home Purchase Loans
B) Conventional Home Purchase Loans
C) Refinancings
D) Home Improvement Loans
F) Non-occupant Loans on < 5 Family Dwellings (A B C & D)
2002 - 2018 National Fire Incident Reporting System (NFIRS) incidents
According to the data from the years 2002 - 2018 the average number of fires per year is 9. The highest number of reported fires - 22 took place in 2017, and the least - 2 in 2002. The data has an increasing trend.
When looking into fire subcategories, the most reports belonged to: Structure Fires (51.6%), and Other (23.3%).
Fire incident types reported to NFIRS in Zip Code 55005


 Nearest zip codes: 55011, 55040, 55092, 55304, 55070, 55008.


 According to the data from the years 2002 - 2018 the average number of fires per year is 9. The highest number of reported fires - 22 took place in 2017, and the least - 2 in 2002. The data has an increasing trend.
 When looking into fire subcategories, the most reports belonged to: Structure Fires (51.6%), and Other (23.3%).