Estimated zip code population in 2022: 1,887 Zip code population in 2010: 2,035 Zip code population in 2000: 1,797
Houses and condos: 777 Renter-occupied apartments: 80
% of renters here:
11%
State:
28%
March 2022 cost of living index in zip code 55031: 96.8 (near average, U.S. average is 100)
Land area: 39.6 sq. mi. Water area: 0.0 sq. mi.
Population density: 48 people per square mile
(very low).
OSM Map
General Map
Google Map
MSN Map
OSM Map
General Map
Google Map
MSN Map
OSM Map
General Map
Google Map
MSN Map
OSM Map
General Map
Google Map
MSN Map
Please wait while loading the map...
Real estate property taxes paid for housing units in 2022:
This zip code:
0.8% ($3,020)
Minnesota:
1.0% ($3,087)
Median real estate property taxes paid for housing units with mortgages in 2022: $2,852 (0.7%) Median real estate property taxes paid for housing units with no mortgage in 2022: $3,315 (0.8%)
Business Search- 14 Million verified businesses
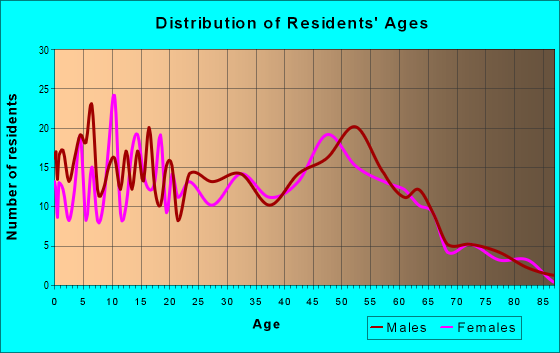
Males: 990
(52.5%)
Females: 897
(47.5%)
For population 25 years and over in 55031:
High school or higher: 95.2%
Bachelor's degree or higher: 22.3%
Graduate or professional degree: 6.2%
Unemployed: 3.1%
Mean travel time to work (commute): 26.5 minutes
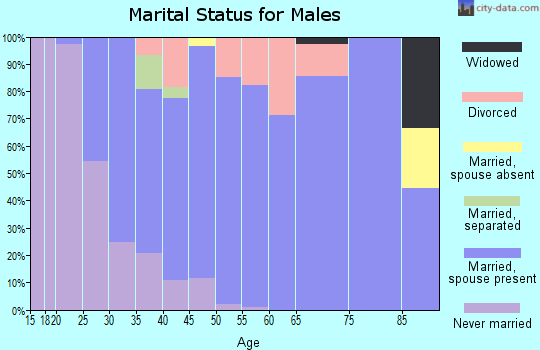
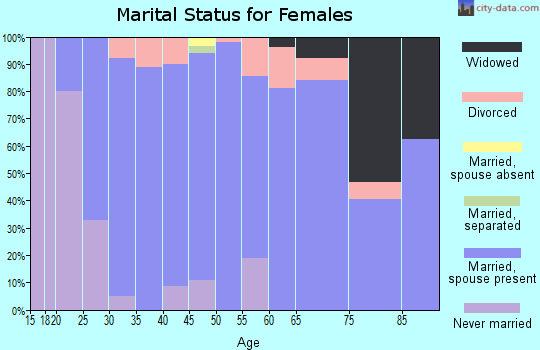
For population 15 years and over in 55031:
Never married: 29.9%
Now married: 60.6%
Separated: 0.7%
Widowed: 3.6%
Divorced: 5.2%
Zip code 55031 compared to state average:
Black race population percentage significantly below state average.
Foreign-born population percentage significantly below state average.
Renting percentage significantly below state average.
Length of stay since moving in significantly above state average.
Percentage of population with a bachelor's degree or higher below state average.
Estimated median house/condo value in 2022: $402,464
55031:
$402,464
Minnesota:
$314,600
Median resident age:
This zip code:
41.9 years
Minnesota median age:
39.0 years
Average household size:
This zip code:
2.6 people
Minnesota:
2.4 people
Averages for the 2020 tax year for zip code 55031, filed in 2021:
Average Adjusted Gross Income (AGI) in 2020: $88,047 (Individual Income Tax Returns)
Here:
$88,047
State:
$82,178
Salary/wage: $70,160 (reported on 86.1% of returns)
Here:
$70,160
State:
$67,438
(% of AGI for various income ranges: 1397.5% for AGIs below $25k, 3988.5% for AGIs $25k-50k, 7948.8% for AGIs $50k-75k, 8507.0% for AGIs $75k-100k, 16461.4% for AGIs $100k-200k)
Taxable interest for individuals: $1,277 (reported on 43.6% of returns)
This zip code:
$1,277
Minnesota:
$1,814
(% of AGI for various income ranges: 13.1% for AGIs below $25k, 29.2% for AGIs $25k-50k, 41.2% for AGIs $50k-75k, 122.0% for AGIs $75k-100k, 57.9% for AGIs $100k-200k)
Ordinary dividends: $5,687 (reported on 22.8% of returns)
Here:
$5,687
State:
$6,928
(% of AGI for various income ranges: 3.8% for AGIs below $25k, 40.8% for AGIs $25k-50k, 66.2% for AGIs $50k-75k, 86.0% for AGIs $75k-100k, 118.6% for AGIs $100k-200k)
Net capital gain/loss in AGI: +$16,229 (reported on 20.8% of returns)
Here:
+$16,229
State:
+$20,591
(% of AGI for various income ranges: 83.8% for AGIs $25k-50k, 77.5% for AGIs $50k-75k, 341.0% for AGIs $75k-100k, 495.0% for AGIs $100k-200k)
Profit/loss from business: +$12,307 (reported on 14.9% of returns)
Here:
+$12,307
State:
+$14,342
(% of AGI for various income ranges: 38.8% for AGIs below $25k, 146.9% for AGIs $25k-50k, 371.2% for AGIs $50k-75k, 206.0% for AGIs $75k-100k, 778.6% for AGIs $100k-200k)
Taxable individual retirement arrangement distribution: $18,691 (reported on 10.9% of returns)
55031:
$18,691
Minnesota:
$20,675
(% of AGI for various income ranges: 312.3% for AGIs $25k-50k, 368.0% for AGIs $75k-100k, 915.7% for AGIs $100k-200k)
Total itemized deductions: $30,500 (reported on 8.9% of returns)
Here:
$30,500
State:
$33,311
(% of AGI for various income ranges: 905.0% for AGIs $50k-75k, 1443.6% for AGIs $100k-200k)
Charity contributions: $7,400 (reported on 6.9% of returns)
Here:
$7,400
State:
$11,879
(% of AGI for various income ranges: 28.5% for AGIs $25k-50k, 343.6% for AGIs $100k-200k)
Taxes paid: $7,510 (reported on 9.9% of returns)
55031:
$7,510
State:
$8,252
(% of AGI for various income ranges: 288.8% for AGIs $50k-75k, 229.3% for AGIs $100k-200k)
Earned income credit: $1,800 (reported on 7.9% of returns)
Here:
$1,800
State:
$2,055
(% of AGI for various income ranges: 57.5% for AGIs below $25k, 40.0% for AGIs $25k-50k)
Percentage of individuals using paid preparers for their 2020 taxes: 94.1%
Here:
94%
State:
94%
(% for various income ranges: 92.0% for AGIs below $25k, 89.5% for AGIs $25k-50k, 92.9% for AGIs $50k-75k, 100.0% for AGIs $75k-100k, 100.0% for AGIs $100k-200k, 83.3% for AGIs over 200k)
Averages for the 2012 tax year for zip code 55031, filed in 2013:
Average Adjusted Gross Income (AGI) in 2012: $66,903 (Individual Income Tax Returns)
Here:
$66,903
State:
$67,192
Salary/wage: $56,817 (reported on 89.7% of returns)
Here:
$56,817
State:
$55,182
(% of AGI for various income ranges: 78.4% for AGIs below $25k, 75.3% for AGIs $25k-50k, 80.5% for AGIs $50k-75k, 80.5% for AGIs $75k-100k, 80.6% for AGIs $100k-200k, 61.0% for AGIs over 200k)
Taxable interest for individuals: $1,433 (reported on 44.3% of returns)
This zip code:
$1,433
Minnesota:
$1,664
(% of AGI for various income ranges: 2.7% for AGIs below $25k, 1.1% for AGIs $25k-50k, 0.5% for AGIs $50k-75k, 0.6% for AGIs $75k-100k, 0.4% for AGIs $100k-200k, 2.0% for AGIs over 200k)
Ordinary dividends: $2,509 (reported on 22.7% of returns)
Here:
$2,509
State:
$5,665
(% of AGI for various income ranges: 0.8% for AGIs below $25k, 0.7% for AGIs $25k-50k, 0.5% for AGIs $50k-75k, 0.5% for AGIs $75k-100k, 0.2% for AGIs $100k-200k, 2.6% for AGIs over 200k)
Net capital gain/loss in AGI: +$16,344 (reported on 16.5% of returns)
Here:
+$16,344
State:
+$16,131
(% of AGI for various income ranges: 0.7% for AGIs below $25k, 0.3% for AGIs $50k-75k, 0.2% for AGIs $75k-100k, 2.5% for AGIs $100k-200k, 16.2% for AGIs over 200k)
Profit/loss from business: +$14,693 (reported on 15.5% of returns)
Here:
+$14,693
State:
+$12,430
(% of AGI for various income ranges: 3.1% for AGIs below $25k, 7.1% for AGIs $25k-50k, 2.1% for AGIs $50k-75k, 0.5% for AGIs $75k-100k, 6.6% for AGIs $100k-200k)
Taxable individual retirement arrangement distribution: $13,290 (reported on 10.3% of returns)
55031:
$13,290
Minnesota:
$15,212
(% of AGI for various income ranges: 3.0% for AGIs below $25k, 4.7% for AGIs $25k-50k, 2.8% for AGIs $75k-100k, 2.7% for AGIs $100k-200k)
Total itemized deductions: $22,596 (21% of AGI, reported on 46.4% of returns)
Here:
$22,596
State:
$24,665
Here:
20.7% of AGI
State:
19.6% of AGI
(% of AGI for various income ranges: 9.0% for AGIs below $25k, 14.5% for AGIs $25k-50k, 17.0% for AGIs $50k-75k, 16.1% for AGIs $75k-100k, 17.1% for AGIs $100k-200k, 14.4% for AGIs over 200k)
Charity contributions: $2,545 (reported on 39.2% of returns)
Here:
$2,545
State:
$3,948
(% of AGI for various income ranges: 1.8% for AGIs $25k-50k, 1.3% for AGIs $50k-75k, 1.3% for AGIs $75k-100k, 1.8% for AGIs $100k-200k, 1.6% for AGIs over 200k)
Taxes paid: $9,478 (reported on 46.4% of returns)
55031:
$9,478
State:
$10,589
(% of AGI for various income ranges: 2.0% for AGIs below $25k, 3.7% for AGIs $25k-50k, 5.3% for AGIs $50k-75k, 5.6% for AGIs $75k-100k, 7.7% for AGIs $100k-200k, 9.5% for AGIs over 200k)
Earned income credit: $1,550 (reported on 8.2% of returns)
Here:
$1,550
State:
$2,037
(% of AGI for various income ranges: 2.4% for AGIs below $25k, 0.6% for AGIs $25k-50k)
Percentage of individuals using paid preparers for their 2012 taxes: 61.9%
Here:
62%
State:
55%
(% for various income ranges: 48.4% for AGIs below $25k, 61.1% for AGIs $25k-50k, 66.7% for AGIs $50k-75k, 64.3% for AGIs $75k-100k, 75.0% for AGIs $100k-200k, 100.0% for AGIs over 200k)
Averages for the 2004 tax year for zip code 55031, filed in 2005:
Average Adjusted Gross Income (AGI) in 2004: $61,190 (Individual Income Tax Returns)
Here:
$61,190
State:
$53,560
Salary/wage: $48,085 (reported on 90.6% of returns)
Here:
$48,085
State:
$46,177
(% of AGI for various income ranges: 142.0% for AGIs below $10k, 82.8% for AGIs $10k-25k, 85.0% for AGIs $25k-50k, 85.2% for AGIs $50k-75k, 88.1% for AGIs $75k-100k, 50.5% for AGIs over 100k)
Taxable interest for individuals: $1,758 (reported on 55.6% of returns)
This zip code:
$1,758
Minnesota:
$1,796
(% of AGI for various income ranges: 8.9% for AGIs below $10k, 4.0% for AGIs $10k-25k, 1.3% for AGIs $25k-50k, 1.6% for AGIs $50k-75k, 0.6% for AGIs $75k-100k, 1.8% for AGIs over 100k)
Taxable dividends: $1,279 (reported on 25.2% of returns)
Here:
$1,279
State:
$3,096
(% of AGI for various income ranges: 0.9% for AGIs below $10k, 0.7% for AGIs $10k-25k, 0.5% for AGIs $25k-50k, 0.3% for AGIs $50k-75k, 0.6% for AGIs $75k-100k, 0.6% for AGIs over 100k)
Net capital gain/loss: +$12,342 (reported on 19.6% of returns)
Here:
+$12,342
State:
+$10,864
(% of AGI for various income ranges: -1.1% for AGIs below $10k, -0.4% for AGIs $10k-25k, 0.7% for AGIs $25k-50k, 0.5% for AGIs $50k-75k, 0.1% for AGIs $75k-100k, 8.8% for AGIs over 100k)
Profit/loss from business: +$9,500 (reported on 15.7% of returns)
Here:
+$9,500
State:
+$10,442
(% of AGI for various income ranges: 4.3% for AGIs below $10k, -0.3% for AGIs $10k-25k, 3.8% for AGIs $25k-50k, 1.6% for AGIs $50k-75k, 0.7% for AGIs $75k-100k, 3.5% for AGIs over 100k)
IRA payment deduction: $3,318 (reported on 2.3% of returns)
55031:
$3,318
Minnesota:
$2,955
Total itemized deductions: $19,434 (19% of AGI, reported on 48.4% of returns)
Here:
$19,434
State:
$20,035
Here:
19.5% of AGI
State:
21.3% of AGI
(% of AGI for various income ranges: 18.2% for AGIs $10k-25k, 13.7% for AGIs $25k-50k, 18.5% for AGIs $50k-75k, 20.1% for AGIs $75k-100k, 12.3% for AGIs over 100k)
Charity contributions deductions: $2,490 (2% of AGI, reported on 43.7% of returns)
Here:
$2,490
State:
$3,333
Here:
2.4% of AGI
State:
3.4% of AGI
(% of AGI for various income ranges: 2.0% for AGIs $10k-25k, 1.4% for AGIs $25k-50k, 1.8% for AGIs $50k-75k, 1.8% for AGIs $75k-100k, 1.9% for AGIs over 100k)
Total tax: $9,025 (reported on 80.3% of returns)
55031:
$9,025
State:
$8,485
(% of AGI for various income ranges: 3.7% for AGIs below $10k, 4.6% for AGIs $10k-25k, 7.4% for AGIs $25k-50k, 7.3% for AGIs $50k-75k, 9.3% for AGIs $75k-100k, 17.2% for AGIs over 100k)
Earned income credit: $1,407 (reported on 6.2% of returns)
Here:
$1,407
State:
$1,523
Percentage of individuals using paid preparers for their 2004 taxes: 64.7%
Here:
65%
State:
59%
(% for various income ranges: 58.2% for AGIs below $10k, 54.8% for AGIs $10k-25k, 63.5% for AGIs $25k-50k, 70.5% for AGIs $50k-75k, 74.8% for AGIs $75k-100k, 70.4% for AGIs over 100k)
Household received Food Stamps/SNAP in the past 12 months: 28 Household did not receive Food Stamps/SNAP in the past 12 months: 690
Women who had a birth in the past 12 months: 13 (11 now married, 1 unmarried) Women who did not have a birth in the past 12 months: 359 (171 now married, 187 unmarried)
Housing units in zip code 55031 with a mortgage: 391 (70 second mortgage, 62 both second mortgage and home equity loan) Houses without a mortgage: 10
Median monthly owner costs for units with a mortgage: $1,951 Median monthly owner costs for units without a mortgage: $725
Residents with income below the poverty level in 2022:
This zip code:
5.3%
Whole state:
9.6%
Residents with income below 50% of the poverty level in 2022:
This zip code:
3.0%
Whole state:
5.2%
Median number of rooms in houses and condos:
Here:
7.4
State:
7.1
Median number of rooms in apartments:
Here:
4.0
State:
3.8
Notable locations in this zip code not listed on our city pages
Notable locations in zip code 55031: Hampton (A), Sunshine Orchard (B), Randolph - Hampton Fire Department Station 2 (C), Hampton City Hall (D). Display/hide their locations on the map
Cemeteries: Saint Mary's Catholic Church Cemetery (1), Hampton Cemetery (2), Zion Cemetery (3), Saint Mathias Cemetery (4). Display/hide their locations on the map
295 married couples with children.
74 single-parent households (22 men, 52 women).
97.5% of residents of 55031 zip code speak English at home.
1.0% of residents speak Spanish at home (56% very well, 39% well, 6% not well).
0.7% of residents speak other Indo-European language at home (85% very well, 15% not well).
0.2% of residents speak Asian or Pacific Island language at home (100% very well).
Foreign born population: 28 (1.5%) (71.5% of them are naturalized citizens)
This zip code:
1.5%
Whole state:
8.7%
22%Ivory Coast
19%Iran
15%Costa Rica
7%Singapore
7%Tanzania
60%German
6%American
5%Norwegian
3%Irish
2%Swedish
2%Scandinavian
2%Polish
Year of entry for the foreign-born population
82010 or later
192000 to 2009
91990 to 1999
27Before 1990
Facilities with environmental interests located in this zip code:
HAMPTON WASTEWATER TREATMENT PLANT (23400 HAMPTON BOULEVARD in HAMPTON, MN)
STATE MASTER (Minnesota Pollution Control Agency permits and compilance tracking) - PCS-MN0021946, NPDES NON-MAJOR National Pollutant Discharge Elimination System NON-MAJOR (Tracking pollutant discharge elimination systems) - permit Business SIC classification: SEWERAGE SYSTEMS Business NAICS classification: SEWAGE TREATMENT FACILITIES. Organizations: HAMPTON CITY OF (CONTACT/OWNER)
Alternative names: HAMPTON WWTF, HAMPTON WWTP
BRAUN TURF FARMS (2950 232ND ST in HAMPTON, MN)
STATE MASTER (Minnesota Pollution Control Agency permits and compilance tracking) - RCRAINFO-MND074104837, CESQG, RCRIS-MND074104837, Conditionally Exempt Small Quantity Generators, less than 100 kg/month of hazardous waste (Resource Conservation and Recovery Act (tracking hazardous waste)) - notification Business SIC classification: MANUFACTURING INDUSTRIES Organizations: BRAUN CRAIG (CONTACT/OWNER)
NICOLAI REPAIR (23449 LEWISTON BLVD in HAMPTON, MN)
STATE MASTER (Minnesota Pollution Control Agency permits and compilance tracking) - RCRAINFO-MND099055667, CESQG, RCRIS-MND099055667, Small Quantity Generators, between 100 kg and 1000 kg of hazardous waste/month (Resource Conservation and Recovery Act (tracking hazardous waste)) - notification Business SIC classification: GENERAL AUTOMOTIVE REPAIR SHOPS Business NAICS classification: GENERAL AUTOMOTIVE REPAIR. Organizations: LEO NICOLAI (CONTACT/OWNER)
FREIERMUTH ROBERT (23310 CANNON FALLS BLVD in HAMPTON, MN)
(Integrated Compliance Information System) - ICIS-05-1990-0049, FORMAL ENFORCEMENT ACTION Business SIC classification: WATER, SEWER, PIPELINE, AND COMMUNICATIONS AND POWER LINE CONSTRUCTION
BMD AUTOBODY (DAKOTA CO 47 AND MN HWY 50 in HAMPTON, MN)
Small Quantity Generators, between 100 kg and 1000 kg of hazardous waste/month (Resource Conservation and Recovery Act (tracking hazardous waste)) - notification Organizations: RATHMAN MELVIN (CONTACT/OWNER)
FARMERS UNION COOP OIL ASSOCIATION (5454 250TH STREET EAST in HAMPTON, MN)
ENFORCEMENT/COMPLIANCE ACTIVITY (Integrated Compliance Information System) COMPLIANCE ACTIVITY (Tracking inspections of insecticide, fungicide, and rodenticide, and toxic substances) Alternative names: FARMERS UNION COOP OIL ASSN
FARMERS UNION COOP OIL ASSN (BOX 26 in HAMPTON, MN)
COMPLIANCE ACTIVITY (Tracking inspections of insecticide, fungicide, and rodenticide, and toxic substances)
Housing units lacking complete plumbing facilities: 1.0% Housing units lacking complete kitchen facilities: 2.9%
46.2%Utility gas
43.0%Bottled, tank, or LP gas
6.9%Electricity
2.7%Wood
0.9%Other fuel
Population in 1990: 1,780. Population change in the 1990s: +17 (+1.0%).
Place of birth for U.S.-born residents:
This state: 1,550
Northeast: 19
Midwest: 136
South: 52
West: 57
70% of the 55031 zip code residents lived in the same house 5 years ago. Out of people who lived in different houses, 53% lived in this county. Out of people who lived in different counties, 50% lived in Minnesota.
94% of the 55031 zip code residents lived in the same house 1 year ago. Out of people who lived in different houses, 68% moved from this county. Out of people who lived in different houses, 23% moved from different county within same state. Out of people who lived in different houses, 7% moved from different state.
Private vs. public school enrollment:
Students in private schools in grades 1 to 8 (elementary and middle school): 31
Here:
16.2%
Minnesota:
12.9%
Students in private schools in grades 9 to 12 (high school):
Here:
0.0%
Minnesota:
8.6%
Students in private undergraduate colleges: 16
Here:
19.9%
Minnesota:
26.2%
Occupation by median earnings in the past 12 months ($)
146,699Computer and mathematical occupations
117,271Architecture and engineering occupations
92,997Law enforcement workers including supervisors
81,361Legal occupations
76,722Installation, maintenance, and repair occupations
76,359Management occupations
Top industries in this zip code by the number of employees in 2005:
Accommodation and Food Services: Full-Service Restaurants (20-49 employees: 2 establishments)
Accommodation and Food Services: Drinking Places (Alcoholic Beverages) (5-9: 3)
Construction: Site Preparation Contractors (10-19: 1, 1-4: 1)
Educational Services: Elementary and Secondary Schools (10-19: 1)
Wholesale Trade: Petroleum Bulk Stations and Terminals (10-19: 1)
Construction: Masonry Contractors (5-9: 1)
Construction: Residential Remodelers (5-9: 1)
Health Care and Social Assistance: Offices of Dentists (5-9: 1)
People in group quarters in 2000:
2 people in religious group quarters
Fatal accident statistics in 2013:
Fatal accident count: 1
Vehicles involved in fatal accidents: 1
Fatal accidents caused by drunken drivers: 0
Fatalities: 1
Persons involved in fatal accidents: 1
Pedestrians involved in fatal accidents: 0
Fatal accident statistics in 2012:
Fatal accident count: 1
Vehicles involved in fatal accidents: 1
Fatal accidents caused by drunken drivers: 1
Fatalities: 1
Persons involved in fatal accidents: 2
Pedestrians involved in fatal accidents: 0
Home Mortgage Disclosure Act Aggregated Statistics For Year 2009 (Based on 4 partial tracts)
A) FHA, FSA/RHS & VA Home Purchase Loans
B) Conventional Home Purchase Loans
C) Refinancings
D) Home Improvement Loans
F) Non-occupant Loans on < 5 Family Dwellings (A B C & D)
G) Loans On Manufactured Home Dwelling (A B C & D)
Number
Average Value
Number
Average Value
Number
Average Value
Number
Average Value
Number
Average Value
Number
Average Value
LOANS ORIGINATED
12
$212,768
9
$191,757
109
$213,651
8
$115,916
1
$103,430
0
$0
APPLICATIONS APPROVED, NOT ACCEPTED
2
$135,010
0
$0
6
$227,862
1
$38,730
0
$0
0
$0
APPLICATIONS DENIED
2
$191,540
2
$216,425
23
$258,659
2
$26,640
1
$80,810
1
$124,590
APPLICATIONS WITHDRAWN
1
$223,490
1
$234,750
29
$257,875
1
$319,170
0
$0
0
$0
FILES CLOSED FOR INCOMPLETENESS
1
$136,790
0
$0
6
$257,678
1
$32,110
0
$0
0
$0
Aggregated Statistics For Year 2008 (Based on 4 partial tracts)
A) FHA, FSA/RHS & VA Home Purchase Loans
B) Conventional Home Purchase Loans
C) Refinancings
D) Home Improvement Loans
F) Non-occupant Loans on < 5 Family Dwellings (A B C & D)
G) Loans On Manufactured Home Dwelling (A B C & D)
Number
Average Value
Number
Average Value
Number
Average Value
Number
Average Value
Number
Average Value
Number
Average Value
LOANS ORIGINATED
7
$211,059
17
$227,091
48
$210,359
12
$58,296
2
$140,685
1
$96,970
APPLICATIONS APPROVED, NOT ACCEPTED
0
$0
1
$171,650
6
$208,645
1
$41,850
0
$0
0
$0
APPLICATIONS DENIED
0
$0
7
$235,774
34
$269,883
4
$182,732
1
$152,840
1
$91,550
APPLICATIONS WITHDRAWN
0
$0
3
$294,727
10
$227,636
1
$28,860
0
$0
0
$0
FILES CLOSED FOR INCOMPLETENESS
0
$0
0
$0
4
$255,015
2
$147,505
0
$0
0
$0
Aggregated Statistics For Year 2007 (Based on 4 partial tracts)
A) FHA, FSA/RHS & VA Home Purchase Loans
B) Conventional Home Purchase Loans
C) Refinancings
D) Home Improvement Loans
E) Loans on Dwellings For 5+ Families
F) Non-occupant Loans on < 5 Family Dwellings (A B C & D)
G) Loans On Manufactured Home Dwelling (A B C & D)
Number
Average Value
Number
Average Value
Number
Average Value
Number
Average Value
Number
Average Value
Number
Average Value
Number
Average Value
LOANS ORIGINATED
1
$394,840
32
$183,719
68
$194,775
13
$98,615
0
$0
4
$76,840
1
$182,570
APPLICATIONS APPROVED, NOT ACCEPTED
0
$0
4
$265,872
16
$213,837
2
$132,250
1
$59,720
0
$0
0
$0
APPLICATIONS DENIED
0
$0
5
$181,052
52
$209,358
6
$182,665
0
$0
4
$285,035
1
$28,450
APPLICATIONS WITHDRAWN
0
$0
3
$192,200
13
$292,681
2
$156,140
0
$0
1
$224,050
0
$0
FILES CLOSED FOR INCOMPLETENESS
0
$0
0
$0
7
$224,529
0
$0
0
$0
0
$0
0
$0
Aggregated Statistics For Year 2006 (Based on 4 partial tracts)
A) FHA, FSA/RHS & VA Home Purchase Loans
B) Conventional Home Purchase Loans
C) Refinancings
D) Home Improvement Loans
F) Non-occupant Loans on < 5 Family Dwellings (A B C & D)
G) Loans On Manufactured Home Dwelling (A B C & D)
Number
Average Value
Number
Average Value
Number
Average Value
Number
Average Value
Number
Average Value
Number
Average Value
LOANS ORIGINATED
5
$216,194
45
$178,490
64
$184,597
12
$53,831
6
$146,468
1
$203,250
APPLICATIONS APPROVED, NOT ACCEPTED
0
$0
8
$202,192
11
$183,047
2
$33,610
2
$296,175
0
$0
APPLICATIONS DENIED
0
$0
11
$181,325
32
$240,114
4
$68,820
4
$176,788
2
$92,800
APPLICATIONS WITHDRAWN
0
$0
4
$255,598
20
$227,430
1
$183,400
0
$0
0
$0
FILES CLOSED FOR INCOMPLETENESS
0
$0
1
$156,700
9
$233,869
1
$287,710
0
$0
0
$0
Aggregated Statistics For Year 2005 (Based on 4 partial tracts)
A) FHA, FSA/RHS & VA Home Purchase Loans
B) Conventional Home Purchase Loans
C) Refinancings
D) Home Improvement Loans
E) Loans on Dwellings For 5+ Families
F) Non-occupant Loans on < 5 Family Dwellings (A B C & D)
G) Loans On Manufactured Home Dwelling (A B C & D)
Number
Average Value
Number
Average Value
Number
Average Value
Number
Average Value
Number
Average Value
Number
Average Value
Number
Average Value
LOANS ORIGINATED
4
$208,072
65
$173,716
86
$186,282
19
$49,271
1
$382,750
7
$169,560
2
$121,695
APPLICATIONS APPROVED, NOT ACCEPTED
0
$0
10
$148,340
17
$177,127
0
$0
0
$0
3
$95,213
0
$0
APPLICATIONS DENIED
1
$206,790
14
$151,750
35
$205,907
6
$92,933
0
$0
2
$154,105
3
$43,670
APPLICATIONS WITHDRAWN
0
$0
10
$210,643
36
$198,772
2
$66,860
0
$0
1
$216,110
0
$0
FILES CLOSED FOR INCOMPLETENESS
0
$0
0
$0
11
$172,555
1
$87,340
0
$0
1
$157,270
1
$48,160
Aggregated Statistics For Year 2004 (Based on 4 partial tracts)
A) FHA, FSA/RHS & VA Home Purchase Loans
B) Conventional Home Purchase Loans
C) Refinancings
D) Home Improvement Loans
F) Non-occupant Loans on < 5 Family Dwellings (A B C & D)
G) Loans On Manufactured Home Dwelling (A B C & D)
Number
Average Value
Number
Average Value
Number
Average Value
Number
Average Value
Number
Average Value
Number
Average Value
LOANS ORIGINATED
5
$165,904
55
$191,897
112
$173,831
15
$59,289
8
$146,702
1
$70,100
APPLICATIONS APPROVED, NOT ACCEPTED
0
$0
6
$202,590
20
$163,867
2
$35,565
0
$0
0
$0
APPLICATIONS DENIED
0
$0
10
$241,152
37
$198,946
4
$37,400
5
$172,052
1
$116,240
APPLICATIONS WITHDRAWN
0
$0
7
$221,020
34
$199,631
3
$54,850
3
$175,750
0
$0
FILES CLOSED FOR INCOMPLETENESS
0
$0
3
$188,040
10
$214,724
1
$61,210
1
$185,600
1
$177,250
Aggregated Statistics For Year 2003 (Based on 4 partial tracts)
A) FHA, FSA/RHS & VA Home Purchase Loans
B) Conventional Home Purchase Loans
C) Refinancings
D) Home Improvement Loans
F) Non-occupant Loans on < 5 Family Dwellings (A B C & D)
Number
Average Value
Number
Average Value
Number
Average Value
Number
Average Value
Number
Average Value
LOANS ORIGINATED
6
$170,443
42
$188,180
247
$165,215
16
$36,132
6
$146,505
APPLICATIONS APPROVED, NOT ACCEPTED
0
$0
5
$199,998
22
$153,386
1
$55,520
1
$116,690
APPLICATIONS DENIED
0
$0
4
$98,065
46
$164,738
2
$20,515
1
$148,910
APPLICATIONS WITHDRAWN
0
$0
3
$324,063
42
$170,093
0
$0
0
$0
FILES CLOSED FOR INCOMPLETENESS
0
$0
0
$0
12
$196,781
0
$0
0
$0
Aggregated Statistics For Year 2002 (Based on 2 partial tracts)
A) FHA, FSA/RHS & VA Home Purchase Loans
B) Conventional Home Purchase Loans
C) Refinancings
D) Home Improvement Loans
F) Non-occupant Loans on < 5 Family Dwellings (A B C & D)
Number
Average Value
Number
Average Value
Number
Average Value
Number
Average Value
Number
Average Value
LOANS ORIGINATED
2
$145,125
16
$170,441
37
$173,125
3
$26,353
1
$201,890
APPLICATIONS APPROVED, NOT ACCEPTED
0
$0
2
$119,230
3
$185,187
0
$0
0
$0
APPLICATIONS DENIED
0
$0
2
$213,830
4
$173,242
0
$0
0
$0
APPLICATIONS WITHDRAWN
0
$0
3
$156,013
5
$172,418
0
$0
0
$0
FILES CLOSED FOR INCOMPLETENESS
0
$0
0
$0
2
$281,055
0
$0
0
$0
Aggregated Statistics For Year 2001 (Based on 2 partial tracts)
A) FHA, FSA/RHS & VA Home Purchase Loans
B) Conventional Home Purchase Loans
C) Refinancings
D) Home Improvement Loans
F) Non-occupant Loans on < 5 Family Dwellings (A B C & D)
Number
Average Value
Number
Average Value
Number
Average Value
Number
Average Value
Number
Average Value
LOANS ORIGINATED
2
$134,030
9
$170,881
35
$140,394
5
$35,262
1
$41,860
APPLICATIONS APPROVED, NOT ACCEPTED
0
$0
0
$0
3
$111,970
0
$0
0
$0
APPLICATIONS DENIED
0
$0
1
$173,140
6
$157,705
1
$31,920
0
$0
APPLICATIONS WITHDRAWN
0
$0
1
$215,420
8
$127,369
1
$32,770
0
$0
FILES CLOSED FOR INCOMPLETENESS
0
$0
0
$0
3
$135,860
0
$0
0
$0
Aggregated Statistics For Year 2000 (Based on 2 partial tracts)
A) FHA, FSA/RHS & VA Home Purchase Loans
B) Conventional Home Purchase Loans
C) Refinancings
D) Home Improvement Loans
F) Non-occupant Loans on < 5 Family Dwellings (A B C & D)
Number
Average Value
Number
Average Value
Number
Average Value
Number
Average Value
Number
Average Value
LOANS ORIGINATED
1
$119,650
7
$149,309
8
$102,502
5
$26,256
1
$95,340
APPLICATIONS APPROVED, NOT ACCEPTED
0
$0
1
$190,470
1
$151,570
0
$0
0
$0
APPLICATIONS DENIED
1
$97,240
0
$0
2
$158,340
1
$15,860
0
$0
APPLICATIONS WITHDRAWN
0
$0
2
$111,725
6
$124,057
0
$0
0
$0
FILES CLOSED FOR INCOMPLETENESS
0
$0
1
$74,200
1
$201,250
0
$0
0
$0
Aggregated Statistics For Year 1999 (Based on 2 partial tracts)
A) FHA, FSA/RHS & VA Home Purchase Loans
B) Conventional Home Purchase Loans
C) Refinancings
D) Home Improvement Loans
F) Non-occupant Loans on < 5 Family Dwellings (A B C & D)
Detailed PMIC statistics for the following Tracts:0610.01
, 0614.02
2002 - 2018 National Fire Incident Reporting System (NFIRS) incidents
Based on the data from the years 2002 - 2018 the average number of fires per year is 7. The highest number of fires - 12 took place in 2012, and the least - 2 in 2002. The data has a growing trend.
When looking into fire subcategories, the most incidents belonged to: Structure Fires (35.7%), and Outside Fires (31.2%).
Fire incident types reported to NFIRS in Zip Code 55031


 Nearest zip codes: 55085, 55065, 55033, 55068, 55009, 55024.


 Based on the data from the years 2002 - 2018 the average number of fires per year is 7. The highest number of fires - 12 took place in 2012, and the least - 2 in 2002. The data has a growing trend.
 When looking into fire subcategories, the most incidents belonged to: Structure Fires (35.7%), and Outside Fires (31.2%).