Estimated zip code population in 2022: 1,289 Zip code population in 2010: 1,263 Zip code population in 2000: 1,482
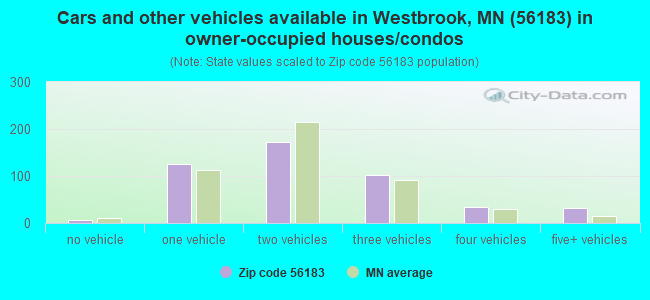
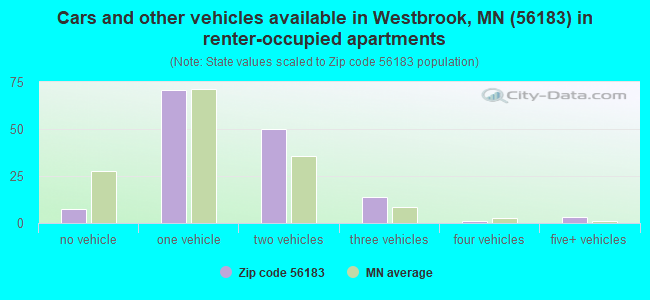
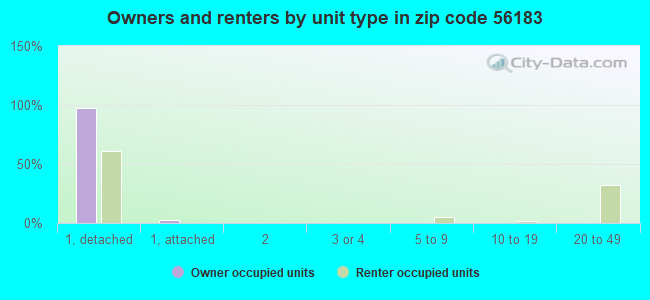
Houses and condos: 701 Renter-occupied apartments: 147
% of renters here:
24%
State:
28%
March 2022 cost of living index in zip code 56183: 84.9 (less than average, U.S. average is 100)
Land area: 102.5 sq. mi. Water area: 1.9 sq. mi.
Population density: 13 people per square mile
(very low).
OSM Map
General Map
Google Map
MSN Map
OSM Map
General Map
Google Map
MSN Map
OSM Map
General Map
Google Map
MSN Map
OSM Map
General Map
Google Map
MSN Map
Please wait while loading the map...
Real estate property taxes paid for housing units in 2022:
This zip code:
1.4% ($1,472)
Minnesota:
1.0% ($3,087)
Median real estate property taxes paid for housing units with mortgages in 2022: $1,741 (1.3%) Median real estate property taxes paid for housing units with no mortgage in 2022: $1,294 (1.3%)
Business Search- 14 Million verified businesses
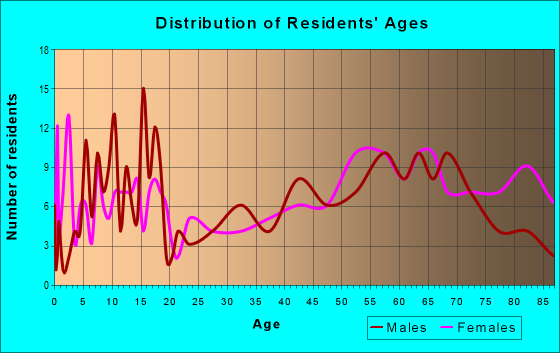
Males: 657
(51.0%)
Females: 632
(49.0%)
For population 25 years and over in 56183:
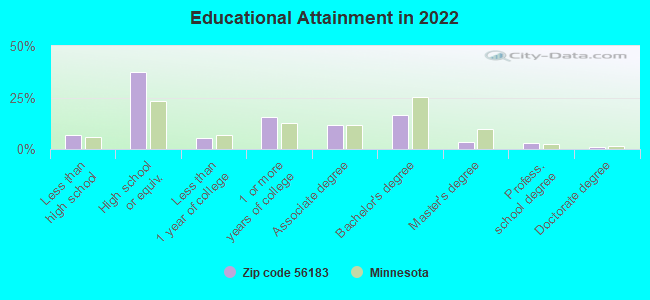
High school or higher: 92.4%
Bachelor's degree or higher: 23.5%
Graduate or professional degree: 7.3%
Unemployed: 1.0%
Mean travel time to work (commute): 20.0 minutes
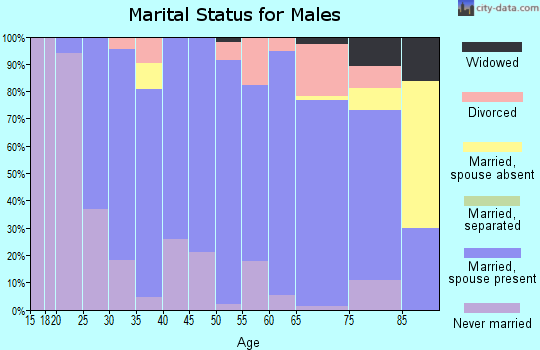
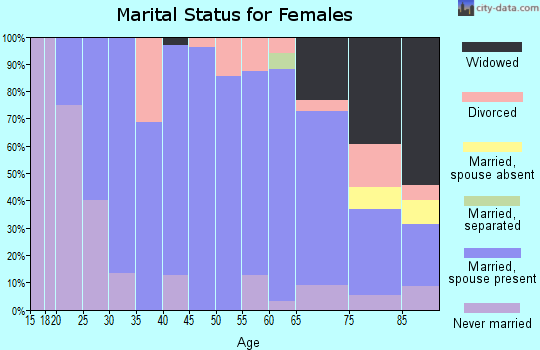
For population 15 years and over in 56183:
Never married: 29.2%
Now married: 51.6%
Separated: 0.1%
Widowed: 7.4%
Divorced: 11.7%
Zip code 56183 compared to state average:
Median household income below state average.
Median house value significantly below state average.
Unemployed percentage significantly below state average.
Black race population percentage significantly below state average.
Hispanic race population percentage significantly below state average.
Median age significantly above state average.
Foreign-born population percentage significantly below state average.
Length of stay since moving in significantly above state average.
House age above state average.
Percentage of population with a bachelor's degree or higher below state average.
Estimated median house/condo value in 2022: $107,828
56183:
$107,828
Minnesota:
$314,600
Median resident age:
This zip code:
47.9 years
Minnesota median age:
39.0 years
Average household size:
This zip code:
2.0 people
Minnesota:
2.4 people
Averages for the 2020 tax year for zip code 56183, filed in 2021:
Average Adjusted Gross Income (AGI) in 2020: $61,571 (Individual Income Tax Returns)
Here:
$61,571
State:
$82,178
Salary/wage: $40,618 (reported on 78.6% of returns)
Here:
$40,618
State:
$67,438
(% of AGI for various income ranges: 1152.2% for AGIs below $25k, 3770.0% for AGIs $25k-50k, 8325.0% for AGIs $50k-75k, 9803.3% for AGIs $75k-100k, 21390.0% for AGIs $100k-200k)
Taxable interest for individuals: $1,041 (reported on 48.2% of returns)
This zip code:
$1,041
Minnesota:
$1,814
(% of AGI for various income ranges: 62.2% for AGIs below $25k, 85.5% for AGIs $25k-50k, 107.5% for AGIs $50k-75k, 56.7% for AGIs $75k-100k, 236.7% for AGIs $100k-200k)
Ordinary dividends: $1,929 (reported on 25.0% of returns)
Here:
$1,929
State:
$6,928
(% of AGI for various income ranges: 38.9% for AGIs below $25k, 12.7% for AGIs $25k-50k, 102.5% for AGIs $50k-75k, 210.0% for AGIs $75k-100k, 390.0% for AGIs $100k-200k)
Net capital gain/loss in AGI: +$3,614 (reported on 25.0% of returns)
Here:
+$3,614
State:
+$20,591
(% of AGI for various income ranges: 31.1% for AGIs below $25k, 50.0% for AGIs $25k-50k, 150.0% for AGIs $75k-100k, 1260.0% for AGIs $100k-200k)
Profit/loss from business: +$11,282 (reported on 19.6% of returns)
Here:
+$11,282
State:
+$14,342
(% of AGI for various income ranges: 336.7% for AGIs below $25k, 677.5% for AGIs $50k-75k, 2223.3% for AGIs $100k-200k)
Taxable individual retirement arrangement distribution: $8,871 (reported on 12.5% of returns)
56183:
$8,871
Minnesota:
$20,675
(% of AGI for various income ranges: 351.8% for AGIs $25k-50k, 780.0% for AGIs $75k-100k)
Earned income credit: $1,962 (reported on 14.3% of returns)
Here:
$1,962
State:
$2,055
(% of AGI for various income ranges: 76.7% for AGIs below $25k, 80.0% for AGIs $25k-50k)
Percentage of individuals using paid preparers for their 2020 taxes: 96.4%
Here:
96%
State:
94%
(% for various income ranges: 93.8% for AGIs below $25k, 100.0% for AGIs $25k-50k, 88.9% for AGIs $50k-75k, 100.0% for AGIs $75k-100k, 100.0% for AGIs $100k-200k, 100.0% for AGIs over 200k)
Averages for the 2012 tax year for zip code 56183, filed in 2013:
Average Adjusted Gross Income (AGI) in 2012: $50,944 (Individual Income Tax Returns)
Here:
$50,944
State:
$67,192
Salary/wage: $31,509 (reported on 72.1% of returns)
Here:
$31,509
State:
$55,182
(% of AGI for various income ranges: 64.9% for AGIs below $25k, 58.6% for AGIs $25k-50k, 58.6% for AGIs $50k-75k, 52.7% for AGIs $75k-100k, 26.6% for AGIs $100k-200k)
Taxable interest for individuals: $1,359 (reported on 47.5% of returns)
This zip code:
$1,359
Minnesota:
$1,664
(% of AGI for various income ranges: 4.1% for AGIs below $25k, 1.2% for AGIs $25k-50k, 1.5% for AGIs $50k-75k, 1.1% for AGIs $75k-100k, 0.7% for AGIs $100k-200k)
Ordinary dividends: $1,525 (reported on 26.2% of returns)
Here:
$1,525
State:
$5,665
(% of AGI for various income ranges: 1.7% for AGIs below $25k, 1.0% for AGIs $25k-50k, 0.5% for AGIs $50k-75k, 1.1% for AGIs $75k-100k, 0.5% for AGIs $100k-200k)
Net capital gain/loss in AGI: +$4,767 (reported on 24.6% of returns)
Here:
+$4,767
State:
+$16,131
(% of AGI for various income ranges: 2.2% for AGIs $25k-50k, 0.1% for AGIs $50k-75k, 0.7% for AGIs $75k-100k, 4.2% for AGIs $100k-200k)
Profit/loss from business: +$7,264 (reported on 18.0% of returns)
Here:
+$7,264
State:
+$12,430
(% of AGI for various income ranges: 1.1% for AGIs below $25k, 4.8% for AGIs $25k-50k, 4.9% for AGIs $50k-75k, 1.8% for AGIs $100k-200k)
Taxable individual retirement arrangement distribution: $6,050 (reported on 13.1% of returns)
56183:
$6,050
Minnesota:
$15,212
(% of AGI for various income ranges: 5.9% for AGIs below $25k, 2.6% for AGIs $25k-50k, 3.3% for AGIs $50k-75k)
Total itemized deductions: $19,792 (19% of AGI, reported on 21.3% of returns)
Here:
$19,792
State:
$24,665
Here:
19.5% of AGI
State:
19.6% of AGI
(% of AGI for various income ranges: 12.0% for AGIs $25k-50k, 15.1% for AGIs $50k-75k, 8.3% for AGIs $100k-200k)
Charity contributions: $3,582 (reported on 18.0% of returns)
Here:
$3,582
State:
$3,948
(% of AGI for various income ranges: 2.3% for AGIs below $25k, 3.1% for AGIs $50k-75k, 1.2% for AGIs $100k-200k)
Taxes paid: $7,992 (reported on 21.3% of returns)
56183:
$7,992
State:
$10,589
(% of AGI for various income ranges: 2.1% for AGIs $25k-50k, 4.4% for AGIs $50k-75k, 5.1% for AGIs $100k-200k)
Earned income credit: $1,800 (reported on 13.1% of returns)
Here:
$1,800
State:
$2,037
(% of AGI for various income ranges: 3.6% for AGIs below $25k, 0.8% for AGIs $25k-50k)
Percentage of individuals using paid preparers for their 2012 taxes: 75.4%
Here:
75%
State:
55%
(% for various income ranges: 68.0% for AGIs below $25k, 78.6% for AGIs $25k-50k, 77.8% for AGIs $50k-75k, 80.0% for AGIs $75k-100k, 87.5% for AGIs $100k-200k)
Averages for the 2004 tax year for zip code 56183, filed in 2005:
Average Adjusted Gross Income (AGI) in 2004: $30,901 (Individual Income Tax Returns)
Here:
$30,901
State:
$53,560
Salary/wage: $25,195 (reported on 71.3% of returns)
Here:
$25,195
State:
$46,177
(% of AGI for various income ranges: 87.3% for AGIs below $10k, 51.5% for AGIs $10k-25k, 66.7% for AGIs $25k-50k, 59.8% for AGIs $50k-75k, 45.0% for AGIs $75k-100k)
Taxable interest for individuals: $1,729 (reported on 59.8% of returns)
This zip code:
$1,729
Minnesota:
$1,796
(% of AGI for various income ranges: 19.7% for AGIs below $10k, 7.4% for AGIs $10k-25k, 2.6% for AGIs $25k-50k, 2.3% for AGIs $50k-75k, 1.5% for AGIs $75k-100k)
Taxable dividends: $874 (reported on 29.5% of returns)
Here:
$874
State:
$3,096
(% of AGI for various income ranges: 2.5% for AGIs below $10k, 1.9% for AGIs $10k-25k, 0.7% for AGIs $25k-50k, 0.3% for AGIs $50k-75k, 0.7% for AGIs $75k-100k)
Net capital gain/loss: +$1,298 (reported on 30.5% of returns)
Here:
+$1,298
State:
+$10,864
(% of AGI for various income ranges: 3.7% for AGIs below $10k, 1.5% for AGIs $10k-25k, 0.9% for AGIs $25k-50k, 1.4% for AGIs $50k-75k, 1.3% for AGIs $75k-100k)
Profit/loss from business: +$5,966 (reported on 19.1% of returns)
Here:
+$5,966
State:
+$10,442
(% of AGI for various income ranges: 11.3% for AGIs below $10k, 5.7% for AGIs $10k-25k, 4.6% for AGIs $25k-50k, 2.6% for AGIs $50k-75k, 1.5% for AGIs $75k-100k)
Profit/loss from farming: +$8,691 (reported on 19.9% of returns)
Here:
+$8,691
State:
-$962
(% of AGI for various income ranges: -0.2% for AGIs below $10k, 3.8% for AGIs $10k-25k, 5.5% for AGIs $25k-50k, 11.1% for AGIs $50k-75k, 1.1% for AGIs $75k-100k)
IRA payment deduction: $2,514 (reported on 6.0% of returns)
56183:
$2,514
Minnesota:
$2,955
Total itemized deductions: $15,491 (37% of AGI, reported on 17.2% of returns)
Here:
$15,491
State:
$20,035
Here:
37.1% of AGI
State:
21.3% of AGI
(% of AGI for various income ranges: 24.8% for AGIs $10k-25k, 6.9% for AGIs $25k-50k, 4.4% for AGIs $50k-75k, 6.0% for AGIs $75k-100k)
Charity contributions deductions: $2,478 (6% of AGI, reported on 14.6% of returns)
Here:
$2,478
State:
$3,333
Here:
5.9% of AGI
State:
3.4% of AGI
Total tax: $3,827 (reported on 73.1% of returns)
56183:
$3,827
State:
$8,485
(% of AGI for various income ranges: 4.2% for AGIs below $10k, 4.6% for AGIs $10k-25k, 7.4% for AGIs $25k-50k, 9.8% for AGIs $50k-75k, 14.1% for AGIs $75k-100k)
Earned income credit: $1,500 (reported on 10.4% of returns)
Here:
$1,500
State:
$1,523
Percentage of individuals using paid preparers for their 2004 taxes: 80.1%
Here:
80%
State:
59%
(% for various income ranges: 72.3% for AGIs below $10k, 77.3% for AGIs $10k-25k, 81.7% for AGIs $25k-50k, 89.3% for AGIs $50k-75k, 90.9% for AGIs $75k-100k)
Household received Food Stamps/SNAP in the past 12 months: 51 Household did not receive Food Stamps/SNAP in the past 12 months: 570
Women who had a birth in the past 12 months: 8 (3 now married, 4 unmarried) Women who did not have a birth in the past 12 months: 227 (113 now married, 114 unmarried)
Housing units in zip code 56183 with a mortgage: 187 (10 second mortgage, 11 both second mortgage and home equity loan) Houses without a mortgage: 15
Median monthly owner costs for units with a mortgage: $1,100 Median monthly owner costs for units without a mortgage: $503
Residents with income below the poverty level in 2022:
This zip code:
17.7%
Whole state:
9.6%
Residents with income below 50% of the poverty level in 2022:
This zip code:
10.8%
Whole state:
5.2%
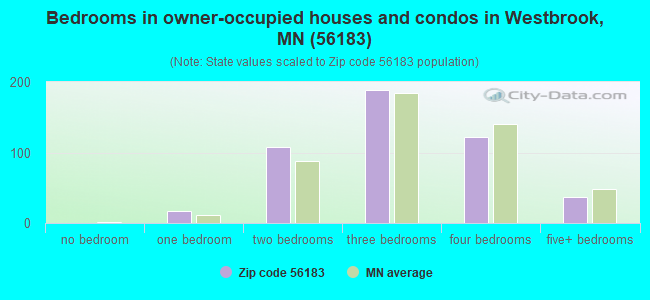
Median number of rooms in houses and condos:
Here:
6.8
State:
7.1
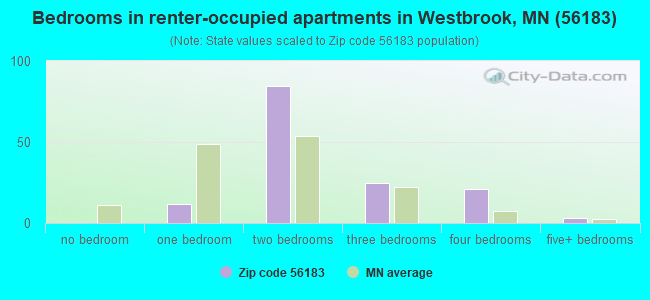
Median number of rooms in apartments:
Here:
4.2
State:
3.8
Notable locations in this zip code not listed on our city pages
Notable locations in zip code 56183: Rolling Hills Golf Club (A), Westbrook Heritage House Museum (B), Westbrook City Hall (C), Westbrook Library (D), Westbrook Volunteer Fire Department (E). Display/hide their locations on the map
Churches in zip code 56183 include: Old Westbrook Church (A), United Presbyterian Church (B), Trinity Lutheran Church (C), Saint Anthony's Church (D), Grace Lutheran Church (E), Immanuel Baptist Church (F), Rosehill Church (G). Display/hide their locations on the map
Lakes: Bean Lake (A), Round Lake (B), Lake Louisa (C), Long Lake (D), Lake Julia (E), Hurricane Lake (F), Double Lake (G), Clear Lake (H). Display/hide their locations on the map
In group quarters: 18 (-1 institutionalized population)
Size of family households: 186 2-persons, 49 3-persons, 47 4-persons, 24 5-persons, 8 6-persons, 2 7-or-more-persons
Size of nonfamily households: 237 1-person, 67 2-persons, 1 4-persons
206 married couples with children.
35 single-parent households (19 men, 16 women).
99.8% of residents of 56183 zip code speak English at home.
0.2% of residents speak Spanish at home (100% very well).
0.1% of residents speak other Indo-European language at home (100% very well).
0.4% of residents speak Asian or Pacific Island language at home (20% very well, 40% well, 40% not at all).
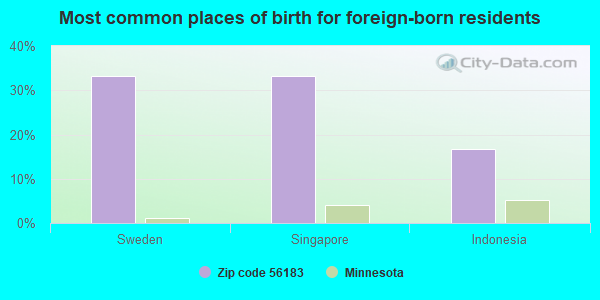
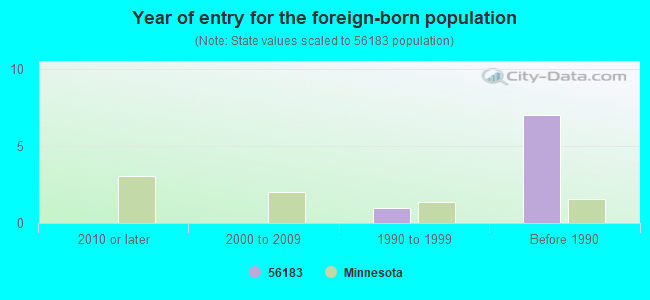
Foreign born population: 6 (0.5%) (100.0% of them are naturalized citizens)
This zip code:
0.5%
Whole state:
8.7%
33%Sweden
33%Singapore
17%Indonesia
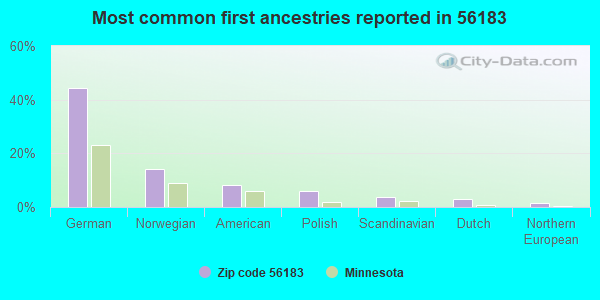
44%German
14%Norwegian
8%American
6%Polish
4%Scandinavian
3%Dutch
1%Northern European
Year of entry for the foreign-born population
02010 or later
02000 to 2009
11990 to 1999
7Before 1990
Facilities with environmental interests located in this zip code:
FARMERS ELEVATOR CO (PO BOX 157 in WESTBROOK, MN)
COMPLIANCE ACTIVITY (Tracking inspections of insecticide, fungicide, and rodenticide, and toxic substances)
Housing units lacking complete plumbing facilities: 0.5% Housing units lacking complete kitchen facilities: 0.7%
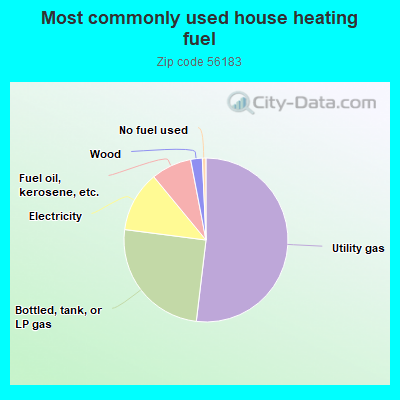
52.0%Utility gas
25.2%Bottled, tank, or LP gas
12.0%Electricity
8.0%Fuel oil, kerosene, etc.
2.3%Wood
0.7%No fuel used
Population in 1990: 1,362. Population change in the 1990s: +120 (+8.8%).
Place of birth for U.S.-born residents:
This state: 980
Northeast: 21
Midwest: 165
South: 15
West: 91
74% of the 56183 zip code residents lived in the same house 5 years ago. Out of people who lived in different houses, 51% lived in this county. Out of people who lived in different counties, 50% lived in Minnesota.
93% of the 56183 zip code residents lived in the same house 1 year ago. Out of people who lived in different houses, 42% moved from this county. Out of people who lived in different houses, 20% moved from different county within same state. Out of people who lived in different houses, 37% moved from different state. Out of people who lived in different houses, 6% moved from abroad.
Private vs. public school enrollment:
Students in private schools in grades 1 to 8 (elementary and middle school):
Here:
0.0%
Minnesota:
12.9%
Students in private schools in grades 9 to 12 (high school):
Here:
0.0%
Minnesota:
8.6%
Students in private undergraduate colleges:
Here:
0.0%
Minnesota:
26.2%
Occupation by median earnings in the past 12 months ($)
87,310Transportation occupations
70,519Community and social service occupations
66,726Sales and related occupations
60,204Management occupations
49,366Installation, maintenance, and repair occupations
49,013Health diagnosing and treating practitioners and other technical occupations
Top industries in this zip code by the number of employees in 2005:
Health Care and Social Assistance: Nursing Care Facilities (50-99 employees: 1 establishment)
Health Care and Social Assistance: General Medical and Surgical Hospitals (50-99: 1)
Wholesale Trade: Farm and Garden Machinery and Equipment Merchant Wholesalers (10-19: 1)
Other Services (except Public Administration): Religious Organizations (5-9: 1, 1-4: 4)
Other Services (except Public Administration): Civic and Social Organizations (5-9: 1, 1-4: 2)
Finance and Insurance: Commercial Banking (5-9: 1)
People in group quarters in 2010:
36 people in nursing facilities/skilled-nursing facilities
People in group quarters in 2000:
44 people in nursing homes
Fatal accident statistics in 2011:
Fatal accident count: 1
Vehicles involved in fatal accidents: 1
Fatal accidents caused by drunken drivers: 1
Fatalities: 1
Persons involved in fatal accidents: 1
Pedestrians involved in fatal accidents: 0
2002 - 2018 National Fire Incident Reporting System (NFIRS) incidents
Based on the data from the years 2002 - 2018 the average number of fire incidents per year is 6. The highest number of reported fires - 13 took place in 2008, and the least - 0 in 2016. The data has a growing trend.
When looking into fire subcategories, the most reports belonged to: Outside Fires (40.6%), and Structure Fires (22.6%).
Fire incident types reported to NFIRS in Zip Code 56183


+$8,691
-$962
(% of AGI for various income ranges: -0.2% for AGIs below $10k, 3.8% for AGIs $10k-25k, 5.5% for AGIs $25k-50k, 11.1% for AGIs $50k-75k, 1.1% for AGIs $75k-100k) Nearest zip codes: 56125, 56174, 56114, 56123, 56166, 56137.
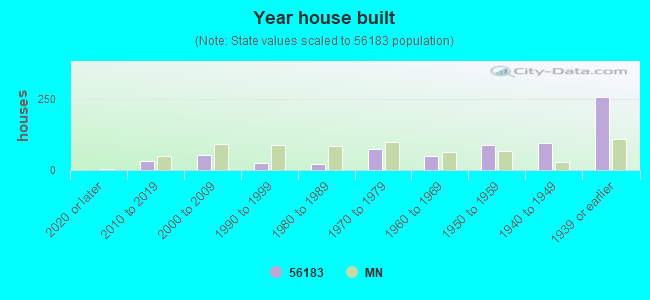


 Based on the data from the years 2002 - 2018 the average number of fire incidents per year is 6. The highest number of reported fires - 13 took place in 2008, and the least - 0 in 2016. The data has a growing trend.
 When looking into fire subcategories, the most reports belonged to: Outside Fires (40.6%), and Structure Fires (22.6%).