Estimated zip code population in 2022: 1,498 Zip code population in 2010: 1,580 Zip code population in 2000: 1,487
Houses and condos: 729 Renter-occupied apartments: 99
% of renters here:
16%
State:
28%
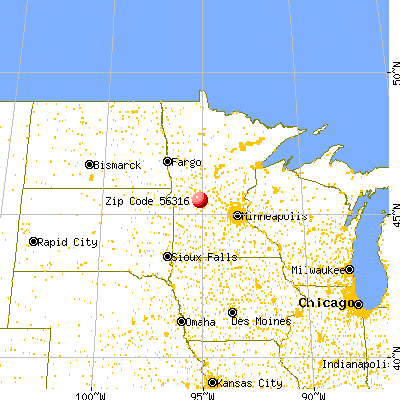
March 2022 cost of living index in zip code 56316: 86.8 (less than average, U.S. average is 100)
Land area: 135.3 sq. mi. Water area: 4.4 sq. mi.
Population density: 11 people per square mile
(very low).
OSM Map
General Map
Google Map
MSN Map
OSM Map
General Map
Google Map
MSN Map
OSM Map
General Map
Google Map
MSN Map
OSM Map
General Map
Google Map
MSN Map
Please wait while loading the map...
Real estate property taxes paid for housing units in 2022:
This zip code:
0.7% ($1,639)
Minnesota:
1.0% ($3,087)
Median real estate property taxes paid for housing units with mortgages in 2022: $1,377 (0.6%) Median real estate property taxes paid for housing units with no mortgage in 2022: $2,011 (0.9%)
Business Search- 14 Million verified businesses
Males: 806
(53.8%)
Females: 692
(46.2%)
For population 25 years and over in 56316:
High school or higher: 89.4%
Bachelor's degree or higher: 15.2%
Graduate or professional degree: 3.9%
Unemployed: 2.9%
Mean travel time to work (commute): 23.1 minutes
For population 15 years and over in 56316:
Never married: 25.6%
Now married: 56.4%
Separated: 1.4%
Widowed: 6.0%
Divorced: 10.6%
Zip code 56316 compared to state average:
Black race population percentage significantly below state average.
Median age above state average.
Foreign-born population percentage below state average.
Renting percentage below state average.
Length of stay since moving in significantly above state average.
Number of college students below state average.
Percentage of population with a bachelor's degree or higher significantly below state average.
Estimated median house/condo value in 2022: $225,310
56316:
$225,310
Minnesota:
$314,600
Median resident age:
This zip code:
44.5 years
Minnesota median age:
39.0 years
Average household size:
This zip code:
2.2 people
Minnesota:
2.4 people
Averages for the 2020 tax year for zip code 56316, filed in 2021:
Average Adjusted Gross Income (AGI) in 2020: $54,254 (Individual Income Tax Returns)
Here:
$54,254
State:
$82,178
Salary/wage: $45,136 (reported on 82.9% of returns)
Here:
$45,136
State:
$67,438
(% of AGI for various income ranges: 1417.1% for AGIs below $25k, 4107.5% for AGIs $25k-50k, 6466.7% for AGIs $50k-75k, 12452.5% for AGIs $75k-100k, 21162.5% for AGIs $100k-200k)
Taxable interest for individuals: $1,029 (reported on 50.0% of returns)
This zip code:
$1,029
Minnesota:
$1,814
(% of AGI for various income ranges: 33.6% for AGIs below $25k, 70.8% for AGIs $25k-50k, 112.2% for AGIs $50k-75k, 182.5% for AGIs $75k-100k, 135.0% for AGIs $100k-200k)
Ordinary dividends: $1,789 (reported on 12.9% of returns)
Here:
$1,789
State:
$6,928
(% of AGI for various income ranges: 37.1% for AGIs below $25k, 52.2% for AGIs $50k-75k, 155.0% for AGIs $100k-200k)
Net capital gain/loss in AGI: +$16,464 (reported on 15.7% of returns)
Here:
+$16,464
State:
+$20,591
(% of AGI for various income ranges: 63.6% for AGIs below $25k, 130.8% for AGIs $25k-50k, 514.4% for AGIs $50k-75k, 2755.0% for AGIs $100k-200k)
Profit/loss from business: +$10,986 (reported on 10.0% of returns)
Here:
+$10,986
State:
+$14,342
(% of AGI for various income ranges: 143.6% for AGIs below $25k, 265.8% for AGIs $25k-50k, 622.5% for AGIs $75k-100k)
Taxable individual retirement arrangement distribution: $7,433 (reported on 8.6% of returns)
56316:
$7,433
Minnesota:
$20,675
(% of AGI for various income ranges: 122.9% for AGIs below $25k, 304.4% for AGIs $50k-75k)
Total itemized deductions: $22,400 (reported on 2.9% of returns)
Here:
$22,400
State:
$33,311
(% of AGI for various income ranges: 373.3% for AGIs $25k-50k)
Earned income credit: $1,775 (reported on 11.4% of returns)
Here:
$1,775
State:
$2,055
(% of AGI for various income ranges: 59.3% for AGIs below $25k, 49.2% for AGIs $25k-50k)
Percentage of individuals using paid preparers for their 2020 taxes: 95.7%
Here:
96%
State:
94%
(% for various income ranges: 91.3% for AGIs below $25k, 94.4% for AGIs $25k-50k, 100.0% for AGIs $50k-75k, 100.0% for AGIs $75k-100k, 100.0% for AGIs $100k-200k)
Averages for the 2012 tax year for zip code 56316, filed in 2013:
Average Adjusted Gross Income (AGI) in 2012: $45,740 (Individual Income Tax Returns)
Here:
$45,740
State:
$67,192
Salary/wage: $34,974 (reported on 80.6% of returns)
Here:
$34,974
State:
$55,182
(% of AGI for various income ranges: 69.4% for AGIs below $25k, 72.5% for AGIs $25k-50k, 69.5% for AGIs $50k-75k, 73.3% for AGIs $75k-100k, 39.3% for AGIs $100k-200k)
Taxable interest for individuals: $1,350 (reported on 44.8% of returns)
This zip code:
$1,350
Minnesota:
$1,664
(% of AGI for various income ranges: 2.1% for AGIs below $25k, 1.2% for AGIs $25k-50k, 3.7% for AGIs $50k-75k, 0.1% for AGIs $75k-100k, 0.2% for AGIs $100k-200k)
Ordinary dividends: $1,325 (reported on 11.9% of returns)
Here:
$1,325
State:
$5,665
Net capital gain/loss in AGI: +$14,386 (reported on 20.9% of returns)
Here:
+$14,386
State:
+$16,131
(% of AGI for various income ranges: 2.8% for AGIs below $25k, 2.4% for AGIs $25k-50k, 4.1% for AGIs $50k-75k, 16.1% for AGIs $100k-200k)
Profit/loss from business: +$6,036 (reported on 16.4% of returns)
Here:
+$6,036
State:
+$12,430
(% of AGI for various income ranges: 5.9% for AGIs below $25k, 3.2% for AGIs $25k-50k, 1.0% for AGIs $50k-75k, 3.9% for AGIs $75k-100k)
Taxable individual retirement arrangement distribution: $6,757 (reported on 10.4% of returns)
56316:
$6,757
Minnesota:
$15,212
Total itemized deductions: $19,806 (23% of AGI, reported on 25.4% of returns)
Here:
$19,806
State:
$24,665
Here:
22.7% of AGI
State:
19.6% of AGI
(% of AGI for various income ranges: 13.1% for AGIs $25k-50k, 12.7% for AGIs $50k-75k, 12.2% for AGIs $75k-100k, 11.1% for AGIs $100k-200k)
Charity contributions: $2,757 (reported on 20.9% of returns)
Here:
$2,757
State:
$3,948
(% of AGI for various income ranges: 1.5% for AGIs $25k-50k, 1.2% for AGIs $50k-75k, 0.8% for AGIs $75k-100k, 1.8% for AGIs $100k-200k)
Taxes paid: $5,241 (reported on 25.4% of returns)
56316:
$5,241
State:
$10,589
(% of AGI for various income ranges: 2.1% for AGIs $25k-50k, 2.9% for AGIs $50k-75k, 3.6% for AGIs $75k-100k, 4.1% for AGIs $100k-200k)
Earned income credit: $1,875 (reported on 17.9% of returns)
Here:
$1,875
State:
$2,037
(% of AGI for various income ranges: 5.1% for AGIs below $25k, 1.0% for AGIs $25k-50k)
Percentage of individuals using paid preparers for their 2012 taxes: 70.1%
Here:
70%
State:
55%
(% for various income ranges: 57.7% for AGIs below $25k, 70.0% for AGIs $25k-50k, 80.0% for AGIs $50k-75k, 83.3% for AGIs $75k-100k, 100.0% for AGIs $100k-200k)
Averages for the 2004 tax year for zip code 56316, filed in 2005:
Average Adjusted Gross Income (AGI) in 2004: $33,502 (Individual Income Tax Returns)
Here:
$33,502
State:
$53,560
Salary/wage: $29,168 (reported on 82.1% of returns)
Here:
$29,168
State:
$46,177
(% of AGI for various income ranges: 143.3% for AGIs below $10k, 70.4% for AGIs $10k-25k, 73.1% for AGIs $25k-50k, 72.1% for AGIs $50k-75k, 67.6% for AGIs $75k-100k, 60.5% for AGIs over 100k)
Taxable interest for individuals: $1,583 (reported on 51.5% of returns)
This zip code:
$1,583
Minnesota:
$1,796
(% of AGI for various income ranges: 13.0% for AGIs below $10k, 5.2% for AGIs $10k-25k, 1.9% for AGIs $25k-50k, 1.8% for AGIs $50k-75k, 1.2% for AGIs $75k-100k, 1.9% for AGIs over 100k)
Taxable dividends: $639 (reported on 16.6% of returns)
Here:
$639
State:
$3,096
(% of AGI for various income ranges: 1.0% for AGIs below $10k, 0.5% for AGIs $10k-25k, 0.3% for AGIs $25k-50k, 0.2% for AGIs $50k-75k, 0.6% for AGIs $75k-100k)
Net capital gain/loss: +$6,322 (reported on 22.4% of returns)
Here:
+$6,322
State:
+$10,864
(% of AGI for various income ranges: 4.2% for AGIs below $10k, 3.7% for AGIs $10k-25k, 2.5% for AGIs $25k-50k, 2.3% for AGIs $50k-75k, 15.9% for AGIs $75k-100k, 0.6% for AGIs over 100k)
Profit/loss from business: +$7,895 (reported on 17.5% of returns)
Here:
+$7,895
State:
+$10,442
(% of AGI for various income ranges: 21.3% for AGIs below $10k, 8.2% for AGIs $10k-25k, 6.4% for AGIs $25k-50k, 2.4% for AGIs $50k-75k, -0.6% for AGIs $75k-100k)
IRA payment deduction: $3,821 (reported on 4.3% of returns)
56316:
$3,821
Minnesota:
$2,955
Total itemized deductions: $15,022 (24% of AGI, reported on 21.0% of returns)
Here:
$15,022
State:
$20,035
Here:
24.0% of AGI
State:
21.3% of AGI
(% of AGI for various income ranges: 7.0% for AGIs $10k-25k, 9.0% for AGIs $25k-50k, 9.1% for AGIs $50k-75k, 10.7% for AGIs $75k-100k, 13.9% for AGIs over 100k)
Charity contributions deductions: $2,100 (3% of AGI, reported on 16.9% of returns)
Here:
$2,100
State:
$3,333
Here:
3.3% of AGI
State:
3.4% of AGI
(% of AGI for various income ranges: 0.7% for AGIs $10k-25k, 1.1% for AGIs $25k-50k, 0.7% for AGIs $50k-75k, 1.2% for AGIs $75k-100k, 2.1% for AGIs over 100k)
Total tax: $3,643 (reported on 76.4% of returns)
56316:
$3,643
State:
$8,485
(% of AGI for various income ranges: 7.3% for AGIs below $10k, 4.7% for AGIs $10k-25k, 7.3% for AGIs $25k-50k, 7.5% for AGIs $50k-75k, 9.7% for AGIs $75k-100k, 14.9% for AGIs over 100k)
Earned income credit: $1,628 (reported on 13.2% of returns)
Here:
$1,628
State:
$1,523
Percentage of individuals using paid preparers for their 2004 taxes: 74.4%
Here:
74%
State:
59%
(% for various income ranges: 70.1% for AGIs below $10k, 72.7% for AGIs $10k-25k, 70.8% for AGIs $25k-50k, 89.2% for AGIs $50k-75k, 82.9% for AGIs $75k-100k, 70.0% for AGIs over 100k)
Likely homosexual households (counted as self-reported same-sex unmarried-partner households)
Lesbian couples: 0.6% of all households
Gay men: 0.0% of all households
Household received Food Stamps/SNAP in the past 12 months: 58 Household did not receive Food Stamps/SNAP in the past 12 months: 575
Women who had a birth in the past 12 months: 7 (7 now married, 0 unmarried) Women who did not have a birth in the past 12 months: 261 (139 now married, 122 unmarried)
Housing units in zip code 56316 with a mortgage: 252 (15 second mortgage, 8 both second mortgage and home equity loan) Houses without a mortgage: 1
Median monthly owner costs for units with a mortgage: $1,280 Median monthly owner costs for units without a mortgage: $563
Residents with income below the poverty level in 2022:
This zip code:
13.2%
Whole state:
9.6%
Residents with income below 50% of the poverty level in 2022:
This zip code:
4.0%
Whole state:
5.2%
Median number of rooms in houses and condos:
Here:
6.2
State:
7.1
Median number of rooms in apartments:
Here:
5.4
State:
3.8
Notable locations in this zip code not listed on our city pages
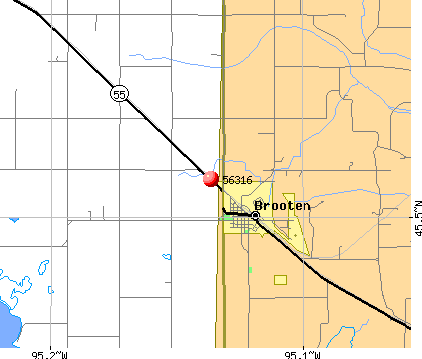
Notable locations in zip code 56316: Brooten (A), Prairie View Community Golf (B), Brooten Fire Department (C), Brooten Police Department (D). Display/hide their locations on the map
Churches in zip code 56316 include: Big Grove Church (A), Trinity Lutheran Church (B), Saint Donatus Catholic Church (C), Christian Reformed Church (D), South Lake Johanna Church (E), West Lake Johanna Church (F). Display/hide their locations on the map
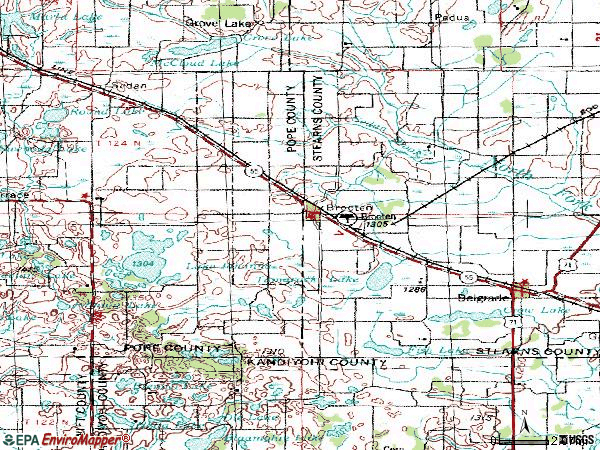
Cemeteries: South Lake Johanna Cemetery (1), West Lake Johanna Cemetery (2), Grove Lake Cemetery (3), Lake Johanna Cemetery (4), Saint Donatus Cemetery (5), Big Grove Church Cemetery (6), Christian Reform Church Cemetery (7). Display/hide their locations on the map
Lakes, reservoirs, and swamps: Tracey Slough (A), Tamarack Lake (B), Skanning Lake (C), Section Twelve Lake (D), Round Lake (E), Rocky Mountain Lake (F), Ole Lake (G), Kittleson Lake (H). Display/hide their locations on the map
Parks in zip code 56316 include: Little Jo State Wildlife Management Area (1), Skarpness State Wildlife Management Area (2), Tamarack State Wildlife Management Area (3), Fort Lake Johanna and Iverson Cabin Historical Marker (4), Bangor State Wildlife Management Area (5). Display/hide their locations on the map
In group quarters: 85 (-1 institutionalized population)
Size of family households: 198 2-persons, 59 3-persons, 47 4-persons, 30 5-persons, 12 6-persons, 21 7-or-more-persons
Size of nonfamily households: 239 1-person, 26 2-persons
246 married couples with children.
62 single-parent households (15 men, 47 women).
89.7% of residents of 56316 zip code speak English at home.
6.0% of residents speak Spanish at home (53% very well, 19% well, 1% not well, 27% not at all).
3.6% of residents speak other Indo-European language at home (98% very well, 2% well).
0.1% of residents speak Asian or Pacific Island language at home (100% very well).
Foreign born population: 57 (3.8%) (37.0% of them are naturalized citizens)
This zip code:
3.8%
Whole state:
8.7%
91%Honduras
5%Japan
2%Chile
31%German
31%Norwegian
8%American
4%Dutch
3%Irish
2%European
2%Swiss
Year of entry for the foreign-born population
02010 or later
22000 to 2009
251990 to 1999
43Before 1990
Facilities with environmental interests located in this zip code:
B B E BUS GARAGE (530 1ST AVE in BROOTEN, MN)
STATE MASTER (Minnesota Pollution Control Agency permits and compilance tracking) - RCRAINFO-MN0000262832, HAZARDOUS WASTE PROGRAM, RCRIS-MN0000262832, Conditionally Exempt Small Quantity Generators, less than 100 kg/month of hazardous waste (Resource Conservation and Recovery Act (tracking hazardous waste)) - notification Organizations: B B E SCHOOL DIST 736 737 (CONTACT/OWNER)
, BBE BUS GARAGE (CONTACT/OWNER)
Alternative names: BBE BUS GARAGE
BBE ELEM SCHOOL& BUS GARAGE (250 2ND AVE in BROOTEN, MN)
STATE MASTER (Minnesota Pollution Control Agency permits and compilance tracking) - RCRAINFO-MN0000262840, CESQG, RCRIS-MN0000262840, Conditionally Exempt Small Quantity Generators, less than 100 kg/month of hazardous waste (Resource Conservation and Recovery Act (tracking hazardous waste)) - notification Business SIC and NAICS classification: ELEMENTARY AND SECONDARY SCHOOLS Organizations: B B E SCHOOL DIST 736 737 (CONTACT/OWNER)
, BELGRADE-BROOTEN-ELROSA SECONDARY SCHOOL (CONTACT/OWNER)
Alternative names: B B E ELEM SCHOOL AND BUS GARAGE
BELGRADE-BROOTEN-ELROSA EL. (250 2ND AVE. in BROOTEN, MN)
(National Center for Education Statistics) - STATE ID-012364001
AQUA-THERM, LLC (TERPSTRA-ISANE CORP) (48301 STATE HIGHWAY 55 in BROOTEN, MN)
AIR MINOR (AIRS/AFS) Business SIC classification: NONCLASSIFIABLE ESTABLISHMENTS
Housing units lacking complete plumbing facilities: 3.1% Housing units lacking complete kitchen facilities: 0.3%
64.3%Bottled, tank, or LP gas
15.8%Utility gas
10.9%Electricity
6.4%Wood
2.4%Fuel oil, kerosene, etc.
0.7%Other fuel
Population in 1990: 1,287. Population change in the 1990s: +200 (+15.5%).
Place of birth for U.S.-born residents:
This state: 1,176
Northeast: 7
Midwest: 156
South: 41
West: 38
71% of the 56316 zip code residents lived in the same house 5 years ago. Out of people who lived in different houses, 43% lived in this county. Out of people who lived in different counties, 50% lived in Minnesota.
96% of the 56316 zip code residents lived in the same house 1 year ago. Out of people who lived in different houses, 80% moved from this county. Out of people who lived in different houses, 18% moved from different county within same state. Out of people who lived in different houses, 2% moved from different state.
Private vs. public school enrollment:
Students in private schools in grades 1 to 8 (elementary and middle school): 24
Here:
15.2%
Minnesota:
12.9%
Students in private schools in grades 9 to 12 (high school): 6
Here:
8.8%
Minnesota:
8.6%
Students in private undergraduate colleges:
Here:
0.0%
Minnesota:
26.2%
Occupation by median earnings in the past 12 months ($)
87,255Health diagnosing and treating practitioners and other technical occupations
80,468Computer and mathematical occupations
71,789Architecture and engineering occupations
64,873Management occupations
63,754Business and financial operations occupations
51,541Construction and extraction occupations
Top industries in this zip code by the number of employees in 2005:
Finance and Insurance: Commercial Banking (10-19 employees: 1 establishment)
Construction: Plumbing, Heating, and Air-Conditioning Contractors (10-19: 1)
Other Services (except Public Administration): Civic and Social Organizations (10-19: 1)
Detailed PMIC statistics for the following Tracts:0109.00
2002 - 2018 National Fire Incident Reporting System (NFIRS) incidents
Based on the data from the years 2002 - 2018 the average number of fire incidents per year is 12. The highest number of fires - 29 took place in 2012, and the least - 2 in 2015. The data has a declining trend.
When looking into fire subcategories, the most incidents belonged to: Outside Fires (52.9%), and Structure Fires (29.3%).
Fire incident types reported to NFIRS in Zip Code 56316


 Nearest zip codes: 56289, 56334, 56312, 56385, 56325, 56273.


 Based on the data from the years 2002 - 2018 the average number of fire incidents per year is 12. The highest number of fires - 29 took place in 2012, and the least - 2 in 2015. The data has a declining trend.
 When looking into fire subcategories, the most incidents belonged to: Outside Fires (52.9%), and Structure Fires (29.3%).