Estimated zip code population in 2022: 2,879 Zip code population in 2010: 2,700 Zip code population in 2000: 2,406
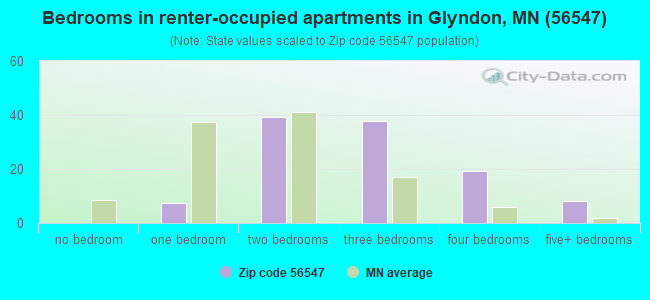
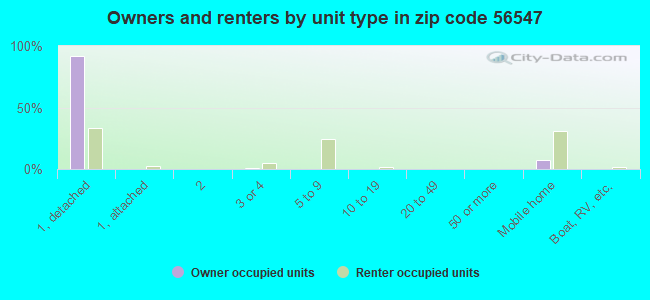
Houses and condos: 1,016 Renter-occupied apartments: 114
% of renters here:
12%
State:
28%
March 2022 cost of living index in zip code 56547: 87.2 (less than average, U.S. average is 100)
Land area: 155.2 sq. mi. Water area: 0.1 sq. mi.
Population density: 19 people per square mile
(very low).
OSM Map
General Map
Google Map
MSN Map
OSM Map
General Map
Google Map
MSN Map
OSM Map
General Map
Google Map
MSN Map
OSM Map
General Map
Google Map
MSN Map
Please wait while loading the map...
Real estate property taxes paid for housing units in 2022:
This zip code:
0.9% ($2,541)
Minnesota:
1.0% ($3,087)
Median real estate property taxes paid for housing units with mortgages in 2022: $2,742 (0.9%) Median real estate property taxes paid for housing units with no mortgage in 2022: $2,287 (0.9%)
Business Search- 14 Million verified businesses
Males: 1,424
(49.5%)
Females: 1,454
(50.5%)
For population 25 years and over in 56547:
High school or higher: 93.1%
Bachelor's degree or higher: 26.2%
Graduate or professional degree: 6.6%
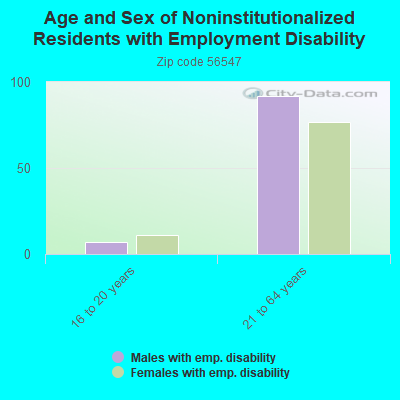
Unemployed: 1.8%
Mean travel time to work (commute): 23.9 minutes
For population 15 years and over in 56547:
Never married: 26.2%
Now married: 62.8%
Separated: 1.5%
Widowed: 2.1%
Divorced: 7.5%
Zip code 56547 compared to state average:
Unemployed percentage below state average.
Black race population percentage significantly below state average.
Foreign-born population percentage significantly below state average.
Renting percentage significantly below state average.
Length of stay since moving in significantly above state average.
Number of rooms per house above state average.
Percentage of population with a bachelor's degree or higher below state average.
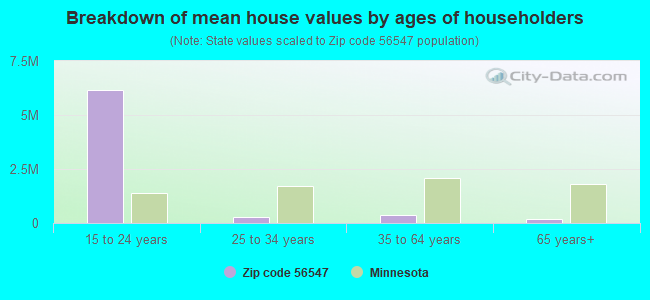
Estimated median house/condo value in 2022: $287,506
56547:
$287,506
Minnesota:
$314,600
Median resident age:
This zip code:
37.3 years
Minnesota median age:
39.0 years
Average household size:
This zip code:
3.0 people
Minnesota:
2.4 people
Averages for the 2020 tax year for zip code 56547, filed in 2021:
Average Adjusted Gross Income (AGI) in 2020: $76,627 (Individual Income Tax Returns)
Here:
$76,627
State:
$82,178
Salary/wage: $63,718 (reported on 89.3% of returns)
Here:
$63,718
State:
$67,438
(% of AGI for various income ranges: 1398.3% for AGIs below $25k, 3679.5% for AGIs $25k-50k, 6281.3% for AGIs $50k-75k, 9568.9% for AGIs $75k-100k, 17681.2% for AGIs $100k-200k)
Taxable interest for individuals: $530 (reported on 36.4% of returns)
This zip code:
$530
Minnesota:
$1,814
(% of AGI for various income ranges: 12.8% for AGIs below $25k, 19.5% for AGIs $25k-50k, 23.3% for AGIs $50k-75k, 36.7% for AGIs $75k-100k, 38.2% for AGIs $100k-200k)
Ordinary dividends: $1,905 (reported on 17.4% of returns)
Here:
$1,905
State:
$6,928
(% of AGI for various income ranges: 17.8% for AGIs below $25k, 14.7% for AGIs $25k-50k, 20.0% for AGIs $50k-75k, 60.0% for AGIs $75k-100k, 108.2% for AGIs $100k-200k)
Net capital gain/loss in AGI: +$17,845 (reported on 18.2% of returns)
Here:
+$17,845
State:
+$20,591
(% of AGI for various income ranges: 4.4% for AGIs below $25k, 48.4% for AGIs $25k-50k, 86.0% for AGIs $50k-75k, 40.0% for AGIs $75k-100k, 384.1% for AGIs $100k-200k)
Profit/loss from business: +$11,968 (reported on 15.7% of returns)
Here:
+$11,968
State:
+$14,342
(% of AGI for various income ranges: 132.8% for AGIs below $25k, 173.2% for AGIs $25k-50k, 640.7% for AGIs $50k-75k, 438.2% for AGIs $100k-200k)
Taxable individual retirement arrangement distribution: $15,370 (reported on 8.3% of returns)
56547:
$15,370
Minnesota:
$20,675
(% of AGI for various income ranges: 145.3% for AGIs $25k-50k, 451.3% for AGIs $50k-75k, 343.5% for AGIs $100k-200k)
Total itemized deductions: $28,500 (reported on 6.6% of returns)
Here:
$28,500
State:
$33,311
(% of AGI for various income ranges: 549.3% for AGIs $50k-75k, 856.5% for AGIs $100k-200k)
Charity contributions: $8,025 (reported on 3.3% of returns)
Here:
$8,025
State:
$11,879
(% of AGI for various income ranges: 188.8% for AGIs $100k-200k)
Taxes paid: $7,462 (reported on 6.6% of returns)
56547:
$7,462
State:
$8,252
(% of AGI for various income ranges: 101.3% for AGIs $50k-75k, 148.2% for AGIs $100k-200k)
Earned income credit: $2,418 (reported on 9.1% of returns)
Here:
$2,418
State:
$2,055
(% of AGI for various income ranges: 80.6% for AGIs below $25k, 63.7% for AGIs $25k-50k)
Percentage of individuals using paid preparers for their 2020 taxes: 95.9%
Here:
96%
State:
94%
(% for various income ranges: 92.9% for AGIs below $25k, 96.0% for AGIs $25k-50k, 95.2% for AGIs $50k-75k, 100.0% for AGIs $75k-100k, 96.4% for AGIs $100k-200k, 100.0% for AGIs over 200k)
Averages for the 2012 tax year for zip code 56547, filed in 2013:
Average Adjusted Gross Income (AGI) in 2012: $62,480 (Individual Income Tax Returns)
Here:
$62,480
State:
$67,192
Salary/wage: $50,258 (reported on 89.4% of returns)
Here:
$50,258
State:
$55,182
(% of AGI for various income ranges: 81.8% for AGIs below $25k, 78.8% for AGIs $25k-50k, 81.1% for AGIs $50k-75k, 80.8% for AGIs $75k-100k, 74.6% for AGIs $100k-200k, 39.6% for AGIs over 200k)
Taxable interest for individuals: $798 (reported on 35.8% of returns)
This zip code:
$798
Minnesota:
$1,664
(% of AGI for various income ranges: 0.9% for AGIs below $25k, 0.3% for AGIs $25k-50k, 0.2% for AGIs $50k-75k, 0.4% for AGIs $75k-100k, 0.4% for AGIs $100k-200k, 0.8% for AGIs over 200k)
Ordinary dividends: $1,375 (reported on 16.3% of returns)
Here:
$1,375
State:
$5,665
(% of AGI for various income ranges: 0.8% for AGIs below $25k, 0.3% for AGIs $25k-50k, 0.4% for AGIs $50k-75k, 0.3% for AGIs $75k-100k, 0.3% for AGIs $100k-200k, 0.4% for AGIs over 200k)
Net capital gain/loss in AGI: +$6,529 (reported on 13.8% of returns)
Here:
+$6,529
State:
+$16,131
(% of AGI for various income ranges: 0.5% for AGIs below $25k, 0.4% for AGIs $50k-75k, 1.9% for AGIs $100k-200k, 4.6% for AGIs over 200k)
Profit/loss from business: +$9,211 (reported on 15.4% of returns)
Here:
+$9,211
State:
+$12,430
(% of AGI for various income ranges: 7.0% for AGIs below $25k, 4.8% for AGIs $25k-50k, 2.1% for AGIs $50k-75k, 1.9% for AGIs $75k-100k, 1.9% for AGIs $100k-200k)
Taxable individual retirement arrangement distribution: $11,310 (reported on 8.1% of returns)
56547:
$11,310
Minnesota:
$15,212
(% of AGI for various income ranges: 2.3% for AGIs $25k-50k, 2.0% for AGIs $75k-100k, 2.6% for AGIs $100k-200k)
Total itemized deductions: $20,175 (18% of AGI, reported on 35.8% of returns)
Here:
$20,175
State:
$24,665
Here:
18.2% of AGI
State:
19.6% of AGI
(% of AGI for various income ranges: 11.1% for AGIs $25k-50k, 10.4% for AGIs $50k-75k, 12.6% for AGIs $75k-100k, 13.1% for AGIs $100k-200k, 13.3% for AGIs over 200k)
Charity contributions: $3,165 (reported on 30.1% of returns)
Here:
$3,165
State:
$3,948
(% of AGI for various income ranges: 1.1% for AGIs $25k-50k, 1.0% for AGIs $50k-75k, 1.4% for AGIs $75k-100k, 1.7% for AGIs $100k-200k, 2.6% for AGIs over 200k)
Taxes paid: $9,036 (reported on 35.8% of returns)
56547:
$9,036
State:
$10,589
(% of AGI for various income ranges: 3.2% for AGIs $25k-50k, 3.1% for AGIs $50k-75k, 5.0% for AGIs $75k-100k, 6.4% for AGIs $100k-200k, 8.2% for AGIs over 200k)
Earned income credit: $2,173 (reported on 12.2% of returns)
Here:
$2,173
State:
$2,037
(% of AGI for various income ranges: 5.0% for AGIs below $25k, 0.9% for AGIs $25k-50k)
Percentage of individuals using paid preparers for their 2012 taxes: 59.3%
Here:
59%
State:
55%
(% for various income ranges: 50.0% for AGIs below $25k, 58.3% for AGIs $25k-50k, 52.6% for AGIs $50k-75k, 62.5% for AGIs $75k-100k, 75.0% for AGIs $100k-200k, 100.0% for AGIs over 200k)
Averages for the 2004 tax year for zip code 56547, filed in 2005:
Average Adjusted Gross Income (AGI) in 2004: $43,139 (Individual Income Tax Returns)
Here:
$43,139
State:
$53,560
Salary/wage: $37,539 (reported on 88.8% of returns)
Here:
$37,539
State:
$46,177
(% of AGI for various income ranges: 140.2% for AGIs below $10k, 77.2% for AGIs $10k-25k, 80.2% for AGIs $25k-50k, 83.9% for AGIs $50k-75k, 82.0% for AGIs $75k-100k, 56.8% for AGIs over 100k)
Taxable interest for individuals: $829 (reported on 42.2% of returns)
This zip code:
$829
Minnesota:
$1,796
(% of AGI for various income ranges: 1.5% for AGIs below $10k, 2.2% for AGIs $10k-25k, 0.8% for AGIs $25k-50k, 0.5% for AGIs $50k-75k, 0.4% for AGIs $75k-100k, 1.0% for AGIs over 100k)
Taxable dividends: $783 (reported on 20.3% of returns)
Here:
$783
State:
$3,096
(% of AGI for various income ranges: 1.6% for AGIs below $10k, 0.7% for AGIs $10k-25k, 0.3% for AGIs $25k-50k, 0.2% for AGIs $50k-75k, 0.4% for AGIs $75k-100k, 0.4% for AGIs over 100k)
Net capital gain/loss: +$4,681 (reported on 17.8% of returns)
Here:
+$4,681
State:
+$10,864
(% of AGI for various income ranges: -4.1% for AGIs below $10k, 0.5% for AGIs $10k-25k, 0.2% for AGIs $25k-50k, 1.1% for AGIs $50k-75k, 1.8% for AGIs $75k-100k, 5.8% for AGIs over 100k)
Profit/loss from business: +$8,168 (reported on 16.9% of returns)
Here:
+$8,168
State:
+$10,442
(% of AGI for various income ranges: 5.0% for AGIs below $10k, 5.3% for AGIs $10k-25k, 5.7% for AGIs $25k-50k, 3.1% for AGIs $50k-75k, 2.3% for AGIs $75k-100k, 0.9% for AGIs over 100k)
IRA payment deduction: $3,235 (reported on 2.9% of returns)
56547:
$3,235
Minnesota:
$2,955
Total itemized deductions: $14,665 (20% of AGI, reported on 34.7% of returns)
Here:
$14,665
State:
$20,035
Here:
20.3% of AGI
State:
21.3% of AGI
(% of AGI for various income ranges: 7.8% for AGIs $10k-25k, 11.4% for AGIs $25k-50k, 11.8% for AGIs $50k-75k, 14.4% for AGIs $75k-100k, 12.1% for AGIs over 100k)
Charity contributions deductions: $2,167 (3% of AGI, reported on 30.5% of returns)
Here:
$2,167
State:
$3,333
Here:
2.9% of AGI
State:
3.4% of AGI
(% of AGI for various income ranges: 0.9% for AGIs $10k-25k, 1.1% for AGIs $25k-50k, 1.3% for AGIs $50k-75k, 2.0% for AGIs $75k-100k, 2.2% for AGIs over 100k)
Total tax: $5,161 (reported on 79.2% of returns)
56547:
$5,161
State:
$8,485
(% of AGI for various income ranges: 3.8% for AGIs below $10k, 5.0% for AGIs $10k-25k, 7.4% for AGIs $25k-50k, 7.7% for AGIs $50k-75k, 9.8% for AGIs $75k-100k, 15.6% for AGIs over 100k)
Earned income credit: $1,621 (reported on 11.4% of returns)
Here:
$1,621
State:
$1,523
Percentage of individuals using paid preparers for their 2004 taxes: 63.1%
Here:
63%
State:
59%
(% for various income ranges: 50.2% for AGIs below $10k, 59.1% for AGIs $10k-25k, 74.9% for AGIs $25k-50k, 61.8% for AGIs $50k-75k, 65.6% for AGIs $75k-100k, 74.3% for AGIs over 100k)
Likely homosexual households (counted as self-reported same-sex unmarried-partner households)
Lesbian couples: 0.2% of all households
Gay men: 0.2% of all households
Household received Food Stamps/SNAP in the past 12 months: 33 Household did not receive Food Stamps/SNAP in the past 12 months: 938
Women who had a birth in the past 12 months: 30 (29 now married, 0 unmarried) Women who did not have a birth in the past 12 months: 579 (286 now married, 293 unmarried)
Housing units in zip code 56547 with a mortgage: 465 (38 second mortgage, 34 both second mortgage and home equity loan) Houses without a mortgage: 1
Median monthly owner costs for units with a mortgage: $1,907 Median monthly owner costs for units without a mortgage: $655
Residents with income below the poverty level in 2022:
This zip code:
7.8%
Whole state:
9.6%
Residents with income below 50% of the poverty level in 2022:
This zip code:
3.7%
Whole state:
5.2%
Median number of rooms in houses and condos:
Here:
7.6
State:
7.1
Median number of rooms in apartments:
Here:
5.3
State:
3.8
Notable locations in this zip code not listed on our city pages
Notable locations in zip code 56547: Buffalo River Speedway (A), Glyndon (B), Glyndon Volunteer Fire Department (C), Glyndon Police Department (D). Display/hide their locations on the map
Churches in zip code 56547 include: Concordia Church (A), Maranatha Free Lutheran Church (B), Scandia Lutheran Church (C), Glyndon Lutheran Church (D), Glyndon Congregational Church (E). Display/hide their locations on the map
691 married couples with children.
89 single-parent households (35 men, 54 women).
96.2% of residents of 56547 zip code speak English at home.
1.1% of residents speak Spanish at home (93% very well, 7% well).
0.6% of residents speak other Indo-European language at home (94% very well, 6% well).
1.8% of residents speak Asian or Pacific Island language at home (100% very well).
Foreign born population: 18 (0.7%) (89.4% of them are naturalized citizens)
This zip code:
0.7%
Whole state:
8.7%
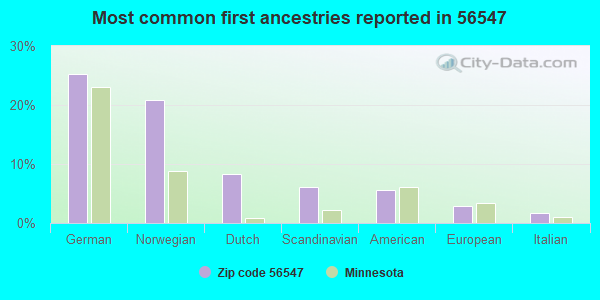
28%Honduras
17%France
25%German
21%Norwegian
8%Dutch
6%Scandinavian
6%American
3%European
2%Italian
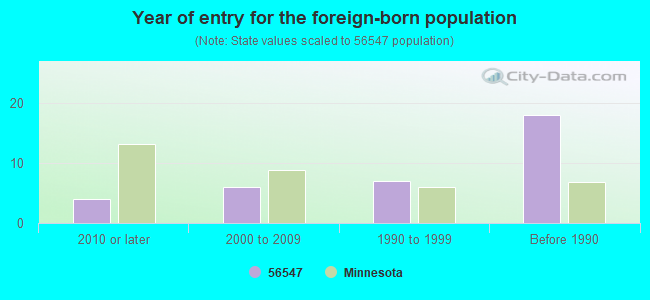
Year of entry for the foreign-born population
42010 or later
62000 to 2009
71990 to 1999
18Before 1990
Facilities with environmental interests located in this zip code:
GLYNDON WWTP (216 PARTRIDGE AVE S in GLYNDON, MN)
STATE MASTER (Minnesota Pollution Control Agency permits and compilance tracking) - PCS-MN0020630, NPDES NON-MAJOR National Pollutant Discharge Elimination System NON-MAJOR (Tracking pollutant discharge elimination systems) - permit COMMUNITY WATER SYSTEM (SDWIS) - SDWIS-MN1140005 3, WATER TREATMENT PLANT Business SIC classification: SEWERAGE SYSTEMS Business NAICS classification: SEWAGE TREATMENT FACILITIES. Organizations: GLYNDON CITY OF (CONTACT/OWNER)
FUCHS SANITATION SERVICE INC (209 LUND AVE SE in GLYNDON, MN)
STATE MASTER (Minnesota Pollution Control Agency permits and compilance tracking) - RCRAINFO-MNR000001032, HAZARDOUS WASTE PROGRAM, RCRIS-MNR000001032, Small Quantity Generators, between 100 kg and 1000 kg of hazardous waste/month (Resource Conservation and Recovery Act (tracking hazardous waste)) - notification TRANSPORTER (Resource Conservation and Recovery Act (tracking hazardous waste)) - notification USED OIL PROGRAM (Resource Conservation and Recovery Act (tracking hazardous waste)) Business SIC classification: LOCAL TRUCKING WITHOUT STORAGE Business NAICS classification: GENERAL FREIGHT TRUCKING, LOCAL. Organizations: FUCHS GEORGE W & PATRICIA L (CONTACT/OWNER)
AGGREGATE INDUSTRIES (1/2 MI E OF HWY 9 ON HWY 10 in GLYNDON, MN)
STATE MASTER (Minnesota Pollution Control Agency permits and compilance tracking) - RCRAINFO-MNR000016923, CESQG, AFS-2702700068, AIR SYNTHETIC MINOR Conditionally Exempt Small Quantity Generators, less than 100 kg/month of hazardous waste (Resource Conservation and Recovery Act (tracking hazardous waste)) Business SIC and NAICS classification: CONSTRUCTION SAND AND GRAVEL Organizations: AGGREGATE INDUSTRIES INC (CONTACT/OWNER)
Alternative names: AGGREGATE INDUSTRIES - GLYNDON
GLYNDON (CITY HALL in GLYNDON, MN)
National Pollutant Discharge Elimination System NON-MAJOR (Tracking pollutant discharge elimination systems) - permit Business SIC classification: SEWERAGE SYSTEMS
GLYNDON GARAGE (HWY 10 BOX 212 in GLYNDON, MN)
Small Quantity Generators, between 100 kg and 1000 kg of hazardous waste/month (Resource Conservation and Recovery Act (tracking hazardous waste)) - notification Organizations: BERG KEITH (CONTACT/OWNER)
Housing units lacking complete plumbing facilities: 1.7% Housing units lacking complete kitchen facilities: 0.8%
34.1%Utility gas
32.4%Bottled, tank, or LP gas
25.4%Electricity
3.6%Fuel oil, kerosene, etc.
3.6%Wood
0.7%No fuel used
Population in 1990: 2,198. Population change in the 1990s: +208 (+9.5%).
Place of birth for U.S.-born residents:
This state: 1,051
Northeast: 17
Midwest: 1,584
South: 24
West: 133
70% of the 56547 zip code residents lived in the same house 5 years ago. Out of people who lived in different houses, 57% lived in this county. Out of people who lived in different counties, 50% lived in Minnesota.
92% of the 56547 zip code residents lived in the same house 1 year ago. Out of people who lived in different houses, 62% moved from this county. Out of people who lived in different houses, 3% moved from different county within same state. Out of people who lived in different houses, 37% moved from different state.
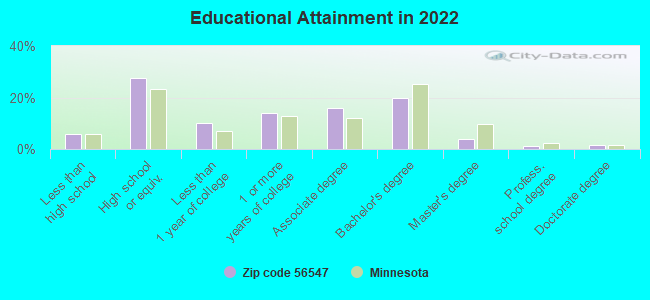
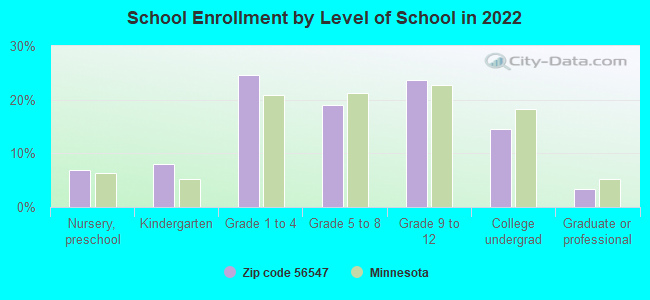
Private vs. public school enrollment:
Students in private schools in grades 1 to 8 (elementary and middle school): 79
Here:
25.1%
Minnesota:
12.9%
Students in private schools in grades 9 to 12 (high school): 67
Here:
39.0%
Minnesota:
8.6%
Students in private undergraduate colleges: 1
Here:
1.9%
Minnesota:
26.2%
Occupation by median earnings in the past 12 months ($)
84,076Management occupations
82,944Computer and mathematical occupations
73,785Transportation occupations
71,942Installation, maintenance, and repair occupations
71,241Law enforcement workers including supervisors
62,217Architecture and engineering occupations
Companies with federal contracts located in this zip code:
DAVES SPRAY SERVICE (13868 12TH AVENUE SOUTH in GLYNDON, MN; small business) : $55,374 in 6 contractsfrom 2003 to 2006
Contracts for Landscaping/Groundskeeping Services by Army Signed by year:2000: $0; 2001: $0; 2002: $0; 2003: $15,084; 2004: $15,617; 2005: $32,514; 2006: -$7,841.
Biggest contracts:
$16,257 with Army for Landscaping/Groundskeeping Services. Signed on 2005-10-03. Completion date: 2003-05-12.
$16,257, same as above.Signed on 2005-10-26. Completion date: 2003-05-12.
$15,617, same as above.Signed on 2004-10-05. Completion date: 2003-05-12.
$15,084, same as above.Signed on 2003-10-03. Completion date: 2003-05-12.
Top industries in this zip code by the number of employees in 2005:
Administrative and Support and Waste Management and Remediation Services: Landscaping Services (10-19 employees: 1 establishment, 1-4 employees: 1 establishment)
Accommodation and Food Services: Full-Service Restaurants (5-9: 2, 1-4: 1)
Construction: Electrical Contractors (10-19: 1)
Administrative and Support and Waste Management and Remediation Services: Solid Waste Collection (10-19: 1)
Other Services (except Public Administration): Religious Organizations (5-9: 1, 1-4: 2)
Construction: New Single-Family Housing Construction (except Operative Builders) (5-9: 1, 1-4: 1)
Wholesale Trade: Grain and Field Bean Merchant Wholesalers (5-9: 1, 1-4: 1)
Wholesale Trade: Fresh Fruit and Vegetable Merchant Wholesalers (5-9: 1)
Fatal accident statistics in 2012:
Fatal accident count: 2
Vehicles involved in fatal accidents: 3
Fatal accidents caused by drunken drivers: 0
Fatalities: 2
Persons involved in fatal accidents: 5
Pedestrians involved in fatal accidents: 0
Fatal accident statistics in 2010:
Fatal accident count: 1
Vehicles involved in fatal accidents: 2
Fatal accidents caused by drunken drivers: 0
Fatalities: 2
Persons involved in fatal accidents: 5
Pedestrians involved in fatal accidents: 0
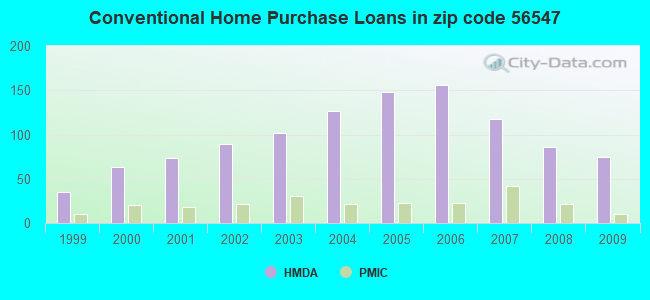
Home Mortgage Disclosure Act Aggregated Statistics For Year 2009 (Based on 8 partial tracts)
A) FHA, FSA/RHS & VA Home Purchase Loans
B) Conventional Home Purchase Loans
C) Refinancings
D) Home Improvement Loans
F) Non-occupant Loans on < 5 Family Dwellings (A B C & D)
G) Loans On Manufactured Home Dwelling (A B C & D)
Number
Average Value
Number
Average Value
Number
Average Value
Number
Average Value
Number
Average Value
Number
Average Value
LOANS ORIGINATED
67
$143,779
75
$129,734
266
$143,411
32
$42,884
10
$98,414
6
$35,347
APPLICATIONS APPROVED, NOT ACCEPTED
1
$126,880
5
$133,512
14
$151,401
2
$29,445
0
$0
0
$0
APPLICATIONS DENIED
8
$124,618
10
$120,488
43
$142,744
10
$35,407
1
$148,350
4
$63,515
APPLICATIONS WITHDRAWN
3
$168,737
10
$133,290
44
$156,327
3
$51,653
1
$66,170
0
$0
FILES CLOSED FOR INCOMPLETENESS
0
$0
1
$220,580
8
$154,261
0
$0
0
$0
0
$0
Aggregated Statistics For Year 2008 (Based on 8 partial tracts)
A) FHA, FSA/RHS & VA Home Purchase Loans
B) Conventional Home Purchase Loans
C) Refinancings
D) Home Improvement Loans
E) Loans on Dwellings For 5+ Families
F) Non-occupant Loans on < 5 Family Dwellings (A B C & D)
G) Loans On Manufactured Home Dwelling (A B C & D)
Number
Average Value
Number
Average Value
Number
Average Value
Number
Average Value
Number
Average Value
Number
Average Value
Number
Average Value
LOANS ORIGINATED
42
$145,881
86
$149,258
114
$120,584
38
$34,493
3
$895,490
11
$117,322
4
$44,065
APPLICATIONS APPROVED, NOT ACCEPTED
2
$127,820
7
$146,661
10
$128,633
2
$44,675
0
$0
1
$98,770
1
$31,240
APPLICATIONS DENIED
3
$152,717
10
$112,045
44
$139,106
7
$32,256
0
$0
2
$52,900
3
$74,177
APPLICATIONS WITHDRAWN
1
$102,430
6
$145,842
27
$171,095
3
$59,633
0
$0
1
$156,460
1
$48,820
FILES CLOSED FOR INCOMPLETENESS
0
$0
1
$64,990
6
$191,910
0
$0
0
$0
0
$0
0
$0
Aggregated Statistics For Year 2007 (Based on 8 partial tracts)
A) FHA, FSA/RHS & VA Home Purchase Loans
B) Conventional Home Purchase Loans
C) Refinancings
D) Home Improvement Loans
E) Loans on Dwellings For 5+ Families
F) Non-occupant Loans on < 5 Family Dwellings (A B C & D)
G) Loans On Manufactured Home Dwelling (A B C & D)
Number
Average Value
Number
Average Value
Number
Average Value
Number
Average Value
Number
Average Value
Number
Average Value
Number
Average Value
LOANS ORIGINATED
22
$136,366
118
$130,120
97
$99,189
35
$28,826
2
$1,041,060
9
$70,137
8
$50,529
APPLICATIONS APPROVED, NOT ACCEPTED
0
$0
13
$137,201
16
$102,540
6
$46,187
0
$0
2
$122,930
2
$69,605
APPLICATIONS DENIED
2
$160,020
14
$112,784
48
$119,817
13
$34,234
0
$0
3
$58,723
3
$44,367
APPLICATIONS WITHDRAWN
2
$142,675
11
$139,347
29
$140,587
2
$111,995
0
$0
2
$116,730
0
$0
FILES CLOSED FOR INCOMPLETENESS
0
$0
3
$91,070
12
$128,405
2
$59,005
0
$0
1
$107,740
0
$0
Aggregated Statistics For Year 2006 (Based on 8 partial tracts)
A) FHA, FSA/RHS & VA Home Purchase Loans
B) Conventional Home Purchase Loans
C) Refinancings
D) Home Improvement Loans
E) Loans on Dwellings For 5+ Families
F) Non-occupant Loans on < 5 Family Dwellings (A B C & D)
G) Loans On Manufactured Home Dwelling (A B C & D)
Number
Average Value
Number
Average Value
Number
Average Value
Number
Average Value
Number
Average Value
Number
Average Value
Number
Average Value
LOANS ORIGINATED
24
$129,084
156
$103,732
120
$95,812
38
$38,936
1
$2,575,650
22
$87,274
8
$47,846
APPLICATIONS APPROVED, NOT ACCEPTED
0
$0
11
$98,678
20
$92,282
4
$50,600
0
$0
2
$79,590
0
$0
APPLICATIONS DENIED
1
$117,260
23
$88,418
61
$114,473
16
$39,712
0
$0
2
$85,605
6
$40,993
APPLICATIONS WITHDRAWN
2
$98,350
19
$124,593
47
$131,818
4
$97,470
0
$0
1
$130,080
1
$50,100
FILES CLOSED FOR INCOMPLETENESS
0
$0
3
$128,357
14
$117,139
1
$101,590
0
$0
0
$0
0
$0
Aggregated Statistics For Year 2005 (Based on 8 partial tracts)
A) FHA, FSA/RHS & VA Home Purchase Loans
B) Conventional Home Purchase Loans
C) Refinancings
D) Home Improvement Loans
E) Loans on Dwellings For 5+ Families
F) Non-occupant Loans on < 5 Family Dwellings (A B C & D)
G) Loans On Manufactured Home Dwelling (A B C & D)
Number
Average Value
Number
Average Value
Number
Average Value
Number
Average Value
Number
Average Value
Number
Average Value
Number
Average Value
LOANS ORIGINATED
22
$116,554
148
$109,048
130
$103,840
36
$34,996
2
$609,410
25
$99,524
5
$54,672
APPLICATIONS APPROVED, NOT ACCEPTED
0
$0
11
$122,905
15
$89,129
3
$63,570
0
$0
5
$96,778
0
$0
APPLICATIONS DENIED
2
$135,765
16
$103,074
55
$106,241
17
$50,297
0
$0
3
$107,977
3
$34,413
APPLICATIONS WITHDRAWN
1
$101,920
16
$102,440
43
$131,386
6
$128,730
0
$0
4
$119,600
2
$80,610
FILES CLOSED FOR INCOMPLETENESS
0
$0
7
$91,093
28
$127,748
2
$52,310
0
$0
0
$0
1
$89,220
Aggregated Statistics For Year 2004 (Based on 8 partial tracts)
A) FHA, FSA/RHS & VA Home Purchase Loans
B) Conventional Home Purchase Loans
C) Refinancings
D) Home Improvement Loans
E) Loans on Dwellings For 5+ Families
F) Non-occupant Loans on < 5 Family Dwellings (A B C & D)
G) Loans On Manufactured Home Dwelling (A B C & D)
Number
Average Value
Number
Average Value
Number
Average Value
Number
Average Value
Number
Average Value
Number
Average Value
Number
Average Value
LOANS ORIGINATED
22
$111,442
126
$107,705
152
$90,958
43
$31,038
4
$654,090
14
$82,681
8
$35,414
APPLICATIONS APPROVED, NOT ACCEPTED
1
$38,390
8
$96,054
9
$105,720
1
$31,190
0
$0
1
$40,120
0
$0
APPLICATIONS DENIED
0
$0
18
$91,713
47
$94,461
13
$26,468
0
$0
3
$114,940
8
$49,974
APPLICATIONS WITHDRAWN
1
$202,830
11
$107,311
40
$115,180
5
$45,368
0
$0
1
$109,980
2
$122,045
FILES CLOSED FOR INCOMPLETENESS
0
$0
2
$127,580
28
$110,290
1
$65,770
0
$0
0
$0
1
$97,030
Aggregated Statistics For Year 2003 (Based on 8 partial tracts)
A) FHA, FSA/RHS & VA Home Purchase Loans
B) Conventional Home Purchase Loans
C) Refinancings
D) Home Improvement Loans
F) Non-occupant Loans on < 5 Family Dwellings (A B C & D)
Number
Average Value
Number
Average Value
Number
Average Value
Number
Average Value
Number
Average Value
LOANS ORIGINATED
29
$103,938
102
$100,809
351
$96,627
25
$26,037
10
$87,633
APPLICATIONS APPROVED, NOT ACCEPTED
0
$0
5
$91,740
24
$86,793
3
$24,953
2
$85,910
APPLICATIONS DENIED
2
$95,505
15
$87,095
84
$93,550
9
$19,669
1
$16,880
APPLICATIONS WITHDRAWN
2
$79,240
11
$125,447
47
$90,359
1
$23,270
1
$107,890
FILES CLOSED FOR INCOMPLETENESS
0
$0
2
$109,465
4
$129,923
1
$42,270
0
$0
Aggregated Statistics For Year 2002 (Based on 6 partial tracts)
A) FHA, FSA/RHS & VA Home Purchase Loans
B) Conventional Home Purchase Loans
C) Refinancings
D) Home Improvement Loans
E) Loans on Dwellings For 5+ Families
F) Non-occupant Loans on < 5 Family Dwellings (A B C & D)
Number
Average Value
Number
Average Value
Number
Average Value
Number
Average Value
Number
Average Value
Number
Average Value
LOANS ORIGINATED
25
$90,121
89
$88,428
222
$90,439
26
$20,242
1
$71,550
6
$68,347
APPLICATIONS APPROVED, NOT ACCEPTED
0
$0
6
$60,495
25
$71,464
3
$17,797
0
$0
2
$51,455
APPLICATIONS DENIED
1
$97,630
10
$58,702
36
$80,042
5
$30,660
0
$0
1
$89,310
APPLICATIONS WITHDRAWN
1
$147,640
4
$107,938
17
$89,722
1
$25,210
0
$0
0
$0
FILES CLOSED FOR INCOMPLETENESS
0
$0
0
$0
20
$96,250
0
$0
0
$0
0
$0
Aggregated Statistics For Year 2001 (Based on 6 partial tracts)
A) FHA, FSA/RHS & VA Home Purchase Loans
B) Conventional Home Purchase Loans
C) Refinancings
D) Home Improvement Loans
F) Non-occupant Loans on < 5 Family Dwellings (A B C & D)
Number
Average Value
Number
Average Value
Number
Average Value
Number
Average Value
Number
Average Value
LOANS ORIGINATED
32
$82,910
74
$87,984
177
$77,699
20
$20,516
3
$49,170
APPLICATIONS APPROVED, NOT ACCEPTED
1
$63,710
3
$99,603
13
$67,282
2
$21,410
0
$0
APPLICATIONS DENIED
1
$35,390
16
$54,194
41
$77,186
6
$25,245
0
$0
APPLICATIONS WITHDRAWN
3
$72,053
5
$88,422
20
$70,903
1
$21,550
1
$28,350
FILES CLOSED FOR INCOMPLETENESS
0
$0
1
$76,460
6
$92,132
1
$23,580
0
$0
Aggregated Statistics For Year 2000 (Based on 6 partial tracts)
A) FHA, FSA/RHS & VA Home Purchase Loans
B) Conventional Home Purchase Loans
C) Refinancings
D) Home Improvement Loans
F) Non-occupant Loans on < 5 Family Dwellings (A B C & D)
Number
Average Value
Number
Average Value
Number
Average Value
Number
Average Value
Number
Average Value
LOANS ORIGINATED
21
$77,375
63
$76,815
60
$59,473
31
$13,301
2
$48,115
APPLICATIONS APPROVED, NOT ACCEPTED
1
$35,950
6
$72,520
10
$64,481
2
$16,495
1
$40,540
APPLICATIONS DENIED
2
$90,185
18
$38,382
26
$52,813
8
$14,255
2
$44,200
APPLICATIONS WITHDRAWN
2
$69,355
5
$86,932
14
$54,196
3
$37,213
0
$0
FILES CLOSED FOR INCOMPLETENESS
0
$0
1
$40,930
7
$67,314
0
$0
0
$0
Aggregated Statistics For Year 1999 (Based on 4 partial tracts)
A) FHA, FSA/RHS & VA Home Purchase Loans
B) Conventional Home Purchase Loans
C) Refinancings
D) Home Improvement Loans
E) Loans on Dwellings For 5+ Families
F) Non-occupant Loans on < 5 Family Dwellings (A B C & D)
2002 - 2018 National Fire Incident Reporting System (NFIRS) incidents
Based on the data from the years 2002 - 2018 the average number of fires per year is 17. The highest number of reported fires - 24 took place in 2013, and the least - 10 in 2002. The data has a growing trend.
When looking into fire subcategories, the most incidents belonged to: Outside Fires (52.3%), and Structure Fires (25.6%).
Fire incident types reported to NFIRS in Zip Code 56547

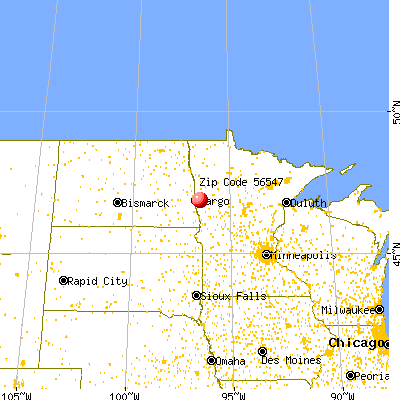


 Nearest zip codes: 56529, 56536, 56580, 56560, 56549, 58105.


 Based on the data from the years 2002 - 2018 the average number of fires per year is 17. The highest number of reported fires - 24 took place in 2013, and the least - 10 in 2002. The data has a growing trend.
 When looking into fire subcategories, the most incidents belonged to: Outside Fires (52.3%), and Structure Fires (25.6%).