Estimated zip code population in 2022: 1,702 Zip code population in 2010: 1,512 Zip code population in 2000: 1,585
Houses and condos: 663 Renter-occupied apartments: 96
% of renters here:
15%
State:
30%
March 2022 cost of living index in zip code 57068: 78.7 (low, U.S. average is 100)
Land area: 44.8 sq. mi. Water area: 0.0 sq. mi.
Population density: 38 people per square mile
(very low).
OSM Map
General Map
Google Map
MSN Map
OSM Map
General Map
Google Map
MSN Map
OSM Map
General Map
Google Map
MSN Map
OSM Map
General Map
Google Map
MSN Map
Please wait while loading the map...
Real estate property taxes paid for housing units in 2022:
This zip code:
1.0% ($2,349)
South Dakota:
1.0% ($2,481)
Median real estate property taxes paid for housing units with mortgages in 2022: $2,100 (1.0%) Median real estate property taxes paid for housing units with no mortgage in 2022: $3,001 (1.0%)
Business Search- 14 Million verified businesses
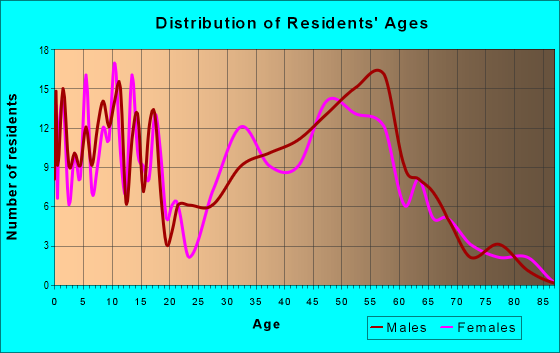
Males: 962
(56.5%)
Females: 740
(43.5%)
For population 25 years and over in 57068:
High school or higher: 97.0%
Bachelor's degree or higher: 24.0%
Graduate or professional degree: 7.4%
Unemployed: 2.8%
Mean travel time to work (commute): 24.3 minutes
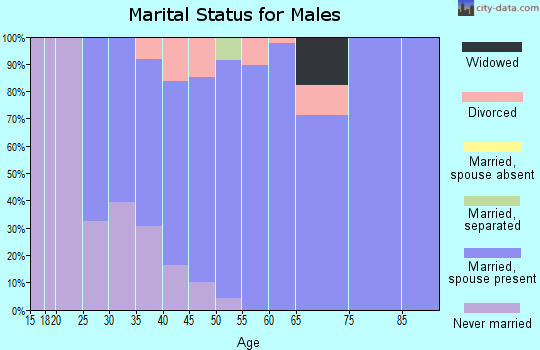
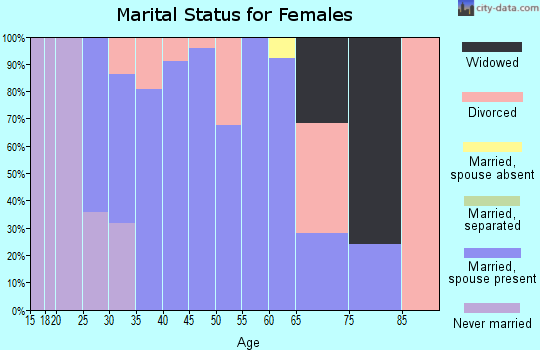
For population 15 years and over in 57068:
Never married: 18.4%
Now married: 55.3%
Separated: 0.7%
Widowed: 5.8%
Divorced: 19.8%
Zip code 57068 compared to state average:
Median household income above state average.
Black race population percentage significantly below state average.
Hispanic race population percentage significantly below state average.
Median age significantly above state average.
Foreign-born population percentage significantly below state average.
Renting percentage below state average.
Length of stay since moving in significantly above state average.
Estimated median house/condo value in 2022: $243,214
57068:
$243,214
South Dakota:
$245,000
According to our research of South Dakota and other state lists, there were 2 registered sex offenders living in 57068 zip code as of April 26, 2024. The ratio of all residents to sex offenders in zip code 57068 is 691 to 1. The ratio of registered sex offenders to all residents in this zip code is much lower than the state average.
Median resident age:
This zip code:
48.4 years
South Dakota median age:
38.5 years
Average household size:
This zip code:
2.7 people
South Dakota:
2.4 people
Averages for the 2020 tax year for zip code 57068, filed in 2021:
Average Adjusted Gross Income (AGI) in 2020: $84,559 (Individual Income Tax Returns)
Here:
$84,559
State:
$75,230
Salary/wage: $63,001 (reported on 87.2% of returns)
Here:
$63,001
State:
$54,824
(% of AGI for various income ranges: 1289.3% for AGIs below $25k, 3827.9% for AGIs $25k-50k, 7127.5% for AGIs $50k-75k, 11081.7% for AGIs $75k-100k, 15391.0% for AGIs $100k-200k)
Taxable interest for individuals: $2,283 (reported on 38.5% of returns)
This zip code:
$2,283
South Dakota:
$2,207
(% of AGI for various income ranges: 5.0% for AGIs below $25k, 15.7% for AGIs $25k-50k, 18.8% for AGIs $50k-75k, 96.7% for AGIs $75k-100k, 45.0% for AGIs $100k-200k)
Ordinary dividends: $2,494 (reported on 20.5% of returns)
Here:
$2,494
State:
$6,303
(% of AGI for various income ranges: 29.3% for AGIs $25k-50k, 46.2% for AGIs $50k-75k, 85.0% for AGIs $75k-100k, 88.0% for AGIs $100k-200k)
Net capital gain/loss in AGI: +$15,725 (reported on 20.5% of returns)
Here:
+$15,725
State:
+$27,098
(% of AGI for various income ranges: 82.9% for AGIs $25k-50k, 67.5% for AGIs $50k-75k, 235.0% for AGIs $75k-100k, 383.0% for AGIs $100k-200k)
Profit/loss from business: +$12,131 (reported on 16.7% of returns)
Here:
+$12,131
State:
+$13,092
(% of AGI for various income ranges: 209.3% for AGIs $25k-50k, 370.0% for AGIs $50k-75k, 820.0% for AGIs $75k-100k, 496.0% for AGIs $100k-200k)
Taxable individual retirement arrangement distribution: $13,740 (reported on 6.4% of returns)
57068:
$13,740
South Dakota:
$17,605
(% of AGI for various income ranges: 300.7% for AGIs $25k-50k, 266.0% for AGIs $100k-200k)
Total itemized deductions: $39,300 (reported on 5.1% of returns)
Here:
$39,300
State:
$43,941
(% of AGI for various income ranges: 1572.0% for AGIs $100k-200k)
Charity contributions: $10,500 (reported on 3.8% of returns)
Here:
$10,500
State:
$21,682
(% of AGI for various income ranges: 315.0% for AGIs $100k-200k)
Taxes paid: $6,575 (reported on 5.1% of returns)
57068:
$6,575
State:
$6,525
(% of AGI for various income ranges: 263.0% for AGIs $100k-200k)
Earned income credit: $2,275 (reported on 10.3% of returns)
Here:
$2,275
State:
$2,165
(% of AGI for various income ranges: 80.0% for AGIs below $25k, 50.0% for AGIs $25k-50k)
Percentage of individuals using paid preparers for their 2020 taxes: 94.9%
Here:
95%
State:
95%
(% for various income ranges: 94.7% for AGIs below $25k, 100.0% for AGIs $25k-50k, 91.7% for AGIs $50k-75k, 100.0% for AGIs $75k-100k, 93.3% for AGIs $100k-200k, 80.0% for AGIs over 200k)
Averages for the 2012 tax year for zip code 57068, filed in 2013:
Average Adjusted Gross Income (AGI) in 2012: $58,560 (Individual Income Tax Returns)
Here:
$58,560
State:
$58,425
Salary/wage: $46,607 (reported on 87.2% of returns)
Here:
$46,607
State:
$41,676
(% of AGI for various income ranges: 78.5% for AGIs below $25k, 83.5% for AGIs $25k-50k, 72.6% for AGIs $50k-75k, 81.8% for AGIs $75k-100k, 100.8% for AGIs $100k-200k)
Taxable interest for individuals: $1,039 (reported on 35.9% of returns)
This zip code:
$1,039
South Dakota:
$2,148
(% of AGI for various income ranges: 0.4% for AGIs below $25k, 1.2% for AGIs $25k-50k, 0.4% for AGIs $50k-75k, 0.1% for AGIs $75k-100k, 1.5% for AGIs $100k-200k)
Ordinary dividends: $4,411 (reported on 23.1% of returns)
Here:
$4,411
State:
$6,197
(% of AGI for various income ranges: 3.0% for AGIs below $25k, 3.8% for AGIs $25k-50k, 3.1% for AGIs $50k-75k, 0.7% for AGIs $75k-100k, 0.9% for AGIs $100k-200k)
Net capital gain/loss in AGI: +$8,093 (reported on 19.2% of returns)
Here:
+$8,093
State:
+$21,273
(% of AGI for various income ranges: 1.7% for AGIs $25k-50k, 3.1% for AGIs $50k-75k, 7.5% for AGIs $100k-200k)
Profit/loss from business: +$6,071 (reported on 17.9% of returns)
Here:
+$6,071
State:
+$11,552
(% of AGI for various income ranges: 5.4% for AGIs below $25k, 0.5% for AGIs $25k-50k, 5.7% for AGIs $50k-75k, 1.0% for AGIs $100k-200k)
Taxable individual retirement arrangement distribution: $8,117 (reported on 7.7% of returns)
57068:
$8,117
South Dakota:
$12,416
(% of AGI for various income ranges: 5.2% for AGIs below $25k, 3.4% for AGIs $50k-75k)
Total itemized deductions: $20,559 (19% of AGI, reported on 21.8% of returns)
Here:
$20,559
State:
$21,763
Here:
19.5% of AGI
State:
16.0% of AGI
(% of AGI for various income ranges: 11.3% for AGIs $25k-50k, 8.6% for AGIs $50k-75k, 5.2% for AGIs $75k-100k, 14.4% for AGIs $100k-200k)
Charity contributions: $5,054 (reported on 16.7% of returns)
Here:
$5,054
State:
$5,927
(% of AGI for various income ranges: 1.4% for AGIs below $25k, 1.1% for AGIs $50k-75k, 0.7% for AGIs $75k-100k, 4.3% for AGIs $100k-200k)
Taxes paid: $4,419 (reported on 20.5% of returns)
57068:
$4,419
State:
$5,214
(% of AGI for various income ranges: 1.5% for AGIs $25k-50k, 1.8% for AGIs $50k-75k, 1.4% for AGIs $75k-100k, 3.2% for AGIs $100k-200k)
Earned income credit: $2,078 (reported on 11.5% of returns)
Here:
$2,078
State:
$2,081
(% of AGI for various income ranges: 4.1% for AGIs below $25k, 0.9% for AGIs $25k-50k)
Percentage of individuals using paid preparers for their 2012 taxes: 57.7%
Here:
58%
State:
55%
(% for various income ranges: 50.0% for AGIs below $25k, 52.6% for AGIs $25k-50k, 66.7% for AGIs $50k-75k, 50.0% for AGIs $75k-100k, 100.0% for AGIs $100k-200k)
Averages for the 2004 tax year for zip code 57068, filed in 2005:
Average Adjusted Gross Income (AGI) in 2004: $40,803 (Individual Income Tax Returns)
Here:
$40,803
State:
$41,242
Salary/wage: $35,415 (reported on 89.1% of returns)
Here:
$35,415
State:
$32,969
(% of AGI for various income ranges: 151.5% for AGIs below $10k, 84.1% for AGIs $10k-25k, 84.7% for AGIs $25k-50k, 84.8% for AGIs $50k-75k, 80.9% for AGIs $75k-100k, 45.7% for AGIs over 100k)
Taxable interest for individuals: $1,329 (reported on 37.9% of returns)
This zip code:
$1,329
South Dakota:
$2,098
(% of AGI for various income ranges: 6.5% for AGIs below $10k, 1.3% for AGIs $10k-25k, 0.9% for AGIs $25k-50k, 0.7% for AGIs $50k-75k, 1.4% for AGIs $75k-100k, 1.9% for AGIs over 100k)
Taxable dividends: $665 (reported on 22.8% of returns)
Here:
$665
State:
$2,577
(% of AGI for various income ranges: 1.6% for AGIs below $10k, 1.3% for AGIs $10k-25k, 0.3% for AGIs $25k-50k, 0.2% for AGIs $50k-75k, 0.1% for AGIs $75k-100k, 0.4% for AGIs over 100k)
Net capital gain/loss: +$6,401 (reported on 19.7% of returns)
Here:
+$6,401
State:
+$11,418
(% of AGI for various income ranges: 11.6% for AGIs below $10k, 1.0% for AGIs $10k-25k, 1.7% for AGIs $25k-50k, 0.2% for AGIs $50k-75k, 0.9% for AGIs $75k-100k, 11.1% for AGIs over 100k)
Profit/loss from business: +$8,627 (reported on 17.4% of returns)
Here:
+$8,627
State:
+$9,138
(% of AGI for various income ranges: 1.9% for AGIs $10k-25k, 4.7% for AGIs $25k-50k, 5.9% for AGIs $50k-75k, 2.7% for AGIs over 100k)
Profit/loss from farming: +$60 (reported on 8.7% of returns)
Here:
+$60
State:
-$429
(% of AGI for various income ranges: -22.4% for AGIs below $10k, -0.2% for AGIs $10k-25k, -1.0% for AGIs $25k-50k, 2.0% for AGIs $50k-75k)
IRA payment deduction: $3,323 (reported on 4.0% of returns)
57068:
$3,323
South Dakota:
$3,029
Total itemized deductions: $14,817 (22% of AGI, reported on 23.3% of returns)
Here:
$14,817
State:
$17,139
Here:
22.4% of AGI
State:
19.0% of AGI
(% of AGI for various income ranges: 10.3% for AGIs $10k-25k, 7.6% for AGIs $25k-50k, 10.0% for AGIs $50k-75k, 9.7% for AGIs $75k-100k, 6.1% for AGIs over 100k)
Charity contributions deductions: $2,592 (4% of AGI, reported on 19.1% of returns)
Here:
$2,592
State:
$4,114
Here:
3.7% of AGI
State:
4.2% of AGI
(% of AGI for various income ranges: 0.8% for AGIs $10k-25k, 0.6% for AGIs $25k-50k, 1.3% for AGIs $50k-75k, 2.1% for AGIs $75k-100k, 1.4% for AGIs over 100k)
Total tax: $5,351 (reported on 78.6% of returns)
57068:
$5,351
State:
$6,372
(% of AGI for various income ranges: 4.1% for AGIs below $10k, 5.1% for AGIs $10k-25k, 7.0% for AGIs $25k-50k, 8.2% for AGIs $50k-75k, 10.4% for AGIs $75k-100k, 20.0% for AGIs over 100k)
Earned income credit: $1,452 (reported on 10.9% of returns)
Here:
$1,452
State:
$1,607
Percentage of individuals using paid preparers for their 2004 taxes: 59.1%
Here:
59%
State:
63%
(% for various income ranges: 49.1% for AGIs below $10k, 58.8% for AGIs $10k-25k, 61.3% for AGIs $25k-50k, 61.5% for AGIs $50k-75k, 60.0% for AGIs $75k-100k, 81.1% for AGIs over 100k)
Likely homosexual households (counted as self-reported same-sex unmarried-partner households)
Lesbian couples: 0.2% of all households
Gay men: 0.0% of all households
Household received Food Stamps/SNAP in the past 12 months: 21 Household did not receive Food Stamps/SNAP in the past 12 months: 608
Women who had a birth in the past 12 months: 42 (21 now married, 22 unmarried) Women who did not have a birth in the past 12 months: 229 (126 now married, 104 unmarried)
Housing units in zip code 57068 with a mortgage: 339 (26 second mortgage, 19 both second mortgage and home equity loan) Houses without a mortgage: 2
Median monthly owner costs for units with a mortgage: $1,359 Median monthly owner costs for units without a mortgage: $619
Residents with income below the poverty level in 2022:
This zip code:
2.7%
Whole state:
12.5%
Residents with income below 50% of the poverty level in 2022:
This zip code:
2.2%
Whole state:
6.8%
Median number of rooms in houses and condos:
Here:
8.0
State:
7.0
Median number of rooms in apartments:
Here:
7.0
State:
4.1
Notable locations in this zip code not listed on our city pages
Notable locations in zip code 57068: Valley Springs Fire Department (A), Valley Springs City Hall (B), Valley Springs Branch Library (C). Display/hide their locations on the map
Size of family households: 237 2-persons, 71 3-persons, 74 4-persons, 46 5-persons, 24 6-persons, 2 7-or-more-persons
Size of nonfamily households: 78 1-person, 89 2-persons
284 married couples with children.
73 single-parent households (40 men, 33 women).
97.0% of residents of 57068 zip code speak English at home.
0.6% of residents speak Spanish at home (100% very well).
1.0% of residents speak other Indo-European language at home (100% very well).
0.3% of residents speak Asian or Pacific Island language at home (80% very well, 20% well).
Foreign born population: 16 (0.9%) (86.0% of them are naturalized citizens)
This zip code:
0.9%
Whole state:
3.5%
33%Malaysia
27%Serbia
20%Haiti
7%Thailand
57%German
11%Norwegian
8%Dutch
5%American
3%Swedish
3%English
1%European
Year of entry for the foreign-born population
22010 or later
02000 to 2009
11990 to 1999
10Before 1990
Facilities with environmental interests located in this zip code:
VALLEY SPRINGS ELEM (301 VALLEY DR in VALLEY SPRINGS, SD)
(National Center for Education Statistics) - STATE ID-4 Organizations: BRANDON VALLEY SCHOOL DISTRICT 49-2 (SCHOOL DISTRICT)
VALLEY SPRINGS FARMERS CO OP (400 BROADWAY in VALLEY SPRINGS, SD)
(Integrated Compliance Information System) - ICIS-08-1992-0205, FORMAL ENFORCEMENT ACTION COMPLIANCE ACTIVITY (Tracking inspections of insecticide, fungicide, and rodenticide, and toxic substances) Alternative names: VALLEY SPRINGS FARMERS COOP
VALLEY SPRINGS - CITY OF (1/4 MILE NORTHWEST OF CITY in VALLEY SPRINGS, SD)
National Pollutant Discharge Elimination System NON-MAJOR (Tracking pollutant discharge elimination systems) - permit Business SIC classification: SEWERAGE SYSTEMS
PARKER AUTOMOTIVE (1000 EAST CLIFF in VALLEY SPRINGS, SD)
Conditionally Exempt Small Quantity Generators, less than 100 kg/month of hazardous waste (Resource Conservation and Recovery Act (tracking hazardous waste)) - notification Organizations: GARY PARKER (CONTACT/OWNER)
TJ'S OIL SERVICE LTD (INDUSTRIAL PARK in VALLEY SPRINGS, SD)
USED OIL PROGRAM (Resource Conservation and Recovery Act (tracking hazardous waste)) Organizations: TERRY HESSMAN (CONTACT/OWNER)
47.4%Utility gas
33.2%Bottled, tank, or LP gas
17.4%Electricity
0.8%No fuel used
0.7%Wood
0.5%Fuel oil, kerosene, etc.
Population in 1990: 1,709.
Place of birth for U.S.-born residents:
This state: 1,126
Northeast: 11
Midwest: 424
South: 52
West: 67
57% of the 57068 zip code residents lived in the same house 5 years ago. Out of people who lived in different houses, 81% lived in this county. Out of people who lived in different counties, 50% lived in South Dakota.
96% of the 57068 zip code residents lived in the same house 1 year ago. Out of people who lived in different houses, 96% moved from this county. Out of people who lived in different houses, 12% moved from different state. Out of people who lived in different houses, 4% moved from abroad.
Private vs. public school enrollment:
Students in private schools in grades 1 to 8 (elementary and middle school): 12
Here:
5.8%
South Dakota:
11.9%
Students in private schools in grades 9 to 12 (high school): 5
Here:
5.2%
South Dakota:
7.2%
Students in private undergraduate colleges: 5
Here:
24.4%
South Dakota:
10.2%
Occupation by median earnings in the past 12 months ($)
80,223Computer and mathematical occupations
63,440Architecture and engineering occupations
61,717Management occupations
61,292Health diagnosing and treating practitioners and other technical occupations
59,438Transportation occupations
55,440Health technologists and technicians
Top industries in this zip code by the number of employees in 2005:
Construction: Water and Sewer Line and Related Structures Construction (10-19 employees: 1 establishment)
Construction: Flooring Contractors (10-19: 1)
Health Care and Social Assistance: Other Individual and Family Services (10-19: 1)
Other Services (except Public Administration): Religious Organizations (5-9: 1, 1-4: 3)
Construction: Plumbing, Heating, and Air-Conditioning Contractors (5-9: 1, 1-4: 1)
Accommodation and Food Services: Full-Service Restaurants (5-9: 1)
Other Services (except Public Administration): Automotive Body, Paint, and Interior Repair and Maintenance (5-9: 1)
Wholesale Trade: Petroleum and Petroleum Products Merchant Wholesalers (except Bulk Stations and Terminals) (5-9: 1)
Home Mortgage Disclosure Act Aggregated Statistics For Year 2009 (Based on 2 partial tracts)
A) FHA, FSA/RHS & VA Home Purchase Loans
B) Conventional Home Purchase Loans
C) Refinancings
D) Home Improvement Loans
E) Loans on Dwellings For 5+ Families
F) Non-occupant Loans on < 5 Family Dwellings (A B C & D)
G) Loans On Manufactured Home Dwelling (A B C & D)
Number
Average Value
Number
Average Value
Number
Average Value
Number
Average Value
Number
Average Value
Number
Average Value
Number
Average Value
LOANS ORIGINATED
69
$138,580
58
$172,200
242
$170,412
19
$85,227
2
$103,515
6
$120,368
1
$44,820
APPLICATIONS APPROVED, NOT ACCEPTED
5
$147,694
4
$238,158
35
$185,654
1
$50,760
0
$0
0
$0
0
$0
APPLICATIONS DENIED
7
$135,920
4
$119,575
51
$178,641
4
$47,295
0
$0
1
$95,180
3
$63,060
APPLICATIONS WITHDRAWN
4
$148,030
4
$208,215
54
$171,948
4
$84,972
0
$0
1
$99,150
0
$0
FILES CLOSED FOR INCOMPLETENESS
0
$0
0
$0
10
$174,940
0
$0
0
$0
0
$0
1
$33,710
Aggregated Statistics For Year 2008 (Based on 2 partial tracts)
A) FHA, FSA/RHS & VA Home Purchase Loans
B) Conventional Home Purchase Loans
C) Refinancings
D) Home Improvement Loans
F) Non-occupant Loans on < 5 Family Dwellings (A B C & D)
G) Loans On Manufactured Home Dwelling (A B C & D)
Number
Average Value
Number
Average Value
Number
Average Value
Number
Average Value
Number
Average Value
Number
Average Value
LOANS ORIGINATED
40
$145,374
76
$153,625
118
$163,544
17
$56,061
8
$138,314
2
$49,970
APPLICATIONS APPROVED, NOT ACCEPTED
3
$149,253
10
$140,277
24
$169,282
2
$46,400
2
$111,645
1
$41,250
APPLICATIONS DENIED
3
$123,077
4
$83,485
42
$130,311
13
$51,253
1
$92,800
2
$46,205
APPLICATIONS WITHDRAWN
2
$151,900
4
$113,825
25
$168,634
2
$104,700
1
$42,040
0
$0
FILES CLOSED FOR INCOMPLETENESS
0
$0
1
$186,400
3
$143,040
0
$0
0
$0
0
$0
Aggregated Statistics For Year 2007 (Based on 2 partial tracts)
A) FHA, FSA/RHS & VA Home Purchase Loans
B) Conventional Home Purchase Loans
C) Refinancings
D) Home Improvement Loans
E) Loans on Dwellings For 5+ Families
F) Non-occupant Loans on < 5 Family Dwellings (A B C & D)
G) Loans On Manufactured Home Dwelling (A B C & D)
Number
Average Value
Number
Average Value
Number
Average Value
Number
Average Value
Number
Average Value
Number
Average Value
Number
Average Value
LOANS ORIGINATED
19
$139,499
129
$142,213
84
$138,007
21
$37,337
1
$824,930
12
$115,542
2
$90,625
APPLICATIONS APPROVED, NOT ACCEPTED
2
$178,865
10
$215,869
20
$135,380
2
$31,530
0
$0
1
$171,730
1
$55,130
APPLICATIONS DENIED
1
$151,500
11
$117,214
46
$148,863
15
$56,529
0
$0
4
$118,980
4
$70,695
APPLICATIONS WITHDRAWN
1
$128,500
9
$136,959
27
$154,983
2
$42,240
0
$0
0
$0
0
$0
FILES CLOSED FOR INCOMPLETENESS
0
$0
4
$134,348
8
$165,829
2
$64,645
0
$0
0
$0
0
$0
Aggregated Statistics For Year 2006 (Based on 2 partial tracts)
A) FHA, FSA/RHS & VA Home Purchase Loans
B) Conventional Home Purchase Loans
C) Refinancings
D) Home Improvement Loans
F) Non-occupant Loans on < 5 Family Dwellings (A B C & D)
G) Loans On Manufactured Home Dwelling (A B C & D)
Number
Average Value
Number
Average Value
Number
Average Value
Number
Average Value
Number
Average Value
Number
Average Value
LOANS ORIGINATED
22
$131,040
143
$124,641
88
$128,422
27
$42,745
12
$101,431
4
$48,285
APPLICATIONS APPROVED, NOT ACCEPTED
0
$0
18
$111,158
19
$123,176
3
$43,627
4
$42,535
2
$62,070
APPLICATIONS DENIED
0
$0
5
$114,142
60
$125,451
9
$63,059
0
$0
4
$97,068
APPLICATIONS WITHDRAWN
0
$0
6
$122,813
34
$108,832
3
$61,870
0
$0
1
$49,570
FILES CLOSED FOR INCOMPLETENESS
0
$0
3
$110,520
10
$135,280
0
$0
1
$105,100
0
$0
Aggregated Statistics For Year 2005 (Based on 2 partial tracts)
A) FHA, FSA/RHS & VA Home Purchase Loans
B) Conventional Home Purchase Loans
C) Refinancings
D) Home Improvement Loans
E) Loans on Dwellings For 5+ Families
F) Non-occupant Loans on < 5 Family Dwellings (A B C & D)
G) Loans On Manufactured Home Dwelling (A B C & D)
Number
Average Value
Number
Average Value
Number
Average Value
Number
Average Value
Number
Average Value
Number
Average Value
Number
Average Value
LOANS ORIGINATED
23
$130,154
124
$126,013
126
$123,988
21
$37,828
2
$299,830
21
$108,310
4
$62,068
APPLICATIONS APPROVED, NOT ACCEPTED
2
$95,185
10
$105,615
19
$116,663
2
$74,760
0
$0
0
$0
1
$38,470
APPLICATIONS DENIED
0
$0
13
$100,035
58
$132,793
8
$31,132
0
$0
2
$83,285
4
$39,660
APPLICATIONS WITHDRAWN
0
$0
8
$151,254
31
$125,198
4
$46,402
0
$0
1
$91,610
1
$65,840
FILES CLOSED FOR INCOMPLETENESS
0
$0
2
$177,280
11
$144,218
0
$0
0
$0
0
$0
0
$0
Aggregated Statistics For Year 2004 (Based on 2 partial tracts)
A) FHA, FSA/RHS & VA Home Purchase Loans
B) Conventional Home Purchase Loans
C) Refinancings
D) Home Improvement Loans
F) Non-occupant Loans on < 5 Family Dwellings (A B C & D)
G) Loans On Manufactured Home Dwelling (A B C & D)
Number
Average Value
Number
Average Value
Number
Average Value
Number
Average Value
Number
Average Value
Number
Average Value
LOANS ORIGINATED
28
$123,753
98
$136,872
146
$117,937
18
$35,033
11
$105,820
6
$70,793
APPLICATIONS APPROVED, NOT ACCEPTED
2
$102,920
9
$130,349
18
$117,988
2
$49,180
0
$0
2
$65,440
APPLICATIONS DENIED
1
$100,740
10
$162,328
53
$121,883
13
$36,823
0
$0
3
$72,577
APPLICATIONS WITHDRAWN
2
$138,810
8
$131,225
27
$124,635
2
$19,630
0
$0
0
$0
FILES CLOSED FOR INCOMPLETENESS
1
$141,590
1
$122,150
15
$134,157
0
$0
0
$0
1
$129,690
Aggregated Statistics For Year 2003 (Based on 2 partial tracts)
A) FHA, FSA/RHS & VA Home Purchase Loans
B) Conventional Home Purchase Loans
C) Refinancings
D) Home Improvement Loans
E) Loans on Dwellings For 5+ Families
F) Non-occupant Loans on < 5 Family Dwellings (A B C & D)
Number
Average Value
Number
Average Value
Number
Average Value
Number
Average Value
Number
Average Value
Number
Average Value
LOANS ORIGINATED
25
$116,346
74
$119,998
354
$121,901
23
$35,953
1
$345,440
8
$113,526
APPLICATIONS APPROVED, NOT ACCEPTED
1
$65,040
7
$150,199
27
$114,089
3
$19,433
0
$0
0
$0
APPLICATIONS DENIED
1
$69,800
10
$63,535
58
$110,624
4
$18,242
0
$0
1
$92,010
APPLICATIONS WITHDRAWN
0
$0
6
$157,582
38
$126,766
1
$61,470
0
$0
0
$0
FILES CLOSED FOR INCOMPLETENESS
0
$0
0
$0
7
$131,331
1
$18,240
0
$0
0
$0
Aggregated Statistics For Year 2002 (Based on 2 partial tracts)
A) FHA, FSA/RHS & VA Home Purchase Loans
B) Conventional Home Purchase Loans
C) Refinancings
D) Home Improvement Loans
F) Non-occupant Loans on < 5 Family Dwellings (A B C & D)
Number
Average Value
Number
Average Value
Number
Average Value
Number
Average Value
Number
Average Value
LOANS ORIGINATED
47
$115,723
144
$112,957
378
$114,230
40
$22,824
16
$92,383
APPLICATIONS APPROVED, NOT ACCEPTED
0
$0
13
$114,862
33
$105,424
5
$24,590
1
$70,590
APPLICATIONS DENIED
2
$117,590
19
$72,995
63
$98,967
10
$13,960
1
$96,770
APPLICATIONS WITHDRAWN
1
$162,610
6
$109,858
63
$126,811
2
$60,680
1
$88,840
FILES CLOSED FOR INCOMPLETENESS
0
$0
2
$93,795
7
$81,983
0
$0
0
$0
Aggregated Statistics For Year 2001 (Based on 2 partial tracts)
A) FHA, FSA/RHS & VA Home Purchase Loans
B) Conventional Home Purchase Loans
C) Refinancings
D) Home Improvement Loans
E) Loans on Dwellings For 5+ Families
F) Non-occupant Loans on < 5 Family Dwellings (A B C & D)
Number
Average Value
Number
Average Value
Number
Average Value
Number
Average Value
Number
Average Value
Number
Average Value
LOANS ORIGINATED
44
$113,770
135
$106,562
316
$103,651
41
$21,262
1
$161,810
8
$69,504
APPLICATIONS APPROVED, NOT ACCEPTED
1
$90,030
13
$76,941
20
$80,688
6
$19,367
0
$0
1
$29,740
APPLICATIONS DENIED
2
$91,415
25
$49,385
56
$72,082
12
$20,128
0
$0
0
$0
APPLICATIONS WITHDRAWN
1
$101,130
9
$108,316
56
$108,690
7
$44,023
0
$0
1
$94,390
FILES CLOSED FOR INCOMPLETENESS
0
$0
1
$50,370
6
$81,502
2
$18,640
0
$0
0
$0
Aggregated Statistics For Year 2000 (Based on 2 partial tracts)
A) FHA, FSA/RHS & VA Home Purchase Loans
B) Conventional Home Purchase Loans
C) Refinancings
D) Home Improvement Loans
E) Loans on Dwellings For 5+ Families
F) Non-occupant Loans on < 5 Family Dwellings (A B C & D)
Number
Average Value
Number
Average Value
Number
Average Value
Number
Average Value
Number
Average Value
Number
Average Value
LOANS ORIGINATED
36
$107,446
144
$109,194
86
$77,328
48
$19,615
1
$454,500
7
$68,556
APPLICATIONS APPROVED, NOT ACCEPTED
1
$92,800
15
$77,522
14
$60,198
5
$18,244
0
$0
0
$0
APPLICATIONS DENIED
2
$83,485
46
$53,222
33
$53,072
9
$14,366
0
$0
2
$40,255
APPLICATIONS WITHDRAWN
4
$94,192
12
$102,191
14
$85,354
1
$35,690
0
$0
1
$93,200
FILES CLOSED FOR INCOMPLETENESS
2
$87,055
1
$83,680
2
$112,040
0
$0
0
$0
0
$0
Aggregated Statistics For Year 1999 (Based on 1 partial tract)
A) FHA, FSA/RHS & VA Home Purchase Loans
B) Conventional Home Purchase Loans
C) Refinancings
D) Home Improvement Loans
F) Non-occupant Loans on < 5 Family Dwellings (A B C & D)


+$60
-$429
(% of AGI for various income ranges: -22.4% for AGIs below $10k, -0.2% for AGIs $10k-25k, -1.0% for AGIs $25k-50k, 2.0% for AGIs $50k-75k) Nearest zip codes: 57005, 56138, 56116, 51241, 57110, 57030.