Estimated zip code population in 2022: 368 Zip code population in 2010: 530 Zip code population in 2000: 572
Houses and condos: 187 Renter-occupied apartments: 17
% of renters here:
11%
State:
31%
March 2022 cost of living index in zip code 59483: 86.7 (less than average, U.S. average is 100)
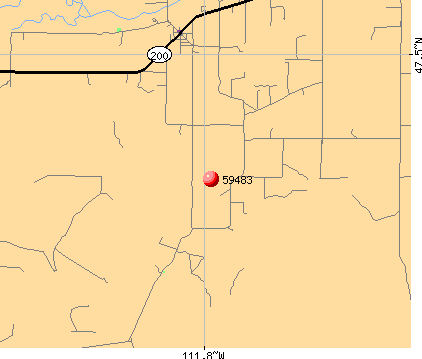
Land area: 104.5 sq. mi. Water area: 0.0 sq. mi.
Population density: 4 people per square mile
(very low).
OSM Map
General Map
Google Map
MSN Map
OSM Map
General Map
Google Map
MSN Map
OSM Map
General Map
Google Map
MSN Map
OSM Map
General Map
Google Map
MSN Map
Please wait while loading the map...
Real estate property taxes paid for housing units in 2022:
This zip code:
0.5% ($2,173)
Montana:
0.7% ($2,498)
Median real estate property taxes paid for housing units with mortgages in 2022: $2,238 (0.5%) Median real estate property taxes paid for housing units with no mortgage in 2022: $2,004 (0.5%)
Business Search- 14 Million verified businesses
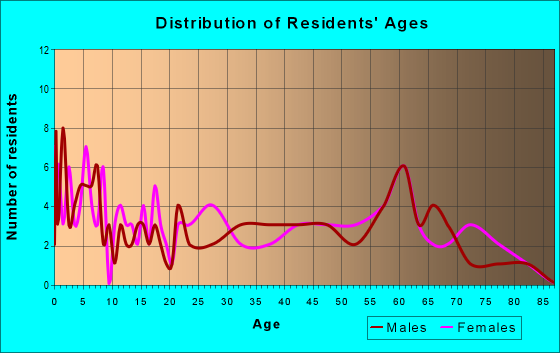
Males: 166
(45.3%)
Females: 201
(54.7%)
For population 25 years and over in 59483:
High school or higher: 96.0%
Bachelor's degree or higher: 24.3%
Graduate or professional degree: 11.3%
Unemployed: 5.5%
Mean travel time to work (commute): 47.9 minutes
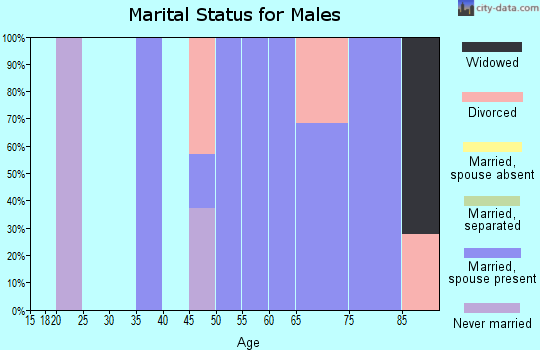
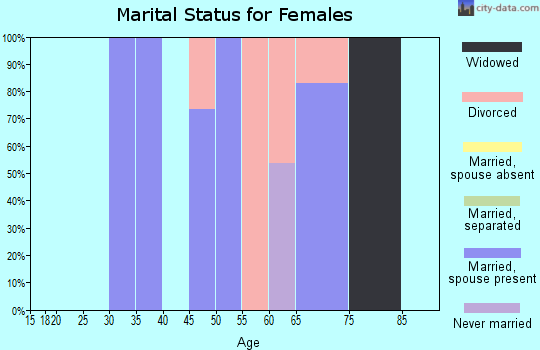
For population 15 years and over in 59483:
Never married: 26.7%
Now married: 63.7%
Separated: 3.8%
Widowed: 3.1%
Divorced: 2.8%
Zip code 59483 compared to state average:
Unemployed percentage above state average.
Black race population percentage significantly below state average.
Hispanic race population percentage significantly below state average.
Median age significantly above state average.
Foreign-born population percentage significantly above state average.
Renting percentage significantly below state average.
Length of stay since moving in significantly above state average.
Estimated median house/condo value in 2022: $439,512
59483:
$439,512
Montana:
$366,400
Median resident age:
This zip code:
54.6 years
Montana median age:
40.2 years
Average household size:
This zip code:
2.2 people
Montana:
2.4 people
Averages for the 2020 tax year for zip code 59483, filed in 2021:
Average Adjusted Gross Income (AGI) in 2020: $44,463 (Individual Income Tax Returns)
Here:
$44,463
State:
$70,533
Salary/wage: $48,660 (reported on 50.0% of returns)
Here:
$48,660
State:
$52,258
(% of AGI for various income ranges: 1122.5% for AGIs below $25k, 3527.5% for AGIs $25k-50k, 9673.3% for AGIs $50k-75k)
Taxable interest for individuals: $371 (reported on 23.3% of returns)
This zip code:
$371
Montana:
$1,928
(% of AGI for various income ranges: 52.5% for AGIs $25k-50k, 16.7% for AGIs $75k-100k)
Ordinary dividends: $14,486 (reported on 46.7% of returns)
Here:
$14,486
State:
$7,554
(% of AGI for various income ranges: 2110.0% for AGIs below $25k, 1862.5% for AGIs $25k-50k, 1463.3% for AGIs $50k-75k)
Net capital gain/loss in AGI: +$13,050 (reported on 13.3% of returns)
Here:
+$13,050
State:
+$26,730
(% of AGI for various income ranges: 1740.0% for AGIs $50k-75k)
Profit/loss from business: +$5,400 (reported on 10.0% of returns)
Here:
+$5,400
State:
+$13,757
(% of AGI for various income ranges: 540.0% for AGIs $50k-75k)
Percentage of individuals using paid preparers for their 2020 taxes: 93.3%
Here:
93%
State:
94%
(% for various income ranges: 92.3% for AGIs below $25k, 100.0% for AGIs $25k-50k, 75.0% for AGIs $50k-75k, 100.0% for AGIs $75k-100k, 100.0% for AGIs $100k-200k)
Averages for the 2012 tax year for zip code 59483, filed in 2013:
Average Adjusted Gross Income (AGI) in 2012: $39,070 (Individual Income Tax Returns)
Here:
$39,070
State:
$53,401
Salary/wage: $40,569 (reported on 53.3% of returns)
Here:
$40,569
State:
$40,976
(% of AGI for various income ranges: 28.7% for AGIs below $25k, 56.4% for AGIs $25k-50k, 59.3% for AGIs $50k-75k, 181.0% for AGIs $75k-100k)
Taxable interest for individuals: $710 (reported on 33.3% of returns)
This zip code:
$710
Montana:
$1,689
(% of AGI for various income ranges: 1.0% for AGIs below $25k, 2.1% for AGIs $25k-50k, 0.5% for AGIs $50k-75k, 0.2% for AGIs $75k-100k)
Ordinary dividends: $9,240 (reported on 50.0% of returns)
Here:
$9,240
State:
$5,585
Net capital gain/loss in AGI: +$3,283 (reported on 20.0% of returns)
Here:
+$3,283
State:
+$14,401
Profit/loss from business: +$2,767 (reported on 10.0% of returns)
Here:
+$2,767
State:
+$10,980
Total itemized deductions: $19,229 (25% of AGI, reported on 23.3% of returns)
Here:
$19,229
State:
$21,750
Here:
25.3% of AGI
State:
20.5% of AGI
Charity contributions: $3,400 (reported on 13.3% of returns)
Here:
$3,400
State:
$3,989
Taxes paid: $6,317 (reported on 20.0% of returns)
59483:
$6,317
State:
$7,640
Earned income credit: $1,733 (reported on 10.0% of returns)
Here:
$1,733
State:
$2,015
(% of AGI for various income ranges: 2.2% for AGIs below $25k)
Percentage of individuals using paid preparers for their 2012 taxes: 80.0%
Here:
80%
State:
57%
(% for various income ranges: 77.8% for AGIs below $25k, 75.0% for AGIs $25k-50k, 75.0% for AGIs $50k-75k, 200.0% for AGIs $75k-100k)
Averages for the 2004 tax year for zip code 59483, filed in 2005:
Average Adjusted Gross Income (AGI) in 2004: $24,239 (Individual Income Tax Returns)
Here:
$24,239
State:
$37,845
Salary/wage: $26,842 (reported on 49.8% of returns)
Here:
$26,842
State:
$31,190
(% of AGI for various income ranges: 29.5% for AGIs below $10k, 43.3% for AGIs $10k-25k, 73.8% for AGIs $25k-50k, 73.1% for AGIs $50k-75k, 38.8% for AGIs $75k-100k)
Taxable interest for individuals: $2,618 (reported on 61.6% of returns)
This zip code:
$2,618
Montana:
$1,879
(% of AGI for various income ranges: 40.6% for AGIs below $10k, 16.2% for AGIs $10k-25k, 2.0% for AGIs $25k-50k, 0.7% for AGIs $50k-75k, 0.6% for AGIs $75k-100k)
Taxable dividends: $1,855 (reported on 18.7% of returns)
Here:
$1,855
State:
$3,070
(% of AGI for various income ranges: 1.5% for AGIs below $10k, 4.1% for AGIs $10k-25k, 1.2% for AGIs $25k-50k, 1.4% for AGIs $50k-75k)
Net capital gain/loss: +$1,646 (reported on 19.6% of returns)
Here:
+$1,646
State:
+$10,237
(% of AGI for various income ranges: -0.7% for AGIs below $10k, 0.0% for AGIs $10k-25k, 0.8% for AGIs $25k-50k, 5.1% for AGIs $50k-75k)
Profit/loss from business: +$12,152 (reported on 13.9% of returns)
Here:
+$12,152
State:
+$8,849
Total itemized deductions: $13,369 (25% of AGI, reported on 19.6% of returns)
Here:
$13,369
State:
$17,258
Here:
25.2% of AGI
State:
23.1% of AGI
(% of AGI for various income ranges: 16.4% for AGIs $10k-25k, 8.6% for AGIs $25k-50k, 11.6% for AGIs $50k-75k, 11.5% for AGIs $75k-100k)
Charity contributions deductions: $1,774 (3% of AGI, reported on 16.0% of returns)
Here:
$1,774
State:
$2,921
Here:
3.1% of AGI
State:
3.7% of AGI
(% of AGI for various income ranges: 1.7% for AGIs $10k-25k, 0.7% for AGIs $25k-50k, 1.6% for AGIs $50k-75k, 1.2% for AGIs $75k-100k)
Total tax: $3,657 (reported on 52.0% of returns)
59483:
$3,657
State:
$5,485
(% of AGI for various income ranges: 1.0% for AGIs below $10k, 3.0% for AGIs $10k-25k, 5.9% for AGIs $25k-50k, 8.5% for AGIs $50k-75k, 13.7% for AGIs $75k-100k)
Earned income credit: $1,742 (reported on 9.4% of returns)
Here:
$1,742
State:
$1,604
Percentage of individuals using paid preparers for their 2004 taxes: 77.6%
Here:
78%
State:
63%
(% for various income ranges: 85.3% for AGIs below $10k, 69.5% for AGIs $10k-25k, 75.9% for AGIs $25k-50k, 71.0% for AGIs $50k-75k, 71.4% for AGIs $75k-100k)
Household received Food Stamps/SNAP in the past 12 months: 0 Household did not receive Food Stamps/SNAP in the past 12 months: 172
Women who did not have a birth in the past 12 months: 79 (29 now married, 50 unmarried)
Housing units in zip code 59483 with a mortgage: 79 (7 second mortgage, 7 both second mortgage and home equity loan) Median monthly owner costs for units with a mortgage: $2,030 Median monthly owner costs for units without a mortgage: $625
Median number of rooms in houses and condos:
Here:
6.7
State:
6.4
Notable locations in this zip code not listed on our city pages
Size of family households: 83 2-persons, 18 5-persons, 5 6-persons
Size of nonfamily households: 55 1-person, 5 2-persons
38 married couples with children.
0 single-parent households ().
94.0% of residents of 59483 zip code speak English at home.
7.0% of residents speak other Indo-European language at home (62% very well, 38% well).
Foreign born population: 42 (11.5%) (100.0% of them are naturalized citizens)
This zip code:
11.5%
Whole state:
2.3%
67%France
28%Romania
33%German
18%English
9%European
9%Italian
7%Russian
7%Scottish
4%American
Year of entry for the foreign-born population
02010 or later
02000 to 2009
141990 to 1999
28Before 1990
Facilities with environmental interests located in this zip code:
SUN RIVER MIDDLE SCHOOL (301 LARGENT ST in SUN RIVER, MT)
(Geographic Names Information System) (National Center for Education Statistics) - STATE ID-1538 Organizations: SUN RIVER VALLEY ELEM (SCHOOL DISTRICT)
CASCADE COLONY SCHOOL (508 BIRDTAIL CREEK ROAD in SUN RIVER, MT)
COMPLIANCE ACTIVITY (Tracking inspections of insecticide, fungicide, and rodenticide, and toxic substances)
62.5%Utility gas
29.1%Bottled, tank, or LP gas
4.9%Other fuel
2.5%Wood
1.9%Electricity
Population in 1990: 1,083.
Place of birth for U.S.-born residents:
This state: 219
Midwest: 51
West: 47
73% of the 59483 zip code residents lived in the same house 5 years ago. Out of people who lived in different houses, 45% lived in this county. Out of people who lived in different counties, 50% lived in Montana.
94% of the 59483 zip code residents lived in the same house 1 year ago. Out of people who lived in different houses, 35% moved from this county. Out of people who lived in different houses, 35% moved from different county within same state. Out of people who lived in different houses, 24% moved from abroad.
Private vs. public school enrollment:
Students in private schools in grades 1 to 8 (elementary and middle school):
Here:
0.0%
Montana:
15.3%
Students in private schools in grades 9 to 12 (high school):
Here:
0.0%
Montana:
12.2%
Students in private undergraduate colleges:
Here:
0.0%
Montana:
15.0%
Occupation by median earnings in the past 12 months ($)
247,619Management occupations
113,183Health diagnosing and treating practitioners and other technical occupations
23,736Sales and related occupations
5,179Office and administrative support occupations
Top industries in this zip code by the number of employees in 2005:
Construction: Plumbing, Heating, and Air-Conditioning Contractors (10-19 employees: 1 establishment)
Construction: Other Foundation, Structure, and Building Exterior Contractors (5-9: 1)
Construction: New Single-Family Housing Construction (except Operative Builders) (1-4: 2)
Information: Motion Picture and Video Production (1-4: 1)
Construction: Site Preparation Contractors (1-4: 1)
Fatal accident statistics in 2014:
Fatal accident count: 1
Vehicles involved in fatal accidents: 1
Fatal accidents caused by drunken drivers: 0
Fatalities: 1
Persons involved in fatal accidents: 1
Pedestrians involved in fatal accidents: 0
Home Mortgage Disclosure Act Aggregated Statistics For Year 2009 (Based on 2 partial tracts)
A) FHA, FSA/RHS & VA Home Purchase Loans
B) Conventional Home Purchase Loans
C) Refinancings
D) Home Improvement Loans
F) Non-occupant Loans on < 5 Family Dwellings (A B C & D)
G) Loans On Manufactured Home Dwelling (A B C & D)
Number
Average Value
Number
Average Value
Number
Average Value
Number
Average Value
Number
Average Value
Number
Average Value
LOANS ORIGINATED
6
$172,403
8
$138,134
47
$164,801
8
$77,024
2
$168,500
5
$89,840
APPLICATIONS APPROVED, NOT ACCEPTED
1
$80,470
1
$176,050
8
$197,731
0
$0
0
$0
2
$65,360
APPLICATIONS DENIED
1
$68,000
3
$93,443
12
$172,718
4
$86,232
2
$284,860
3
$62,210
APPLICATIONS WITHDRAWN
1
$203,260
1
$120,140
10
$186,444
2
$48,360
0
$0
0
$0
FILES CLOSED FOR INCOMPLETENESS
0
$0
0
$0
2
$124,295
0
$0
0
$0
0
$0
Aggregated Statistics For Year 2008 (Based on 2 partial tracts)
A) FHA, FSA/RHS & VA Home Purchase Loans
B) Conventional Home Purchase Loans
C) Refinancings
D) Home Improvement Loans
F) Non-occupant Loans on < 5 Family Dwellings (A B C & D)
G) Loans On Manufactured Home Dwelling (A B C & D)
Number
Average Value
Number
Average Value
Number
Average Value
Number
Average Value
Number
Average Value
Number
Average Value
LOANS ORIGINATED
8
$138,936
9
$148,013
29
$159,419
8
$68,665
3
$194,567
5
$96,112
APPLICATIONS APPROVED, NOT ACCEPTED
1
$122,790
1
$100,120
2
$125,430
0
$0
0
$0
1
$37,780
APPLICATIONS DENIED
0
$0
3
$115,733
14
$116,174
4
$119,952
2
$105,785
4
$62,148
APPLICATIONS WITHDRAWN
0
$0
2
$134,495
3
$161,950
1
$128,450
0
$0
0
$0
FILES CLOSED FOR INCOMPLETENESS
0
$0
0
$0
1
$162,450
0
$0
0
$0
0
$0
Aggregated Statistics For Year 2007 (Based on 2 partial tracts)
A) FHA, FSA/RHS & VA Home Purchase Loans
B) Conventional Home Purchase Loans
C) Refinancings
D) Home Improvement Loans
F) Non-occupant Loans on < 5 Family Dwellings (A B C & D)
G) Loans On Manufactured Home Dwelling (A B C & D)
Number
Average Value
Number
Average Value
Number
Average Value
Number
Average Value
Number
Average Value
Number
Average Value
LOANS ORIGINATED
5
$122,030
11
$135,802
26
$136,720
7
$34,219
3
$91,680
7
$81,929
APPLICATIONS APPROVED, NOT ACCEPTED
1
$127,320
1
$108,810
1
$215,350
1
$62,710
0
$0
0
$0
APPLICATIONS DENIED
1
$155,650
2
$123,540
18
$121,106
6
$58,245
2
$66,115
3
$86,517
APPLICATIONS WITHDRAWN
1
$46,470
2
$149,230
8
$116,315
2
$30,225
0
$0
2
$48,360
FILES CLOSED FOR INCOMPLETENESS
0
$0
0
$0
1
$134,870
0
$0
0
$0
0
$0
Aggregated Statistics For Year 2006 (Based on 2 partial tracts)
A) FHA, FSA/RHS & VA Home Purchase Loans
B) Conventional Home Purchase Loans
C) Refinancings
D) Home Improvement Loans
F) Non-occupant Loans on < 5 Family Dwellings (A B C & D)
G) Loans On Manufactured Home Dwelling (A B C & D)
Number
Average Value
Number
Average Value
Number
Average Value
Number
Average Value
Number
Average Value
Number
Average Value
LOANS ORIGINATED
8
$133,552
17
$154,120
28
$124,674
5
$47,452
2
$236,880
5
$78,054
APPLICATIONS APPROVED, NOT ACCEPTED
0
$0
2
$194,190
3
$110,443
0
$0
0
$0
1
$59,310
APPLICATIONS DENIED
1
$108,430
6
$168,940
23
$95,797
8
$51,381
0
$0
4
$62,338
APPLICATIONS WITHDRAWN
0
$0
3
$202,250
11
$116,225
2
$69,895
0
$0
2
$68,760
FILES CLOSED FOR INCOMPLETENESS
0
$0
0
$0
1
$128,830
0
$0
0
$0
0
$0
Aggregated Statistics For Year 2005 (Based on 2 partial tracts)
A) FHA, FSA/RHS & VA Home Purchase Loans
B) Conventional Home Purchase Loans
C) Refinancings
D) Home Improvement Loans
F) Non-occupant Loans on < 5 Family Dwellings (A B C & D)
G) Loans On Manufactured Home Dwelling (A B C & D)
Number
Average Value
Number
Average Value
Number
Average Value
Number
Average Value
Number
Average Value
Number
Average Value
LOANS ORIGINATED
9
$124,212
21
$154,502
29
$98,137
3
$18,010
7
$221,174
6
$63,407
APPLICATIONS APPROVED, NOT ACCEPTED
0
$0
4
$113,058
6
$123,918
2
$81,415
0
$0
2
$71,780
APPLICATIONS DENIED
0
$0
9
$108,219
19
$115,090
5
$46,998
2
$47,035
7
$53,971
APPLICATIONS WITHDRAWN
1
$139,790
5
$107,976
11
$120,862
2
$121,465
1
$99,740
3
$82,990
FILES CLOSED FOR INCOMPLETENESS
0
$0
0
$0
2
$148,665
0
$0
0
$0
0
$0
Aggregated Statistics For Year 2004 (Based on 2 partial tracts)
A) FHA, FSA/RHS & VA Home Purchase Loans
B) Conventional Home Purchase Loans
C) Refinancings
D) Home Improvement Loans
F) Non-occupant Loans on < 5 Family Dwellings (A B C & D)
G) Loans On Manufactured Home Dwelling (A B C & D)
Number
Average Value
Number
Average Value
Number
Average Value
Number
Average Value
Number
Average Value
Number
Average Value
LOANS ORIGINATED
4
$92,940
12
$114,127
34
$108,840
7
$34,326
3
$71,657
8
$70,649
APPLICATIONS APPROVED, NOT ACCEPTED
0
$0
0
$0
6
$97,787
0
$0
0
$0
0
$0
APPLICATIONS DENIED
1
$69,520
3
$178,070
22
$107,106
2
$47,790
1
$50,250
3
$67,753
APPLICATIONS WITHDRAWN
0
$0
2
$71,215
11
$142,294
0
$0
1
$154,900
1
$52,890
FILES CLOSED FOR INCOMPLETENESS
0
$0
0
$0
2
$120,705
0
$0
0
$0
0
$0
Aggregated Statistics For Year 2003 (Based on 2 partial tracts)
A) FHA, FSA/RHS & VA Home Purchase Loans
B) Conventional Home Purchase Loans
C) Refinancings
D) Home Improvement Loans
F) Non-occupant Loans on < 5 Family Dwellings (A B C & D)
Number
Average Value
Number
Average Value
Number
Average Value
Number
Average Value
Number
Average Value
LOANS ORIGINATED
8
$97,945
9
$120,224
62
$106,735
3
$15,743
3
$61,833
APPLICATIONS APPROVED, NOT ACCEPTED
0
$0
1
$62,710
11
$97,678
1
$7,180
0
$0
APPLICATIONS DENIED
1
$97,850
4
$84,060
32
$98,027
3
$37,527
1
$30,980
APPLICATIONS WITHDRAWN
0
$0
1
$131,100
18
$97,242
0
$0
1
$64,980
FILES CLOSED FOR INCOMPLETENESS
0
$0
0
$0
4
$109,372
0
$0
0
$0
Aggregated Statistics For Year 2002 (Based on 2 partial tracts)
A) FHA, FSA/RHS & VA Home Purchase Loans
B) Conventional Home Purchase Loans
C) Refinancings
D) Home Improvement Loans
F) Non-occupant Loans on < 5 Family Dwellings (A B C & D)
Number
Average Value
Number
Average Value
Number
Average Value
Number
Average Value
Number
Average Value
LOANS ORIGINATED
5
$119,688
13
$96,310
34
$104,106
5
$21,988
2
$80,660
APPLICATIONS APPROVED, NOT ACCEPTED
1
$93,320
3
$77,953
6
$83,998
0
$0
0
$0
APPLICATIONS DENIED
1
$71,780
2
$84,625
22
$99,602
3
$14,607
1
$107,300
APPLICATIONS WITHDRAWN
0
$0
1
$58,560
15
$113,088
1
$12,090
0
$0
FILES CLOSED FOR INCOMPLETENESS
0
$0
0
$0
2
$129,965
0
$0
0
$0
Aggregated Statistics For Year 2001 (Based on 2 partial tracts)
A) FHA, FSA/RHS & VA Home Purchase Loans
B) Conventional Home Purchase Loans
C) Refinancings
D) Home Improvement Loans
F) Non-occupant Loans on < 5 Family Dwellings (A B C & D)
Number
Average Value
Number
Average Value
Number
Average Value
Number
Average Value
Number
Average Value
LOANS ORIGINATED
5
$80,924
6
$105,722
45
$88,061
7
$20,401
3
$55,410
APPLICATIONS APPROVED, NOT ACCEPTED
0
$0
5
$82,964
4
$51,002
2
$5,855
0
$0
APPLICATIONS DENIED
0
$0
10
$45,789
20
$70,781
3
$13,853
2
$34,380
APPLICATIONS WITHDRAWN
1
$64,980
2
$41,935
6
$64,855
2
$17,570
0
$0
FILES CLOSED FOR INCOMPLETENESS
0
$0
0
$0
3
$106,163
0
$0
0
$0
Aggregated Statistics For Year 2000 (Based on 2 partial tracts)
A) FHA, FSA/RHS & VA Home Purchase Loans
B) Conventional Home Purchase Loans
C) Refinancings
D) Home Improvement Loans
F) Non-occupant Loans on < 5 Family Dwellings (A B C & D)
Number
Average Value
Number
Average Value
Number
Average Value
Number
Average Value
Number
Average Value
LOANS ORIGINATED
4
$99,832
13
$94,566
20
$79,357
8
$22,526
2
$26,445
APPLICATIONS APPROVED, NOT ACCEPTED
0
$0
5
$55,008
5
$94,072
1
$89,920
0
$0
APPLICATIONS DENIED
0
$0
8
$64,888
11
$50,316
2
$43,070
0
$0
APPLICATIONS WITHDRAWN
0
$0
1
$93,320
5
$55,008
0
$0
0
$0
FILES CLOSED FOR INCOMPLETENESS
0
$0
0
$0
0
$0
1
$17,000
0
$0
Aggregated Statistics For Year 1999 (Based on 1 partial tract)
A) FHA, FSA/RHS & VA Home Purchase Loans
B) Conventional Home Purchase Loans
C) Refinancings
D) Home Improvement Loans
F) Non-occupant Loans on < 5 Family Dwellings (A B C & D)


 Nearest zip codes: 59485, 59487, 59443, 59477, 59468, 59421.