Estimated zip code population in 2022: 551 Zip code population in 2010: 709 Zip code population in 2000: 732
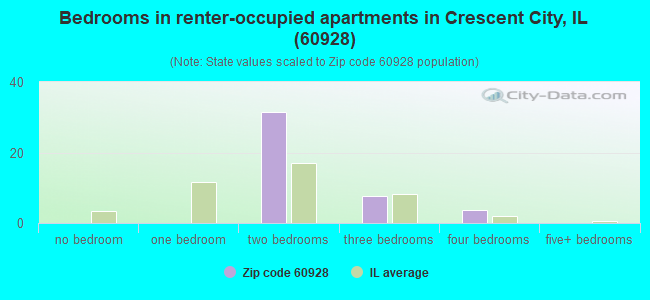
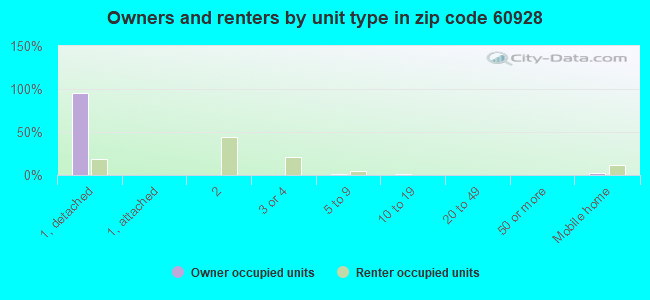
Houses and condos: 263 Renter-occupied apartments: 43
% of renters here:
17%
State:
33%
March 2022 cost of living index in zip code 60928: 84.2 (less than average, U.S. average is 100)
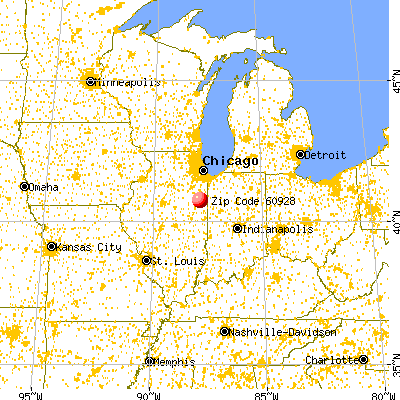
Land area: 11.0 sq. mi. Water area: 0.0 sq. mi.
Population density: 50 people per square mile
(very low).
OSM Map
General Map
Google Map
MSN Map
OSM Map
General Map
Google Map
MSN Map
OSM Map
General Map
Google Map
MSN Map
OSM Map
General Map
Google Map
MSN Map
Please wait while loading the map...
Real estate property taxes paid for housing units in 2022:
This zip code:
1.9% ($2,154)
Illinois:
2.0% ($4,912)
Median real estate property taxes paid for housing units with mortgages in 2022: $2,296 (1.9%) Median real estate property taxes paid for housing units with no mortgage in 2022: $1,872 (1.7%)
Business Search- 14 Million verified businesses
Males: 261
(47.4%)
Females: 289
(52.6%)
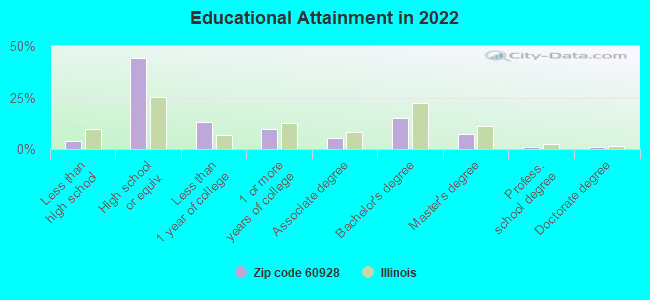
For population 25 years and over in 60928:
High school or higher: 95.0%
Bachelor's degree or higher: 23.6%
Graduate or professional degree: 9.0%
Unemployed: 7.0%
Mean travel time to work (commute): 21.4 minutes
For population 15 years and over in 60928:
Never married: 22.2%
Now married: 58.1%
Separated: 0.0%
Widowed: 5.8%
Divorced: 13.8%
Zip code 60928 compared to state average:
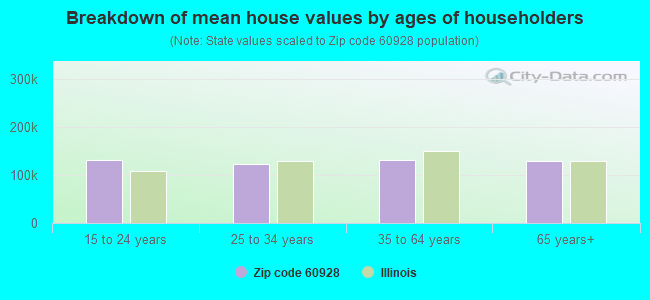
Median house value below state average.
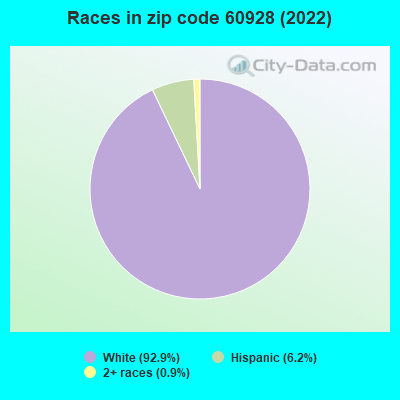
Black race population percentage significantly below state average.
Hispanic race population percentage below state average.
Median age significantly above state average.
Foreign-born population percentage significantly below state average.
Renting percentage below state average.
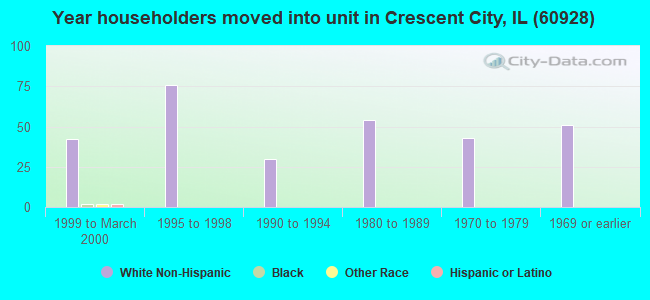
Length of stay since moving in significantly above state average.
Number of college students significantly below state average.
Estimated median house/condo value in 2022: $114,698
60928:
$114,698
Illinois:
$251,600
Median resident age:
This zip code:
49.2 years
Illinois median age:
39.1 years
Average household size:
This zip code:
2.2 people
Illinois:
2.4 people
Averages for the 2020 tax year for zip code 60928, filed in 2021:
Average Adjusted Gross Income (AGI) in 2020: $49,941 (Individual Income Tax Returns)
Here:
$49,941
State:
$82,626
Salary/wage: $41,338 (reported on 78.4% of returns)
Here:
$41,338
State:
$66,640
(% of AGI for various income ranges: 1114.4% for AGIs below $25k, 3184.3% for AGIs $25k-50k, 6147.5% for AGIs $50k-75k, 6320.0% for AGIs $75k-100k)
Taxable interest for individuals: $800 (reported on 40.5% of returns)
This zip code:
$800
Illinois:
$2,376
(% of AGI for various income ranges: 26.7% for AGIs below $25k, 31.4% for AGIs $25k-50k, 17.5% for AGIs $50k-75k, 40.0% for AGIs $75k-100k)
Ordinary dividends: $1,614 (reported on 18.9% of returns)
Here:
$1,614
State:
$9,061
(% of AGI for various income ranges: 52.9% for AGIs $25k-50k, 152.0% for AGIs $75k-100k)
Net capital gain/loss in AGI: +$120 (reported on 13.5% of returns)
Here:
+$120
State:
+$31,684
(% of AGI for various income ranges: 32.5% for AGIs $50k-75k)
Profit/loss from business: +$3,460 (reported on 13.5% of returns)
Here:
+$3,460
State:
+$12,175
(% of AGI for various income ranges: 150.0% for AGIs below $25k, 54.3% for AGIs $25k-50k)
Taxable individual retirement arrangement distribution: $7,900 (reported on 13.5% of returns)
60928:
$7,900
Illinois:
$21,613
(% of AGI for various income ranges: 150.0% for AGIs below $25k, 650.0% for AGIs $50k-75k)
Earned income credit: $2,080 (reported on 13.5% of returns)
Here:
$2,080
State:
$2,311
(% of AGI for various income ranges: 115.6% for AGIs below $25k)
Percentage of individuals using paid preparers for their 2020 taxes: 97.3%
Here:
97%
State:
93%
(% for various income ranges: 92.3% for AGIs below $25k, 100.0% for AGIs $25k-50k, 100.0% for AGIs $50k-75k, 100.0% for AGIs $75k-100k, 100.0% for AGIs $100k-200k)
Averages for the 2012 tax year for zip code 60928, filed in 2013:
Average Adjusted Gross Income (AGI) in 2012: $48,124 (Individual Income Tax Returns)
Here:
$48,124
State:
$68,058
Salary/wage: $35,153 (reported on 81.1% of returns)
Here:
$35,153
State:
$55,396
(% of AGI for various income ranges: 64.5% for AGIs below $25k, 74.4% for AGIs $25k-50k, 68.5% for AGIs $50k-75k, 56.7% for AGIs $75k-100k, 37.4% for AGIs $100k-200k)
Taxable interest for individuals: $581 (reported on 43.2% of returns)
This zip code:
$581
Illinois:
$1,969
(% of AGI for various income ranges: 0.8% for AGIs below $25k, 0.6% for AGIs $25k-50k, 0.3% for AGIs $50k-75k, 0.3% for AGIs $75k-100k, 0.7% for AGIs $100k-200k)
Ordinary dividends: $1,557 (reported on 18.9% of returns)
Here:
$1,557
State:
$7,786
Profit/loss from business: +$3,014 (reported on 18.9% of returns)
Here:
+$3,014
State:
+$12,903
Taxable individual retirement arrangement distribution: $6,267 (reported on 16.2% of returns)
60928:
$6,267
Illinois:
$17,929
Total itemized deductions: $14,733 (21% of AGI, reported on 24.3% of returns)
Here:
$14,733
State:
$26,433
Here:
20.7% of AGI
State:
19.2% of AGI
(% of AGI for various income ranges: 9.7% for AGIs $25k-50k, 7.1% for AGIs $50k-75k, 22.5% for AGIs $75k-100k)
Charity contributions: $2,186 (reported on 18.9% of returns)
Here:
$2,186
State:
$4,525
Taxes paid: $5,922 (reported on 24.3% of returns)
60928:
$5,922
State:
$11,968
(% of AGI for various income ranges: 2.7% for AGIs $25k-50k, 2.8% for AGIs $50k-75k, 10.8% for AGIs $75k-100k)
Earned income credit: $2,160 (reported on 13.5% of returns)
Here:
$2,160
State:
$2,349
(% of AGI for various income ranges: 4.8% for AGIs below $25k, 0.9% for AGIs $25k-50k)
Percentage of individuals using paid preparers for their 2012 taxes: 73.0%
Here:
73%
State:
57%
(% for various income ranges: 61.5% for AGIs below $25k, 70.0% for AGIs $25k-50k, 75.0% for AGIs $50k-75k, 100.0% for AGIs $75k-100k, 100.0% for AGIs $100k-200k)
Averages for the 2004 tax year for zip code 60928, filed in 2005:
Average Adjusted Gross Income (AGI) in 2004: $38,780 (Individual Income Tax Returns)
Here:
$38,780
State:
$54,625
Salary/wage: $33,912 (reported on 79.9% of returns)
Here:
$33,912
State:
$46,811
(% of AGI for various income ranges: 68.0% for AGIs below $10k, 58.9% for AGIs $10k-25k, 78.4% for AGIs $25k-50k, 74.8% for AGIs $50k-75k, 79.8% for AGIs $75k-100k, 52.1% for AGIs over 100k)
Taxable interest for individuals: $1,063 (reported on 60.4% of returns)
This zip code:
$1,063
Illinois:
$2,101
(% of AGI for various income ranges: 8.8% for AGIs below $10k, 4.3% for AGIs $10k-25k, 1.4% for AGIs $25k-50k, 1.0% for AGIs $50k-75k, 0.5% for AGIs $75k-100k, 1.3% for AGIs over 100k)
Taxable dividends: $719 (reported on 24.1% of returns)
Here:
$719
State:
$4,306
(% of AGI for various income ranges: 1.7% for AGIs below $10k, 0.4% for AGIs $10k-25k, 0.4% for AGIs $25k-50k, 0.3% for AGIs $50k-75k, 1.5% for AGIs $75k-100k)
Net capital gain/loss: +$2,540 (reported on 17.1% of returns)
Here:
+$2,540
State:
+$17,321
(% of AGI for various income ranges: 2.8% for AGIs below $10k, 1.8% for AGIs $25k-50k, 0.6% for AGIs $50k-75k, 3.4% for AGIs $75k-100k)
Profit/loss from business: +$2,228 (reported on 15.4% of returns)
Here:
+$2,228
State:
+$11,771
IRA payment deduction: $3,667 (reported on 4.9% of returns)
60928:
$3,667
Illinois:
$3,087
Total itemized deductions: $13,753 (21% of AGI, reported on 22.0% of returns)
Here:
$13,753
State:
$20,239
Here:
20.5% of AGI
State:
19.5% of AGI
(% of AGI for various income ranges: 17.1% for AGIs $10k-25k, 6.5% for AGIs $25k-50k, 7.4% for AGIs $50k-75k, 8.5% for AGIs $75k-100k, 5.1% for AGIs over 100k)
Charity contributions deductions: $2,437 (4% of AGI, reported on 19.2% of returns)
Here:
$2,437
State:
$3,719
Here:
3.5% of AGI
State:
3.4% of AGI
(% of AGI for various income ranges: 1.8% for AGIs $10k-25k, 0.9% for AGIs $25k-50k, 0.9% for AGIs $50k-75k, 1.8% for AGIs $75k-100k, 1.5% for AGIs over 100k)
Total tax: $5,182 (reported on 74.3% of returns)
60928:
$5,182
State:
$9,882
(% of AGI for various income ranges: 2.2% for AGIs below $10k, 3.8% for AGIs $10k-25k, 6.7% for AGIs $25k-50k, 8.3% for AGIs $50k-75k, 10.3% for AGIs $75k-100k, 20.7% for AGIs over 100k)
Earned income credit: $1,533 (reported on 12.2% of returns)
Here:
$1,533
State:
$1,788
Percentage of individuals using paid preparers for their 2004 taxes: 68.6%
Here:
69%
State:
61%
(% for various income ranges: 53.3% for AGIs below $10k, 66.7% for AGIs $10k-25k, 69.7% for AGIs $25k-50k, 80.6% for AGIs $50k-75k, 72.7% for AGIs $75k-100k, 87.5% for AGIs over 100k)
Likely homosexual households (counted as self-reported same-sex unmarried-partner households)
Lesbian couples: 4.4% of all households
Gay men: 0.0% of all households
Household received Food Stamps/SNAP in the past 12 months: 40 Household did not receive Food Stamps/SNAP in the past 12 months: 208
Women who had a birth in the past 12 months: 13 (2 now married, 10 unmarried) Women who did not have a birth in the past 12 months: 96 (38 now married, 57 unmarried)
Housing units in zip code 60928 with a mortgage: 101 (5 second mortgage, 5 both second mortgage and home equity loan) Median monthly owner costs for units with a mortgage: $929 Median monthly owner costs for units without a mortgage: $434
Residents with income below the poverty level in 2022:
This zip code:
6.6%
Whole state:
11.9%
Residents with income below 50% of the poverty level in 2022:
This zip code:
1.8%
Whole state:
5.7%
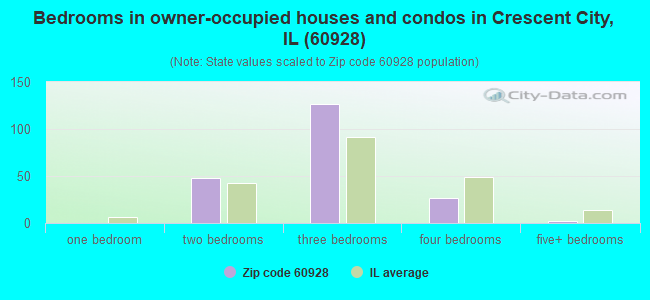
Median number of rooms in houses and condos:
Here:
6.3
State:
6.4
Median number of rooms in apartments:
Here:
4.3
State:
4.1
Notable locations in this zip code not listed on our city pages
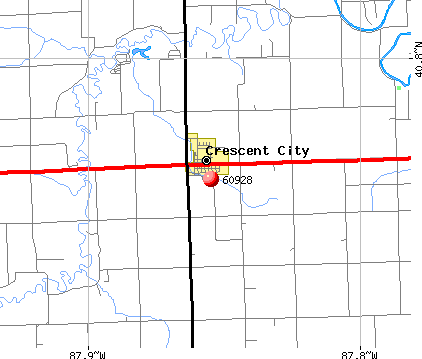
Notable locations in zip code 60928: Crescent City Station (A), Crescent - Iroquois Fire Protection District (B), Crescent - Iroquois Emergency Medical Services and Ambulance Services (C). Display/hide their locations on the map
Size of family households: 133 2-persons, 12 3-persons, 31 4-persons, 5 5-persons, 3 6-persons
Size of nonfamily households: 50 1-person, 11 2-persons
47 married couples with children.
29 single-parent households (7 men, 22 women).
100.2% of residents of 60928 zip code speak English at home.
Foreign born population: 3 (0.5%) (100.0% of them are naturalized citizens)
This zip code:
0.5%
Whole state:
14.4%
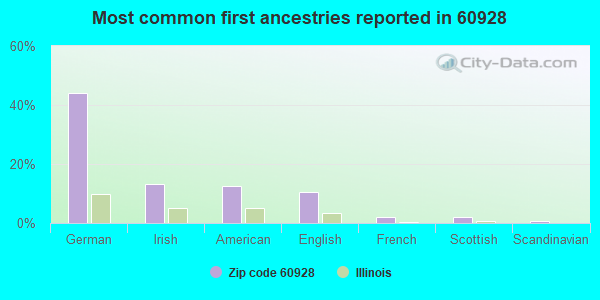
44%German
13%Irish
13%American
11%English
2%French
2%Scottish
1%Scandinavian
Year of entry for the foreign-born population
02010 or later
02000 to 2009
01990 to 1999
2Before 1990
Facilities with environmental interests located in this zip code:
A WAY INCORPORATED (600 EAST JERRY ASH AVENUE in CRESCENT CITY, IL)
STATE MASTER (Illinois EPA Project) - AIR PROGRAM AIR MINOR (AIRS/AFS) ENFORCEMENT/COMPLIANCE ACTIVITY (Integrated Compliance Information System) CRITERIA AND HAZARDOUS AIR POLLUTANT INVENTORY (Inventory of air pollution sources) Business SIC classification: GRAIN AND FIELD BEANS
HAR BRAND INC- H N AND W INC (RT 24 EAST in CRESCENT CITY, IL)
STATE MASTER (Illinois EPA Project) - AIR PROGRAM AIR MINOR (AIRS/AFS) Business SIC classification: FERTILIZERS, MIXING ONLY
CRESCENT-IROQUOIS HIGH SCHOOL (100 S CHESTNUT BX 10 in CRESCENT CITY, IL)
(Geographic Names Information System) (National Center for Education Statistics) - STATE ID-3203825200001 Organizations: CRESCENT IROQUOIS COMM DIST 252 (SCHOOL DISTRICT)
CRESCENT CITY C C GRADE SCHOOL (P O BOX 190 in CRESCENT CITY, IL)
(National Center for Education Statistics) - STATE ID-3203827502001 Organizations: CRESCENT CITY C C SCHOOL DIST 275 (SCHOOL DISTRICT)
Housing units lacking complete plumbing facilities: 3.1% Housing units lacking complete kitchen facilities: 2.8%
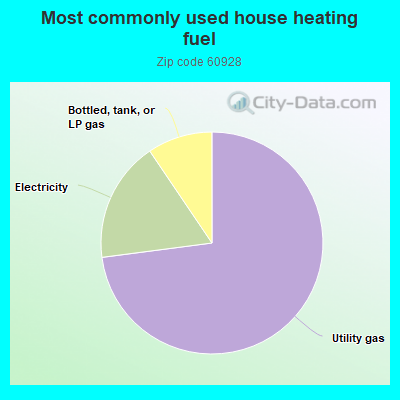
73.3%Utility gas
17.7%Electricity
9.5%Bottled, tank, or LP gas
Population in 1990: 1,271.
Place of birth for U.S.-born residents:
This state: 491
Midwest: 35
South: 19
63% of the 60928 zip code residents lived in the same house 5 years ago. Out of people who lived in different houses, 52% lived in this county. Out of people who lived in different counties, 50% lived in Illinois.
97% of the 60928 zip code residents lived in the same house 1 year ago. Out of people who lived in different houses, 64% moved from this county. Out of people who lived in different houses, 29% moved from different county within same state.
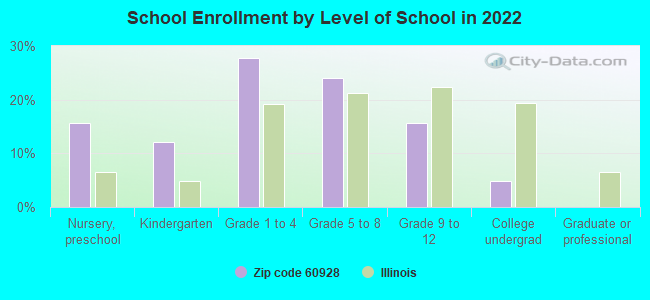
Private vs. public school enrollment:
Students in private schools in grades 1 to 8 (elementary and middle school): 3
Here:
7.0%
Illinois:
13.3%
Students in private schools in grades 9 to 12 (high school): 2
Here:
20.9%
Illinois:
9.9%
Students in private undergraduate colleges:
Here:
0.0%
Illinois:
27.4%
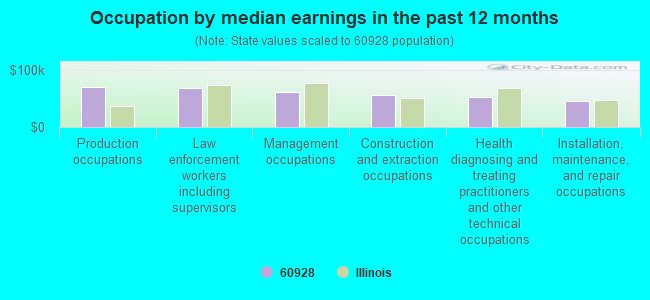
Occupation by median earnings in the past 12 months ($)
69,152Production occupations
67,766Law enforcement workers including supervisors
60,835Management occupations
55,907Construction and extraction occupations
52,442Health diagnosing and treating practitioners and other technical occupations
45,612Installation, maintenance, and repair occupations
Companies with federal contracts located in this zip code:
SOLUTIONS OF IROQUIS COUNTY IN (200 N MAPLE in CRESCENT CITY, IL; small business)
$5,684 with Navy for Motor Freight. Signed on 2004-12-09. Completion date: 2004-12-20.
Top industries in this zip code by the number of employees in 2005:
Construction: Poured Concrete Foundation and Structure Contractors (10-19: 1)
Construction: Site Preparation Contractors (5-9: 1)
Health Care and Social Assistance: Offices of Dentists (5-9: 1)
Construction: New Single-Family Housing Construction (except Operative Builders) (1-4: 2)
Construction: Painting and Wall Covering Contractors (1-4: 2)
2002 - 2018 National Fire Incident Reporting System (NFIRS) incidents
According to the data from the years 2002 - 2018 the average number of fire incidents per year is 6. The highest number of reported fire incidents - 12 took place in 2011, and the least - 0 in 2005. The data has a declining trend.
When looking into fire subcategories, the most reports belonged to: Outside Fires (44.8%), and Structure Fires (21.9%).
Fire incident types reported to NFIRS in Zip Code 60928


 Nearest zip codes: 60974, 60970, 60955, 60938, 60930, 60926.


 According to the data from the years 2002 - 2018 the average number of fire incidents per year is 6. The highest number of reported fire incidents - 12 took place in 2011, and the least - 0 in 2005. The data has a declining trend.
 When looking into fire subcategories, the most reports belonged to: Outside Fires (44.8%), and Structure Fires (21.9%).