Estimated zip code population in 2022: 1,461 Zip code population in 2010: 1,432 Zip code population in 2000: 1,469
Houses and condos: 737 Renter-occupied apartments: 89
% of renters here:
15%
State:
33%
March 2022 cost of living index in zip code 61060: 83.9 (less than average, U.S. average is 100)
Land area: 36.2 sq. mi. Water area: 0.0 sq. mi.
Population density: 40 people per square mile
(very low).
OSM Map
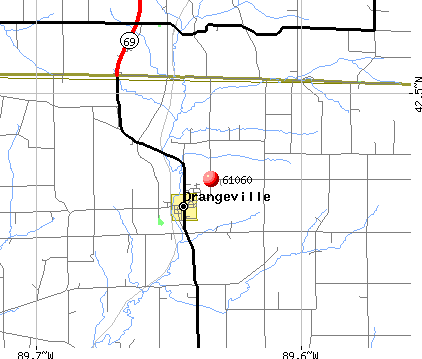
General Map
Google Map
MSN Map
OSM Map
General Map
Google Map
MSN Map
OSM Map
General Map
Google Map
MSN Map
OSM Map
General Map
Google Map
MSN Map
Please wait while loading the map...
Real estate property taxes paid for housing units in 2022:
This zip code:
2.0% ($3,087)
Illinois:
2.0% ($4,912)
Median real estate property taxes paid for housing units with mortgages in 2022: $3,043 (2.0%) Median real estate property taxes paid for housing units with no mortgage in 2022: $3,154 (2.0%)
Business Search- 14 Million verified businesses
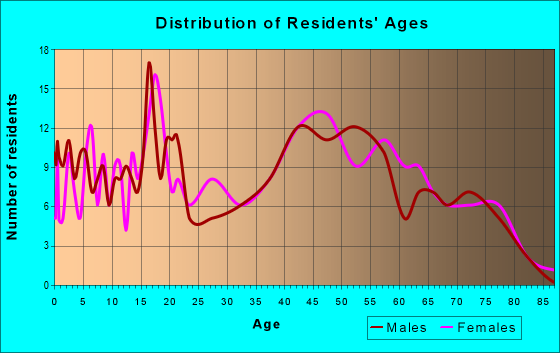
Males: 782
(53.5%)
Females: 679
(46.5%)
For population 25 years and over in 61060:
High school or higher: 93.9%
Bachelor's degree or higher: 16.2%
Graduate or professional degree: 3.3%
Unemployed: 7.6%
Mean travel time to work (commute): 21.8 minutes
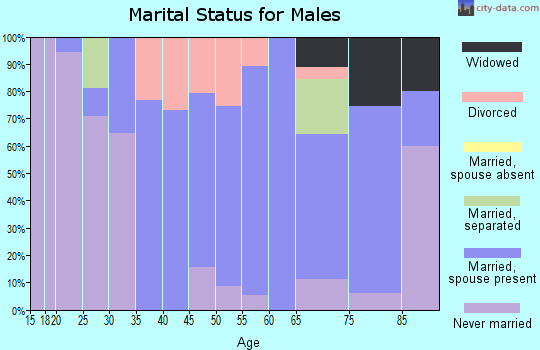
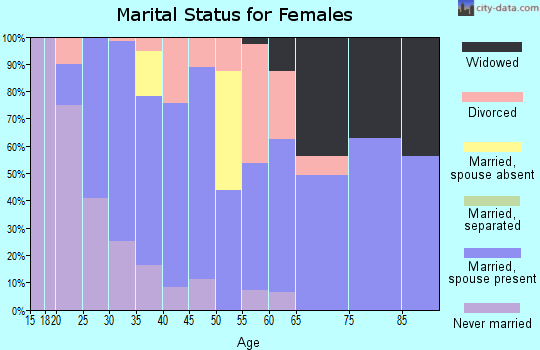
For population 15 years and over in 61060:
Never married: 31.2%
Now married: 53.2%
Separated: 0.7%
Widowed: 3.4%
Divorced: 11.5%
Zip code 61060 compared to state average:
Median house value below state average.
Black race population percentage significantly below state average.
Hispanic race population percentage significantly below state average.
Median age above state average.
Foreign-born population percentage significantly below state average.
Renting percentage significantly below state average.
Length of stay since moving in above state average.
Percentage of population with a bachelor's degree or higher significantly below state average.
Estimated median house/condo value in 2022: $157,842
61060:
$157,842
Illinois:
$251,600
According to our research of Illinois and other state lists, there were 2 registered sex offenders living in 61060 zip code as of May 02, 2024. The ratio of all residents to sex offenders in zip code 61060 is 747 to 1. The ratio of registered sex offenders to all residents in this zip code is near the state average.
Median resident age:
This zip code:
43.6 years
Illinois median age:
39.1 years
Average household size:
This zip code:
2.4 people
Illinois:
2.4 people
Averages for the 2020 tax year for zip code 61060, filed in 2021:
Average Adjusted Gross Income (AGI) in 2020: $54,342 (Individual Income Tax Returns)
Here:
$54,342
State:
$82,626
Salary/wage: $47,193 (reported on 79.7% of returns)
Here:
$47,193
State:
$66,640
(% of AGI for various income ranges: 1231.7% for AGIs below $25k, 3203.1% for AGIs $25k-50k, 6565.0% for AGIs $50k-75k, 8115.0% for AGIs $75k-100k, 15386.7% for AGIs $100k-200k)
Taxable interest for individuals: $1,369 (reported on 37.7% of returns)
This zip code:
$1,369
Illinois:
$2,376
(% of AGI for various income ranges: 38.3% for AGIs below $25k, 53.8% for AGIs $25k-50k, 51.2% for AGIs $50k-75k, 26.7% for AGIs $75k-100k, 278.3% for AGIs $100k-200k)
Ordinary dividends: $1,838 (reported on 18.8% of returns)
Here:
$1,838
State:
$9,061
(% of AGI for various income ranges: 30.0% for AGIs below $25k, 40.6% for AGIs $25k-50k, 60.0% for AGIs $50k-75k, 150.0% for AGIs $100k-200k)
Net capital gain/loss in AGI: +$4,870 (reported on 14.5% of returns)
Here:
+$4,870
State:
+$31,684
(% of AGI for various income ranges: 29.4% for AGIs $25k-50k, 107.5% for AGIs $50k-75k, 590.0% for AGIs $100k-200k)
Profit/loss from business: +$9,562 (reported on 11.6% of returns)
Here:
+$9,562
State:
+$12,175
(% of AGI for various income ranges: 120.0% for AGIs below $25k, 99.4% for AGIs $25k-50k, 770.0% for AGIs $75k-100k)
Taxable individual retirement arrangement distribution: $10,488 (reported on 11.6% of returns)
61060:
$10,488
Illinois:
$21,613
(% of AGI for various income ranges: 299.4% for AGIs $25k-50k, 600.0% for AGIs $75k-100k)
Earned income credit: $2,375 (reported on 11.6% of returns)
Here:
$2,375
State:
$2,311
(% of AGI for various income ranges: 89.2% for AGIs below $25k, 51.9% for AGIs $25k-50k)
Percentage of individuals using paid preparers for their 2020 taxes: 94.2%
Here:
94%
State:
93%
(% for various income ranges: 90.0% for AGIs below $25k, 100.0% for AGIs $25k-50k, 91.7% for AGIs $50k-75k, 87.5% for AGIs $75k-100k, 100.0% for AGIs $100k-200k)
Averages for the 2012 tax year for zip code 61060, filed in 2013:
Average Adjusted Gross Income (AGI) in 2012: $46,554 (Individual Income Tax Returns)
Here:
$46,554
State:
$68,058
Salary/wage: $37,083 (reported on 83.3% of returns)
Here:
$37,083
State:
$55,396
(% of AGI for various income ranges: 72.4% for AGIs below $25k, 74.9% for AGIs $25k-50k, 73.9% for AGIs $50k-75k, 79.7% for AGIs $75k-100k, 41.0% for AGIs $100k-200k)
Taxable interest for individuals: $1,816 (reported on 43.1% of returns)
This zip code:
$1,816
Illinois:
$1,969
(% of AGI for various income ranges: 2.9% for AGIs below $25k, 1.5% for AGIs $25k-50k, 1.1% for AGIs $50k-75k, 0.6% for AGIs $75k-100k, 2.7% for AGIs $100k-200k)
Ordinary dividends: $1,100 (reported on 19.4% of returns)
Here:
$1,100
State:
$7,786
(% of AGI for various income ranges: 1.0% for AGIs below $25k, 0.2% for AGIs $25k-50k, 0.8% for AGIs $50k-75k, 0.4% for AGIs $100k-200k)
Net capital gain/loss in AGI: +$1,864 (reported on 15.3% of returns)
Here:
+$1,864
State:
+$22,183
(% of AGI for various income ranges: 1.8% for AGIs $25k-50k, 0.8% for AGIs $50k-75k, 0.5% for AGIs $100k-200k)
Profit/loss from business: +$6,800 (reported on 13.9% of returns)
Here:
+$6,800
State:
+$12,903
(% of AGI for various income ranges: 5.7% for AGIs below $25k, 5.0% for AGIs $25k-50k, 2.6% for AGIs $75k-100k)
Taxable individual retirement arrangement distribution: $9,250 (reported on 11.1% of returns)
61060:
$9,250
Illinois:
$17,929
(% of AGI for various income ranges: 3.9% for AGIs below $25k, 3.0% for AGIs $50k-75k, 5.1% for AGIs $75k-100k)
Total itemized deductions: $17,124 (23% of AGI, reported on 23.6% of returns)
Here:
$17,124
State:
$26,433
Here:
23.1% of AGI
State:
19.2% of AGI
(% of AGI for various income ranges: 8.6% for AGIs below $25k, 7.3% for AGIs $25k-50k, 8.2% for AGIs $50k-75k, 10.7% for AGIs $75k-100k, 8.5% for AGIs $100k-200k)
Charity contributions: $2,677 (reported on 18.1% of returns)
Here:
$2,677
State:
$4,525
(% of AGI for various income ranges: 2.1% for AGIs below $25k, 1.1% for AGIs $50k-75k, 0.7% for AGIs $75k-100k, 1.5% for AGIs $100k-200k)
Taxes paid: $6,553 (reported on 23.6% of returns)
61060:
$6,553
State:
$11,968
(% of AGI for various income ranges: 1.9% for AGIs below $25k, 2.3% for AGIs $25k-50k, 2.8% for AGIs $50k-75k, 5.1% for AGIs $75k-100k, 3.6% for AGIs $100k-200k)
Earned income credit: $2,100 (reported on 11.1% of returns)
Here:
$2,100
State:
$2,349
(% of AGI for various income ranges: 3.4% for AGIs below $25k, 0.8% for AGIs $25k-50k)
Percentage of individuals using paid preparers for their 2012 taxes: 65.3%
Here:
65%
State:
57%
(% for various income ranges: 55.2% for AGIs below $25k, 75.0% for AGIs $25k-50k, 69.2% for AGIs $50k-75k, 75.0% for AGIs $75k-100k, 66.7% for AGIs $100k-200k)
Averages for the 2004 tax year for zip code 61060, filed in 2005:
Average Adjusted Gross Income (AGI) in 2004: $37,761 (Individual Income Tax Returns)
Here:
$37,761
State:
$54,625
Salary/wage: $34,517 (reported on 82.9% of returns)
Here:
$34,517
State:
$46,811
(% of AGI for various income ranges: 145.2% for AGIs below $10k, 68.0% for AGIs $10k-25k, 76.0% for AGIs $25k-50k, 83.9% for AGIs $50k-75k, 84.5% for AGIs $75k-100k, 39.4% for AGIs over 100k)
Taxable interest for individuals: $1,857 (reported on 56.6% of returns)
This zip code:
$1,857
Illinois:
$2,101
(% of AGI for various income ranges: 16.7% for AGIs below $10k, 6.7% for AGIs $10k-25k, 2.6% for AGIs $25k-50k, 1.6% for AGIs $50k-75k, 2.3% for AGIs $75k-100k, 2.0% for AGIs over 100k)
Taxable dividends: $691 (reported on 23.5% of returns)
Here:
$691
State:
$4,306
(% of AGI for various income ranges: 2.5% for AGIs below $10k, 0.4% for AGIs $10k-25k, 1.0% for AGIs $25k-50k, 0.1% for AGIs $50k-75k, 0.2% for AGIs $75k-100k, 0.2% for AGIs over 100k)
Net capital gain/loss: +$5,625 (reported on 18.3% of returns)
Here:
+$5,625
State:
+$17,321
(% of AGI for various income ranges: 3.3% for AGIs below $10k, 1.0% for AGIs $10k-25k, 1.5% for AGIs $25k-50k, 1.6% for AGIs $50k-75k, 12.4% for AGIs over 100k)
Profit/loss from business: +$1,627 (reported on 14.8% of returns)
Here:
+$1,627
State:
+$11,771
(% of AGI for various income ranges: -18.8% for AGIs below $10k, 5.0% for AGIs $10k-25k, 0.2% for AGIs $25k-50k, 0.2% for AGIs $50k-75k, 2.4% for AGIs $75k-100k)
IRA payment deduction: $2,739 (reported on 3.1% of returns)
61060:
$2,739
Illinois:
$3,087
Total itemized deductions: $14,589 (23% of AGI, reported on 23.5% of returns)
Here:
$14,589
State:
$20,239
Here:
22.5% of AGI
State:
19.5% of AGI
(% of AGI for various income ranges: 8.2% for AGIs $10k-25k, 8.8% for AGIs $25k-50k, 9.3% for AGIs $50k-75k, 11.6% for AGIs $75k-100k, 7.8% for AGIs over 100k)
Charity contributions deductions: $2,305 (3% of AGI, reported on 19.0% of returns)
Here:
$2,305
State:
$3,719
Here:
3.4% of AGI
State:
3.4% of AGI
(% of AGI for various income ranges: 1.4% for AGIs below $10k, 0.9% for AGIs $25k-50k, 1.3% for AGIs $50k-75k, 1.3% for AGIs $75k-100k, 1.8% for AGIs over 100k)
Total tax: $4,225 (reported on 79.3% of returns)
61060:
$4,225
State:
$9,882
(% of AGI for various income ranges: 4.6% for AGIs below $10k, 4.5% for AGIs $10k-25k, 6.7% for AGIs $25k-50k, 7.9% for AGIs $50k-75k, 10.3% for AGIs $75k-100k, 16.9% for AGIs over 100k)
Earned income credit: $1,603 (reported on 10.5% of returns)
Here:
$1,603
State:
$1,788
Percentage of individuals using paid preparers for their 2004 taxes: 65.1%
Here:
65%
State:
61%
(% for various income ranges: 57.0% for AGIs below $10k, 61.6% for AGIs $10k-25k, 73.4% for AGIs $25k-50k, 62.7% for AGIs $50k-75k, 66.7% for AGIs $75k-100k, 84.0% for AGIs over 100k)
Household received Food Stamps/SNAP in the past 12 months: 46 Household did not receive Food Stamps/SNAP in the past 12 months: 559
Women who had a birth in the past 12 months: 13 (1 now married, 11 unmarried) Women who did not have a birth in the past 12 months: 309 (158 now married, 150 unmarried)
Housing units in zip code 61060 with a mortgage: 294 (30 second mortgage, 8 home equity loan, 16 both second mortgage and home equity loan) Houses without a mortgage: 3
Median monthly owner costs for units with a mortgage: $1,403 Median monthly owner costs for units without a mortgage: $620
Residents with income below the poverty level in 2022:
This zip code:
9.4%
Whole state:
11.9%
Residents with income below 50% of the poverty level in 2022:
This zip code:
5.5%
Whole state:
5.7%
Median number of rooms in houses and condos:
Here:
6.8
State:
6.4
Median number of rooms in apartments:
Here:
4.2
State:
4.1
Notable locations in this zip code not listed on our city pages
Cemeteries: Oneco Cemetery (1), Saint James Cemetery (2), Shippy Salem Cemetery (3), Eldorado Cemetery (4), Orangeville Cemetery (5), Union Cemetery (6). Display/hide their locations on the map
Size of family households: 169 2-persons, 67 3-persons, 96 4-persons, 23 5-persons, 30 6-persons
Size of nonfamily households: 196 1-person, 28 2-persons
223 married couples with children.
89 single-parent households (13 men, 76 women).
98.8% of residents of 61060 zip code speak English at home.
0.2% of residents speak Spanish at home (67% very well, 33% not well).
0.3% of residents speak other Indo-European language at home (100% very well).
Foreign born population: 0 (0.0%)
:
0.0%
Whole state:
14.4%
61%German
22%American
4%English
4%Norwegian
2%Polish
1%Irish
1%British
Year of entry for the foreign-born population
02010 or later
02000 to 2009
01990 to 1999
2Before 1990
Facilities with environmental interests located in this zip code:
ORANGEVILLE JR HIGH SCHOOL (201 S ORANGE in ORANGEVILLE, IL)
(Geographic Names Information System) (National Center for Education Statistics) - STATE ID-0808920301001 (National Center for Education Statistics) - STATE ID-0808920300001 Organizations: ORANGEVILLE C U SCHOOL DIST 203 (SCHOOL DISTRICT)
ORANGEVILLE COMMUNITY UNIT SCHOOL DISTRICT 203 (310 SOUTH EAST STREET in ORANGEVILLE, IL)
(Integrated Compliance Information System) - ICIS-05-1987-0089, FORMAL ENFORCEMENT ACTION COMPLIANCE ACTIVITY (Tracking inspections of insecticide, fungicide, and rodenticide, and toxic substances) Alternative names: ORANGEVILLE COMM UNIT SCHOOL D, ORANGEVILLE CU SCH DIST 203, ORANGEVILLE CUSD 203, ORANGEVILLE S.U.S.D. #203
CONMAT INC (ST JAMES RD in ORANGEVILLE, IL)
STATE MASTER (Illinois EPA Project) - AIR PROGRAM AIR MINOR (AIRS/AFS) CRITERIA AND HAZARDOUS AIR POLLUTANT INVENTORY (Inventory of air pollution sources) Business SIC classification: CRUSHED AND BROKEN LIMESTONE
ORANGEVILLE WWTP (455 WEST HIGH STREET in ORANGEVILLE, IL)
STATE MASTER (Illinois EPA Project) - National Pollutant Discharge Elimination System Permit National Pollutant Discharge Elimination System NON-MAJOR (Tracking pollutant discharge elimination systems) - permit Business SIC classification: SEWERAGE SYSTEMS Alternative names: ORANGEVILLE WWTP, VILLAGE OF
BOWEN OIL CO (WEST ORANGEVILLE RD in ORANGEVILLE, IL)
STATE MASTER (Illinois EPA Project) - AIR PROGRAM AIR MINOR (AIRS/AFS) Business SIC classification: PETROLEUM BULK STATIONS AND TERMINALS
BOWEN OIL CO (200 EWING RD in ORANGEVILLE, IL)
STATE MASTER (Illinois EPA Project) - AIR PROGRAM AIR MINOR (AIRS/AFS) Business SIC classification: PETROLEUM BULK STATIONS AND TERMINALS
REES CONSTRUCTION CO-SHEELY QUARRY (SECTION 1 - BUCKEYE TWP in ORANGEVILLE, IL)
STATE MASTER (Illinois EPA Project) - AIR PROGRAM AIR MINOR (AIRS/AFS) Business SIC classification: NONCLASSIFIABLE ESTABLISHMENTS
ORANGEVILLE ELEM SCHOOL (310 S EAST ST in ORANGEVILLE, IL)
(National Center for Education Statistics) - STATE ID-0808920302003 Organizations: ORANGEVILLE C U SCHOOL DIST 203 (SCHOOL DISTRICT)
ORANGEVILLE STP (MILL STREET in ORANGEVILLE, IL)
National Pollutant Discharge Elimination System NON-MAJOR (Tracking pollutant discharge elimination systems) - permit Business SIC classification: SEWERAGE SYSTEMS Alternative names: ORANGEVILLE, VILLAGE OF
ORANGEVILLE HIGH SCHOOL (211 SOUTH EAST ST in ORANGEVILLE, IL)
Small Quantity Generators, between 100 kg and 1000 kg of hazardous waste/month (Resource Conservation and Recovery Act (tracking hazardous waste)) - notification Organizations: ORANGEVILLE CUSD #203 (CONTACT/OWNER)
Housing units lacking complete kitchen facilities: 2.1%
57.6%Utility gas
19.4%Bottled, tank, or LP gas
15.2%Electricity
3.5%Fuel oil, kerosene, etc.
3.5%Wood
1.2%Other fuel
Population in 1990: 1,318. Population change in the 1990s: +151 (+11.5%).
Place of birth for U.S.-born residents:
This state: 891
Northeast: 26
Midwest: 523
South: 16
West: 4
64% of the 61060 zip code residents lived in the same house 5 years ago. Out of people who lived in different houses, 64% lived in this county. Out of people who lived in different counties, 50% lived in Illinois.
94% of the 61060 zip code residents lived in the same house 1 year ago. Out of people who lived in different houses, 32% moved from this county. Out of people who lived in different houses, 15% moved from different county within same state. Out of people who lived in different houses, 58% moved from different state.
Private vs. public school enrollment:
Students in private schools in grades 1 to 8 (elementary and middle school): 4
Here:
3.8%
Illinois:
13.3%
Students in private schools in grades 9 to 12 (high school): 10
Here:
10.8%
Illinois:
9.9%
Students in private undergraduate colleges:
Here:
0.0%
Illinois:
27.4%
Occupation by median earnings in the past 12 months ($)
64,672Computer and mathematical occupations
63,522Construction and extraction occupations
61,703Business and financial operations occupations
59,603Health diagnosing and treating practitioners and other technical occupations
55,297Production occupations
52,484Installation, maintenance, and repair occupations
Top industries in this zip code by the number of employees in 2005:
Other Services (except Public Administration): Religious Organizations (5-9 employees: 1 establishment, 1-4 employees: 1 establishment)
Accommodation and Food Services: Full-Service Restaurants (5-9: 1)
Professional, Scientific, and Technical Services: Veterinary Services (5-9: 1)
Health Care and Social Assistance: Offices of Dentists (5-9: 1)
Finance and Insurance: Commercial Banking (5-9: 1)
Finance and Insurance: Insurance Agencies and Brokerages (5-9: 1)
Fatal accident statistics in 2011:
Fatal accident count: 2
Vehicles involved in fatal accidents: 2
Fatal accidents caused by drunken drivers: 1
Fatalities: 2
Persons involved in fatal accidents: 2
Pedestrians involved in fatal accidents: 1
2002 - 2018 National Fire Incident Reporting System (NFIRS) incidents
According to the data from the years 2002 - 2018 the average number of fires per year is 9. The highest number of reported fire incidents - 23 took place in 2012, and the least - 0 in 2004. The data has an increasing trend.
When looking into fire subcategories, the most incidents belonged to: Structure Fires (42.9%), and Outside Fires (40.4%).
Fire incident types reported to NFIRS in Zip Code 61060


 Nearest zip codes: 61018, 61013, 61050, 53566, 53550, 61032.


 According to the data from the years 2002 - 2018 the average number of fires per year is 9. The highest number of reported fire incidents - 23 took place in 2012, and the least - 0 in 2004. The data has an increasing trend.
 When looking into fire subcategories, the most incidents belonged to: Structure Fires (42.9%), and Outside Fires (40.4%).