Estimated zip code population in 2022: 803 Zip code population in 2010: 897 Zip code population in 2000: 1,007
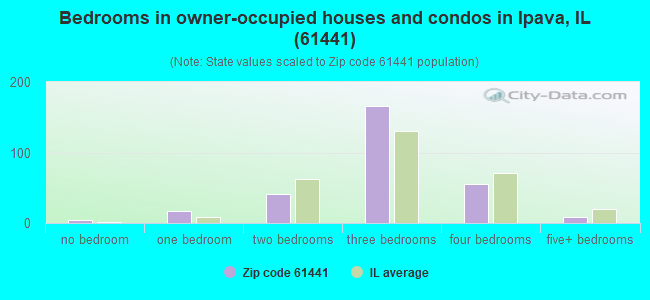
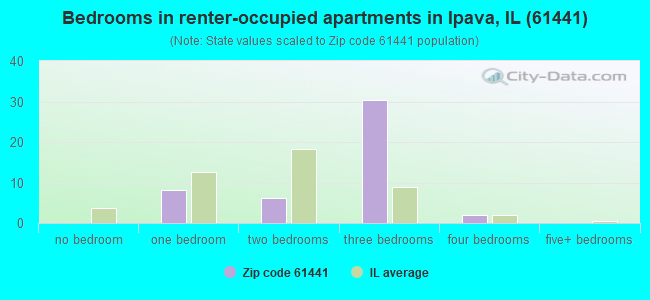
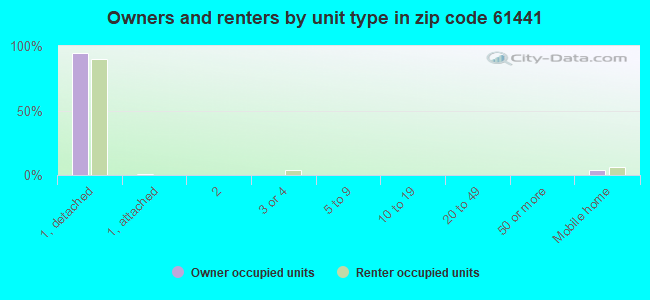
Houses and condos: 404 Renter-occupied apartments: 48
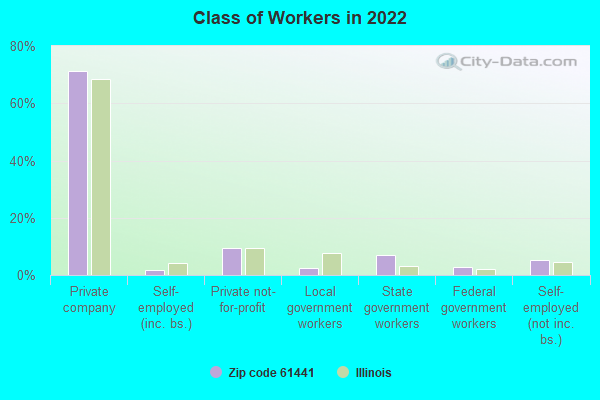
% of renters here:
14%
State:
33%
March 2022 cost of living index in zip code 61441: 84.2 (less than average, U.S. average is 100)
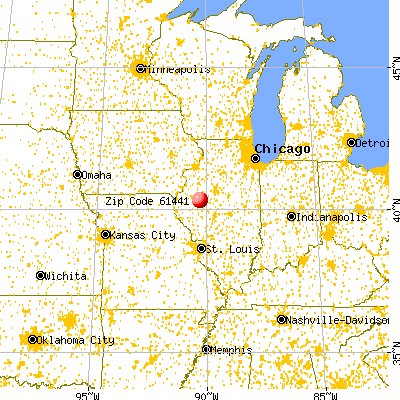
Land area: 61.3 sq. mi. Water area: 0.0 sq. mi.
Population density: 13 people per square mile
(very low).
OSM Map
General Map
Google Map
MSN Map
OSM Map
General Map
Google Map
MSN Map
OSM Map
General Map
Google Map
MSN Map
OSM Map
General Map
Google Map
MSN Map
Please wait while loading the map...
Real estate property taxes paid for housing units in 2022:
This zip code:
1.8% ($1,786)
Illinois:
2.0% ($4,912)
Median real estate property taxes paid for housing units with mortgages in 2022: $2,779 (2.1%) Median real estate property taxes paid for housing units with no mortgage in 2022: $1,305 (1.5%)
Business Search- 14 Million verified businesses
Males: 426
(53.0%)
Females: 377
(47.0%)
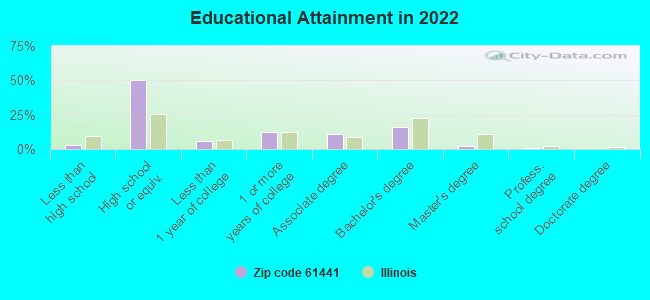
For population 25 years and over in 61441:
High school or higher: 96.1%
Bachelor's degree or higher: 18.3%
Graduate or professional degree: 2.7%
Unemployed: 7.3%
Mean travel time to work (commute): 28.8 minutes
For population 15 years and over in 61441:
Never married: 24.0%
Now married: 62.7%
Separated: 0.8%
Widowed: 6.3%
Divorced: 6.1%
Zip code 61441 compared to state average:
Median house value significantly below state average.
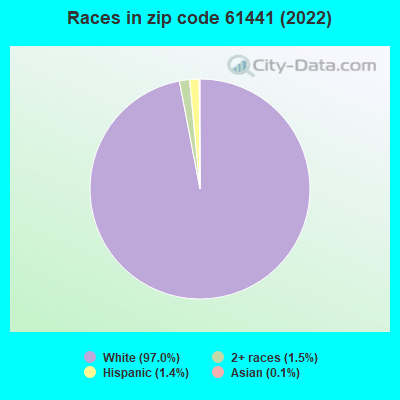
Black race population percentage significantly below state average.
Hispanic race population percentage significantly below state average.
Foreign-born population percentage significantly below state average.
Renting percentage significantly below state average.
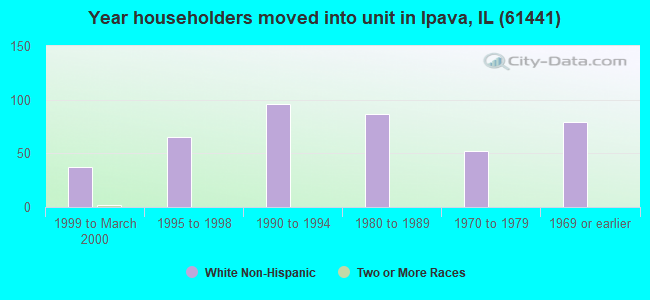
Length of stay since moving in significantly above state average.
Number of college students below state average.
Percentage of population with a bachelor's degree or higher below state average.
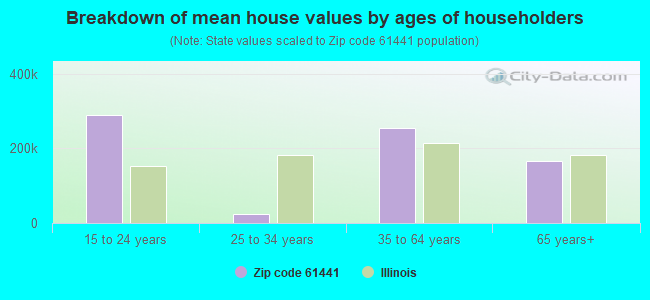
Estimated median house/condo value in 2022: $101,755
61441:
$101,755
Illinois:
$251,600
According to our research of Illinois and other state lists, there was 1 registered sex offender living in 61441 zip code as of May 06, 2024. The ratio of all residents to sex offenders in zip code 61441 is 1,142 to 1. The ratio of registered sex offenders to all residents in this zip code is lower than the state average.
Median resident age:
This zip code:
40.0 years
Illinois median age:
39.1 years
Average household size:
This zip code:
2.4 people
Illinois:
2.4 people
Averages for the 2020 tax year for zip code 61441, filed in 2021:
Average Adjusted Gross Income (AGI) in 2020: $53,990 (Individual Income Tax Returns)
Here:
$53,990
State:
$82,626
Salary/wage: $44,600 (reported on 72.5% of returns)
Here:
$44,600
State:
$66,640
(% of AGI for various income ranges: 1066.7% for AGIs below $25k, 3237.1% for AGIs $25k-50k, 5497.5% for AGIs $50k-75k, 7672.5% for AGIs $75k-100k, 14800.0% for AGIs $100k-200k)
Taxable interest for individuals: $678 (reported on 45.0% of returns)
This zip code:
$678
Illinois:
$2,376
(% of AGI for various income ranges: 11.1% for AGIs below $25k, 40.0% for AGIs $25k-50k, 65.0% for AGIs $50k-75k, 70.0% for AGIs $75k-100k, 100.0% for AGIs $100k-200k)
Ordinary dividends: $2,340 (reported on 12.5% of returns)
Here:
$2,340
State:
$9,061
(% of AGI for various income ranges: 190.0% for AGIs $50k-75k, 136.7% for AGIs $100k-200k)
Net capital gain/loss in AGI: +$5,160 (reported on 12.5% of returns)
Here:
+$5,160
State:
+$31,684
(% of AGI for various income ranges: 462.5% for AGIs $50k-75k, 243.3% for AGIs $100k-200k)
Profit/loss from business: +$2,500 (reported on 12.5% of returns)
Here:
+$2,500
State:
+$12,175
(% of AGI for various income ranges: 178.6% for AGIs $25k-50k)
Taxable individual retirement arrangement distribution: $10,280 (reported on 12.5% of returns)
61441:
$10,280
Illinois:
$21,613
(% of AGI for various income ranges: 1285.0% for AGIs $50k-75k)
Earned income credit: $2,580 (reported on 12.5% of returns)
Here:
$2,580
State:
$2,311
(% of AGI for various income ranges: 143.3% for AGIs below $25k)
Percentage of individuals using paid preparers for their 2020 taxes: 92.5%
Here:
92%
State:
93%
(% for various income ranges: 92.3% for AGIs below $25k, 100.0% for AGIs $25k-50k, 100.0% for AGIs $50k-75k, 83.3% for AGIs $75k-100k, 83.3% for AGIs $100k-200k)
Averages for the 2012 tax year for zip code 61441, filed in 2013:
Average Adjusted Gross Income (AGI) in 2012: $50,677 (Individual Income Tax Returns)
Here:
$50,677
State:
$68,058
Salary/wage: $37,462 (reported on 79.1% of returns)
Here:
$37,462
State:
$55,396
(% of AGI for various income ranges: 62.1% for AGIs below $25k, 66.4% for AGIs $25k-50k, 75.6% for AGIs $50k-75k, 73.0% for AGIs $75k-100k, 35.6% for AGIs $100k-200k)
Taxable interest for individuals: $705 (reported on 44.2% of returns)
This zip code:
$705
Illinois:
$1,969
(% of AGI for various income ranges: 1.4% for AGIs below $25k, 1.1% for AGIs $25k-50k, 0.6% for AGIs $50k-75k, 0.6% for AGIs $75k-100k, 0.2% for AGIs $100k-200k)
Ordinary dividends: $1,014 (reported on 16.3% of returns)
Here:
$1,014
State:
$7,786
(% of AGI for various income ranges: 0.6% for AGIs below $25k, 0.2% for AGIs $25k-50k, 1.1% for AGIs $75k-100k)
Net capital gain/loss in AGI: +$18,880 (reported on 11.6% of returns)
Here:
+$18,880
State:
+$22,183
Profit/loss from business: +$6,267 (reported on 14.0% of returns)
Here:
+$6,267
State:
+$12,903
Taxable individual retirement arrangement distribution: $7,350 (reported on 9.3% of returns)
61441:
$7,350
Illinois:
$17,929
Total itemized deductions: $19,567 (23% of AGI, reported on 14.0% of returns)
Here:
$19,567
State:
$26,433
Here:
22.9% of AGI
State:
19.2% of AGI
Charity contributions: $1,500 (reported on 7.0% of returns)
Here:
$1,500
State:
$4,525
Taxes paid: $5,300 (reported on 14.0% of returns)
61441:
$5,300
State:
$11,968
Earned income credit: $2,120 (reported on 11.6% of returns)
Here:
$2,120
State:
$2,349
(% of AGI for various income ranges: 5.1% for AGIs below $25k)
Percentage of individuals using paid preparers for their 2012 taxes: 69.8%
Here:
70%
State:
57%
(% for various income ranges: 64.7% for AGIs below $25k, 54.5% for AGIs $25k-50k, 83.3% for AGIs $50k-75k, 80.0% for AGIs $75k-100k, 100.0% for AGIs $100k-200k)
Averages for the 2004 tax year for zip code 61441, filed in 2005:
Average Adjusted Gross Income (AGI) in 2004: $34,019 (Individual Income Tax Returns)
Here:
$34,019
State:
$54,625
Salary/wage: $32,497 (reported on 73.7% of returns)
Here:
$32,497
State:
$46,811
(% of AGI for various income ranges: 95.6% for AGIs below $10k, 60.5% for AGIs $10k-25k, 69.1% for AGIs $25k-50k, 73.6% for AGIs $50k-75k, 71.2% for AGIs $75k-100k)
Taxable interest for individuals: $1,377 (reported on 58.4% of returns)
This zip code:
$1,377
Illinois:
$2,101
(% of AGI for various income ranges: 12.3% for AGIs below $10k, 4.3% for AGIs $10k-25k, 2.3% for AGIs $25k-50k, 1.7% for AGIs $50k-75k, 1.3% for AGIs $75k-100k)
Taxable dividends: $989 (reported on 22.2% of returns)
Here:
$989
State:
$4,306
(% of AGI for various income ranges: 5.1% for AGIs below $10k, 0.2% for AGIs $10k-25k, 0.5% for AGIs $25k-50k, 0.3% for AGIs $50k-75k, 1.1% for AGIs $75k-100k)
Net capital gain/loss: +$889 (reported on 15.1% of returns)
Here:
+$889
State:
+$17,321
(% of AGI for various income ranges: 0.8% for AGIs $10k-25k, 0.3% for AGIs $25k-50k, 0.3% for AGIs $50k-75k, 0.4% for AGIs $75k-100k)
Profit/loss from business: +$2,477 (reported on 15.6% of returns)
Here:
+$2,477
State:
+$11,771
(% of AGI for various income ranges: 5.8% for AGIs below $10k, 6.4% for AGIs $10k-25k, 1.3% for AGIs $25k-50k, -0.8% for AGIs $50k-75k)
Profit/loss from farming: +$3,259 (reported on 13.9% of returns)
Here:
+$3,259
State:
+$2,327
(% of AGI for various income ranges: -39.2% for AGIs below $10k, -4.3% for AGIs $10k-25k, 5.3% for AGIs $25k-50k, 3.6% for AGIs $50k-75k)
Total itemized deductions: $14,220 (30% of AGI, reported on 12.0% of returns)
Here:
$14,220
State:
$20,239
Here:
30.1% of AGI
State:
19.5% of AGI
Charity contributions deductions: $1,429 (3% of AGI, reported on 6.7% of returns)
Here:
$1,429
State:
$3,719
Here:
2.8% of AGI
State:
3.4% of AGI
Total tax: $3,838 (reported on 76.6% of returns)
61441:
$3,838
State:
$9,882
(% of AGI for various income ranges: 2.7% for AGIs below $10k, 4.9% for AGIs $10k-25k, 7.0% for AGIs $25k-50k, 9.1% for AGIs $50k-75k, 13.0% for AGIs $75k-100k)
Earned income credit: $1,327 (reported on 11.7% of returns)
Here:
$1,327
State:
$1,788
Percentage of individuals using paid preparers for their 2004 taxes: 68.9%
Here:
69%
State:
61%
(% for various income ranges: 67.9% for AGIs below $10k, 70.8% for AGIs $10k-25k, 68.4% for AGIs $25k-50k, 64.5% for AGIs $50k-75k, 76.5% for AGIs $75k-100k)
Household received Food Stamps/SNAP in the past 12 months: 57 Household did not receive Food Stamps/SNAP in the past 12 months: 283
Women who had a birth in the past 12 months: 2 (0 now married, 2 unmarried) Women who did not have a birth in the past 12 months: 135 (80 now married, 53 unmarried)
Housing units in zip code 61441 with a mortgage: 147 (11 second mortgage, 12 both second mortgage and home equity loan) Median monthly owner costs for units with a mortgage: $1,204 Median monthly owner costs for units without a mortgage: $475
Residents with income below the poverty level in 2022:
This zip code:
17.1%
Whole state:
11.9%
Residents with income below 50% of the poverty level in 2022:
This zip code:
7.9%
Whole state:
5.7%
Median number of rooms in houses and condos:
Here:
6.4
State:
6.4
Median number of rooms in apartments:
Here:
5.4
State:
4.1
Notable locations in this zip code not listed on our city pages
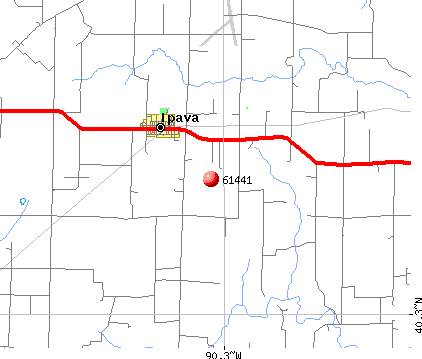
Notable locations in zip code 61441: Fulton County Emergency Medical Association (A), Ipava Fire Protection District (B). Display/hide their locations on the map
Size of family households: 116 2-persons, 51 3-persons, 24 4-persons, 36 5-persons, 3 7-or-more-persons
Size of nonfamily households: 99 1-person, 4 2-persons, 2 3-persons
145 married couples with children.
65 single-parent households (12 men, 53 women).
99.3% of residents of 61441 zip code speak English at home.
0.4% of residents speak other Indo-European language at home (67% very well, 33% not well).
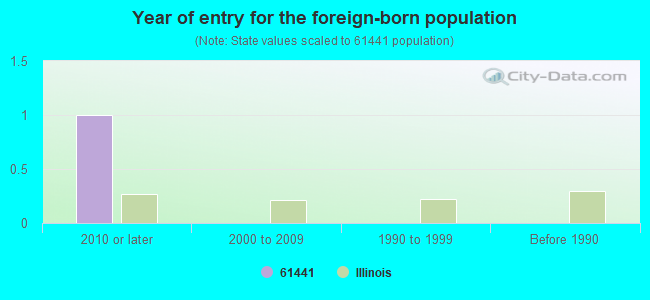
Foreign born population: 2 (0.2%) (50.2% of them are naturalized citizens)
This zip code:
0.2%
Whole state:
14.4%
100%Bhutan
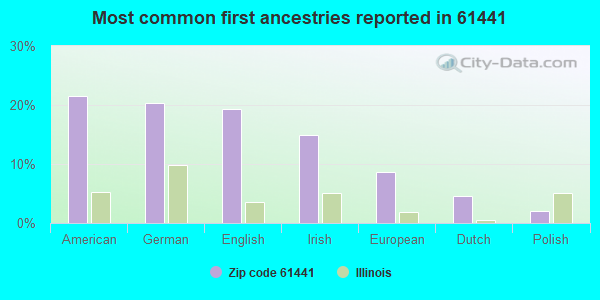
21%American
20%German
19%English
15%Irish
9%European
4%Dutch
2%Polish
Year of entry for the foreign-born population
12010 or later
02000 to 2009
01990 to 1999
0Before 1990
Facilities with environmental interests located in this zip code:
IPAVA (PO BOX 409 in IPAVA, IL)
STATE MASTER (Illinois EPA Project) - DRINKING WATER PROGRAM STATE MASTER (Illinois EPA Project) - National Pollutant Discharge Elimination System Permit National Pollutant Discharge Elimination System NON-MAJOR (Tracking pollutant discharge elimination systems) - permit Business SIC classification: SEWERAGE SYSTEMS Alternative names: IPAVA STP, IPAVA STP, VILLAGE OF
CONTINENTAL GRAIN COMPANY (990 E MAIN in IPAVA, IL)
STATE MASTER (Illinois EPA Project) - SOLID WASTE PROGRAM, HAZARDOUS WASTE PROGRAM Conditionally Exempt Small Quantity Generators, less than 100 kg/month of hazardous waste (Resource Conservation and Recovery Act (tracking hazardous waste)) - notification
Housing units lacking complete plumbing facilities: 2.6% Housing units lacking complete kitchen facilities: 2.7%
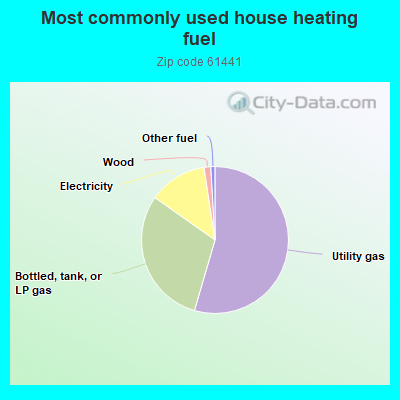
54.8%Utility gas
30.4%Bottled, tank, or LP gas
12.9%Electricity
1.5%Wood
0.9%Other fuel
Population in 1990: 1,152.
Place of birth for U.S.-born residents:
This state: 731
Midwest: 38
South: 16
West: 12
68% of the 61441 zip code residents lived in the same house 5 years ago. Out of people who lived in different houses, 56% lived in this county. Out of people who lived in different counties, 50% lived in Illinois.
98% of the 61441 zip code residents lived in the same house 1 year ago. Out of people who lived in different houses, 70% moved from this county. Out of people who lived in different houses, 30% moved from different county within same state.
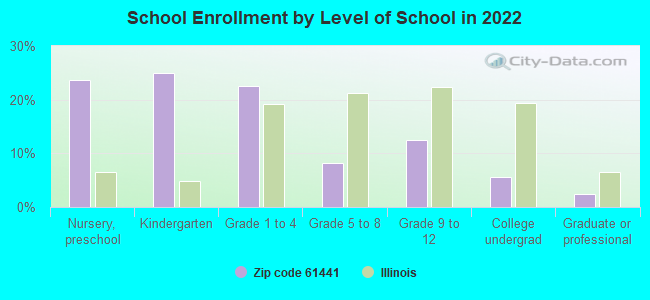
Private vs. public school enrollment:
Students in private schools in grades 1 to 8 (elementary and middle school): 4
Here:
8.4%
Illinois:
13.3%
Students in private schools in grades 9 to 12 (high school):
Here:
0.0%
Illinois:
9.9%
Students in private undergraduate colleges:
Here:
0.0%
Illinois:
27.4%
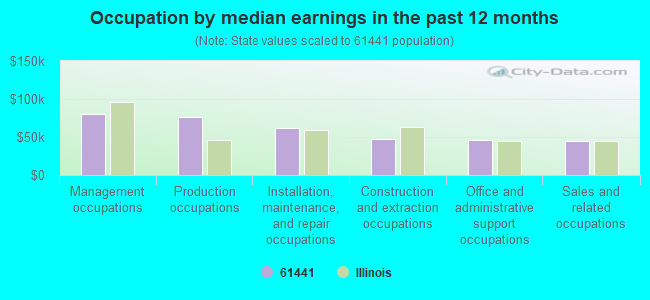
Occupation by median earnings in the past 12 months ($)
79,783Management occupations
76,168Production occupations
61,903Installation, maintenance, and repair occupations
47,091Construction and extraction occupations
46,254Office and administrative support occupations
44,184Sales and related occupations
Top industries in this zip code by the number of employees in 2005:
Wholesale Trade: Grain and Field Bean Merchant Wholesalers (10-19: 1)
Construction: Residential Remodelers (1-4: 3)
Other Services (except Public Administration): Religious Organizations (1-4: 2)
Construction: New Single-Family Housing Construction (except Operative Builders) (1-4: 1)
Finance and Insurance: Insurance Agencies and Brokerages (1-4: 1)
Information: Software Publishers (1-4: 1)
Professional, Scientific, and Technical Services: Building Inspection Services (1-4: 1)
Construction: Plumbing, Heating, and Air-Conditioning Contractors (1-4: 1)
Fatal accident statistics in 2014:
Fatal accident count: 1
Vehicles involved in fatal accidents: 1
Fatal accidents caused by drunken drivers: 0
Fatalities: 1
Persons involved in fatal accidents: 2
Pedestrians involved in fatal accidents: 0
Fatal accident statistics in 2010:
Fatal accident count: 1
Vehicles involved in fatal accidents: 1
Fatal accidents caused by drunken drivers: 0
Fatalities: 1
Persons involved in fatal accidents: 1
Pedestrians involved in fatal accidents: 0
2002 - 2018 National Fire Incident Reporting System (NFIRS) incidents
Based on the data from the years 2002 - 2018 the average number of fires per year is 8. The highest number of fires - 24 took place in 2015, and the least - 1 in 2017. The data has a dropping trend.
When looking into fire subcategories, the most incidents belonged to: Outside Fires (49.3%), and Structure Fires (26.4%).
Fire incident types reported to NFIRS in Zip Code 61441


 Nearest zip codes: 61501, 61482, 61542, 61477, 61484, 61427.


 Based on the data from the years 2002 - 2018 the average number of fires per year is 8. The highest number of fires - 24 took place in 2015, and the least - 1 in 2017. The data has a dropping trend.
 When looking into fire subcategories, the most incidents belonged to: Outside Fires (49.3%), and Structure Fires (26.4%).