Estimated zip code population in 2022: 2,463 Zip code population in 2010: 2,321 Zip code population in 2000: 2,436
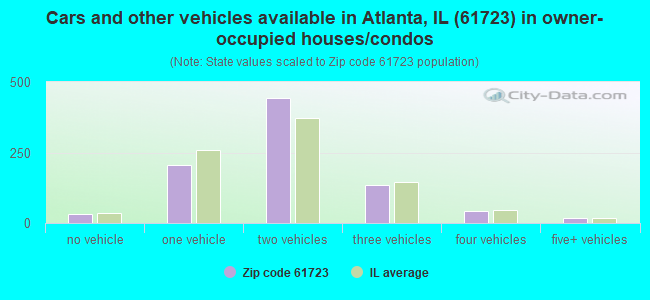
Houses and condos: 1,100 Renter-occupied apartments: 181
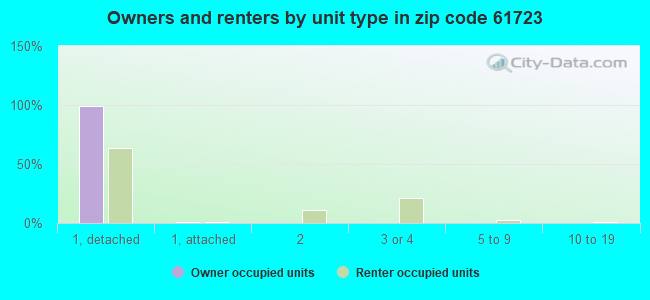
% of renters here:
17%
State:
33%
March 2022 cost of living index in zip code 61723: 84.3 (less than average, U.S. average is 100)
Land area: 64.9 sq. mi. Water area: 0.1 sq. mi.
Population density: 38 people per square mile
(very low).
OSM Map
General Map
Google Map
MSN Map
OSM Map
General Map
Google Map
MSN Map
OSM Map
General Map
Google Map
MSN Map
OSM Map
General Map
Google Map
MSN Map
Please wait while loading the map...
Real estate property taxes paid for housing units in 2022:
This zip code:
1.4% ($2,154)
Illinois:
2.0% ($4,912)
Median real estate property taxes paid for housing units with mortgages in 2022: $2,014 (1.5%) Median real estate property taxes paid for housing units with no mortgage in 2022: $2,401 (1.4%)
Business Search- 14 Million verified businesses
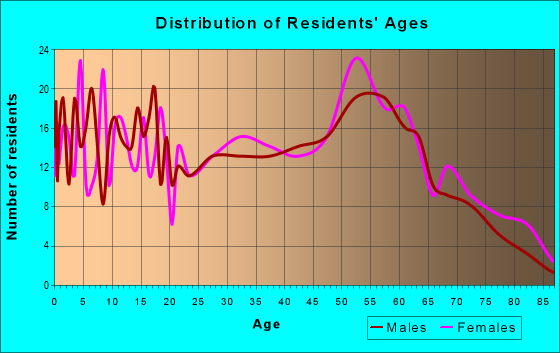
Males: 1,222
(49.6%)
Females: 1,241
(50.4%)
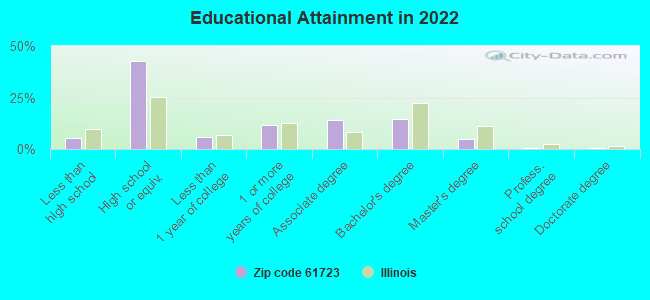
For population 25 years and over in 61723:
High school or higher: 94.2%
Bachelor's degree or higher: 20.1%
Graduate or professional degree: 5.8%
Unemployed: 2.8%
Mean travel time to work (commute): 27.9 minutes
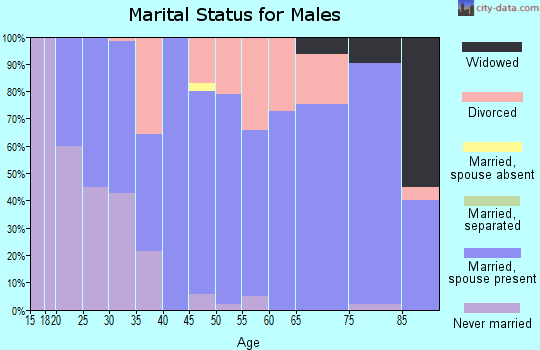
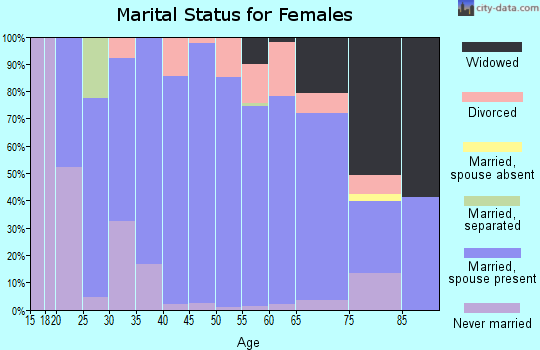
For population 15 years and over in 61723:
Never married: 20.7%
Now married: 62.4%
Separated: 0.2%
Widowed: 6.8%
Divorced: 10.0%
Zip code 61723 compared to state average:
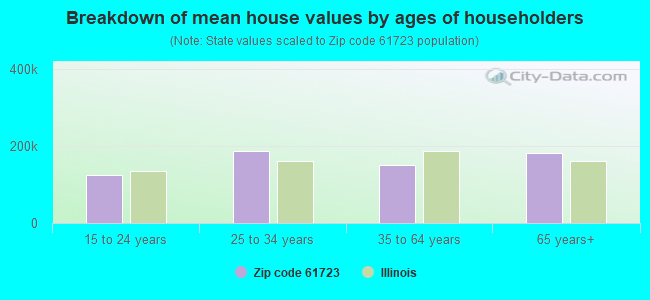
Median house value below state average.
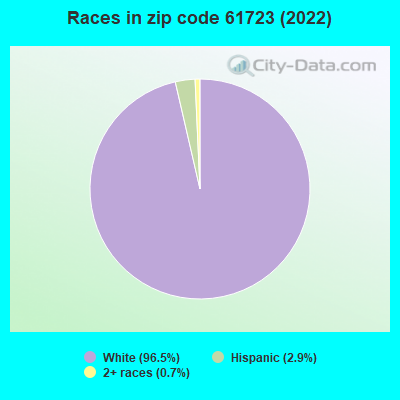
Black race population percentage significantly below state average.
Hispanic race population percentage significantly below state average.
Foreign-born population percentage significantly below state average.
Renting percentage below state average.
Percentage of population with a bachelor's degree or higher below state average.
Averages for the 2020 tax year for zip code 61723, filed in 2021:
Average Adjusted Gross Income (AGI) in 2020: $60,771 (Individual Income Tax Returns)
Here:
$60,771
State:
$82,626
Salary/wage: $50,051 (reported on 79.1% of returns)
Here:
$50,051
State:
$66,640
(% of AGI for various income ranges: 1073.5% for AGIs below $25k, 3234.8% for AGIs $25k-50k, 5463.6% for AGIs $50k-75k, 8004.0% for AGIs $75k-100k, 13504.2% for AGIs $100k-200k)
Taxable interest for individuals: $964 (reported on 46.1% of returns)
This zip code:
$964
Illinois:
$2,376
(% of AGI for various income ranges: 10.8% for AGIs below $25k, 31.9% for AGIs $25k-50k, 50.0% for AGIs $50k-75k, 57.0% for AGIs $75k-100k, 149.2% for AGIs $100k-200k)
Ordinary dividends: $4,800 (reported on 14.8% of returns)
Here:
$4,800
State:
$9,061
(% of AGI for various income ranges: 18.1% for AGIs below $25k, 24.8% for AGIs $25k-50k, 43.6% for AGIs $50k-75k, 44.0% for AGIs $75k-100k, 510.0% for AGIs $100k-200k)
Net capital gain/loss in AGI: +$5,980 (reported on 13.0% of returns)
Here:
+$5,980
State:
+$31,684
(% of AGI for various income ranges: 21.2% for AGIs below $25k, 22.4% for AGIs $25k-50k, 162.1% for AGIs $50k-75k, 473.3% for AGIs $100k-200k)
Profit/loss from business: +$12,569 (reported on 11.3% of returns)
Here:
+$12,569
State:
+$12,175
(% of AGI for various income ranges: 81.2% for AGIs below $25k, 181.9% for AGIs $25k-50k, 479.3% for AGIs $50k-75k, 308.3% for AGIs $100k-200k)
Taxable individual retirement arrangement distribution: $13,331 (reported on 11.3% of returns)
61723:
$13,331
Illinois:
$21,613
(% of AGI for various income ranges: 151.4% for AGIs $25k-50k, 386.4% for AGIs $50k-75k, 728.3% for AGIs $100k-200k)
Total itemized deductions: $23,033 (reported on 5.2% of returns)
Here:
$23,033
State:
$34,948
(% of AGI for various income ranges: 238.5% for AGIs below $25k, 762.0% for AGIs $75k-100k)
Charity contributions: $9,367 (reported on 2.6% of returns)
Here:
$9,367
State:
$13,122
(% of AGI for various income ranges: 281.0% for AGIs $75k-100k)
Taxes paid: $6,200 (reported on 4.3% of returns)
61723:
$6,200
State:
$8,563
(% of AGI for various income ranges: 65.7% for AGIs $25k-50k, 143.3% for AGIs $100k-200k)
Earned income credit: $2,044 (reported on 15.7% of returns)
Here:
$2,044
State:
$2,311
(% of AGI for various income ranges: 85.4% for AGIs below $25k, 69.5% for AGIs $25k-50k)
Percentage of individuals using paid preparers for their 2020 taxes: 92.2%
Here:
92%
State:
93%
(% for various income ranges: 91.4% for AGIs below $25k, 92.6% for AGIs $25k-50k, 94.7% for AGIs $50k-75k, 92.3% for AGIs $75k-100k, 88.9% for AGIs $100k-200k, 100.0% for AGIs over 200k)
Averages for the 2012 tax year for zip code 61723, filed in 2013:
Average Adjusted Gross Income (AGI) in 2012: $54,558 (Individual Income Tax Returns)
Here:
$54,558
State:
$68,058
Salary/wage: $44,197 (reported on 87.8% of returns)
Here:
$44,197
State:
$55,396
(% of AGI for various income ranges: 77.2% for AGIs below $25k, 77.8% for AGIs $25k-50k, 75.0% for AGIs $50k-75k, 73.1% for AGIs $75k-100k, 98.7% for AGIs $100k-200k)
Taxable interest for individuals: $937 (reported on 44.3% of returns)
This zip code:
$937
Illinois:
$1,969
(% of AGI for various income ranges: 1.1% for AGIs below $25k, 0.3% for AGIs $25k-50k, 0.9% for AGIs $50k-75k, 0.7% for AGIs $75k-100k, 0.6% for AGIs $100k-200k, 1.3% for AGIs over 200k)
Ordinary dividends: $2,379 (reported on 16.5% of returns)
Here:
$2,379
State:
$7,786
(% of AGI for various income ranges: 1.4% for AGIs below $25k, 0.3% for AGIs $25k-50k, 0.3% for AGIs $50k-75k, 0.7% for AGIs $75k-100k, 1.6% for AGIs $100k-200k)
Net capital gain/loss in AGI: +$2,382 (reported on 9.6% of returns)
Here:
+$2,382
State:
+$22,183
(% of AGI for various income ranges: 0.2% for AGIs $25k-50k, 1.9% for AGIs $100k-200k)
Profit/loss from business: +$8,120 (reported on 13.0% of returns)
Here:
+$8,120
State:
+$12,903
(% of AGI for various income ranges: 2.9% for AGIs below $25k, 2.4% for AGIs $25k-50k, 2.4% for AGIs $50k-75k, 2.7% for AGIs $75k-100k, 1.5% for AGIs $100k-200k)
Taxable individual retirement arrangement distribution: $9,373 (reported on 9.6% of returns)
61723:
$9,373
Illinois:
$17,929
(% of AGI for various income ranges: 2.7% for AGIs below $25k, 3.1% for AGIs $25k-50k, 4.7% for AGIs $75k-100k)
Total itemized deductions: $17,052 (19% of AGI, reported on 28.7% of returns)
Here:
$17,052
State:
$26,433
Here:
18.5% of AGI
State:
19.2% of AGI
(% of AGI for various income ranges: 9.4% for AGIs below $25k, 7.1% for AGIs $25k-50k, 8.1% for AGIs $50k-75k, 9.4% for AGIs $75k-100k, 15.5% for AGIs $100k-200k)
Charity contributions: $3,483 (reported on 20.9% of returns)
Here:
$3,483
State:
$4,525
(% of AGI for various income ranges: 1.0% for AGIs below $25k, 0.9% for AGIs $25k-50k, 1.1% for AGIs $50k-75k, 1.6% for AGIs $75k-100k, 2.4% for AGIs $100k-200k)
Taxes paid: $6,767 (reported on 28.7% of returns)
61723:
$6,767
State:
$11,968
(% of AGI for various income ranges: 2.0% for AGIs below $25k, 1.9% for AGIs $25k-50k, 2.6% for AGIs $50k-75k, 3.6% for AGIs $75k-100k, 8.0% for AGIs $100k-200k)
Earned income credit: $2,059 (reported on 14.8% of returns)
Here:
$2,059
State:
$2,349
(% of AGI for various income ranges: 5.3% for AGIs below $25k, 1.0% for AGIs $25k-50k)
Percentage of individuals using paid preparers for their 2012 taxes: 62.6%
Here:
63%
State:
57%
(% for various income ranges: 57.9% for AGIs below $25k, 60.0% for AGIs $25k-50k, 65.0% for AGIs $50k-75k, 64.3% for AGIs $75k-100k, 72.7% for AGIs $100k-200k, 100.0% for AGIs over 200k)
Averages for the 2004 tax year for zip code 61723, filed in 2005:
Average Adjusted Gross Income (AGI) in 2004: $41,710 (Individual Income Tax Returns)
Here:
$41,710
State:
$54,625
Salary/wage: $37,156 (reported on 86.4% of returns)
Here:
$37,156
State:
$46,811
(% of AGI for various income ranges: 100.9% for AGIs below $10k, 67.8% for AGIs $10k-25k, 76.1% for AGIs $25k-50k, 83.5% for AGIs $50k-75k, 87.7% for AGIs $75k-100k, 62.7% for AGIs over 100k)
Taxable interest for individuals: $1,231 (reported on 47.8% of returns)
This zip code:
$1,231
Illinois:
$2,101
(% of AGI for various income ranges: 6.8% for AGIs below $10k, 3.2% for AGIs $10k-25k, 1.7% for AGIs $25k-50k, 0.5% for AGIs $50k-75k, 0.5% for AGIs $75k-100k, 1.7% for AGIs over 100k)
Taxable dividends: $1,161 (reported on 20.3% of returns)
Here:
$1,161
State:
$4,306
(% of AGI for various income ranges: 0.6% for AGIs below $10k, 1.4% for AGIs $10k-25k, 0.6% for AGIs $25k-50k, 0.2% for AGIs $50k-75k, 0.1% for AGIs $75k-100k, 1.0% for AGIs over 100k)
Net capital gain/loss: +$3,261 (reported on 13.1% of returns)
Here:
+$3,261
State:
+$17,321
(% of AGI for various income ranges: -2.1% for AGIs below $10k, 0.2% for AGIs $10k-25k, 0.7% for AGIs $25k-50k, 0.5% for AGIs $50k-75k, 0.1% for AGIs $75k-100k, 3.3% for AGIs over 100k)
Profit/loss from business: +$5,738 (reported on 14.4% of returns)
Here:
+$5,738
State:
+$11,771
(% of AGI for various income ranges: 4.6% for AGIs below $10k, 5.7% for AGIs $10k-25k, 3.3% for AGIs $25k-50k, 0.8% for AGIs $50k-75k, 0.7% for AGIs $75k-100k, 1.6% for AGIs over 100k)
Profit/loss from farming: +$4,639 (reported on 5.1% of returns)
Here:
+$4,639
State:
+$2,327
(% of AGI for various income ranges: 7.7% for AGIs below $10k, -0.1% for AGIs $25k-50k, 1.1% for AGIs $50k-75k, 0.7% for AGIs over 100k)
IRA payment deduction: $1,500 (reported on 1.3% of returns)
61723:
$1,500
Illinois:
$3,087
Total itemized deductions: $14,048 (20% of AGI, reported on 29.6% of returns)
Here:
$14,048
State:
$20,239
Here:
20.5% of AGI
State:
19.5% of AGI
(% of AGI for various income ranges: 16.2% for AGIs below $10k, 11.3% for AGIs $10k-25k, 8.4% for AGIs $25k-50k, 9.2% for AGIs $50k-75k, 11.3% for AGIs $75k-100k, 9.9% for AGIs over 100k)
Charity contributions deductions: $2,637 (4% of AGI, reported on 23.5% of returns)
Here:
$2,637
State:
$3,719
Here:
3.6% of AGI
State:
3.4% of AGI
(% of AGI for various income ranges: 1.7% for AGIs $10k-25k, 1.0% for AGIs $25k-50k, 1.3% for AGIs $50k-75k, 1.4% for AGIs $75k-100k, 2.2% for AGIs over 100k)
Total tax: $5,377 (reported on 78.1% of returns)
61723:
$5,377
State:
$9,882
(% of AGI for various income ranges: 2.0% for AGIs below $10k, 4.7% for AGIs $10k-25k, 7.6% for AGIs $25k-50k, 8.5% for AGIs $50k-75k, 10.3% for AGIs $75k-100k, 16.6% for AGIs over 100k)
Earned income credit: $1,606 (reported on 11.5% of returns)
Here:
$1,606
State:
$1,788
Percentage of individuals using paid preparers for their 2004 taxes: 65.2%
Here:
65%
State:
61%
(% for various income ranges: 49.6% for AGIs below $10k, 70.0% for AGIs $10k-25k, 73.5% for AGIs $25k-50k, 61.8% for AGIs $50k-75k, 66.1% for AGIs $75k-100k, 76.5% for AGIs over 100k)
Household received Food Stamps/SNAP in the past 12 months: 154 Household did not receive Food Stamps/SNAP in the past 12 months: 900
Women who had a birth in the past 12 months: 8 (0 now married, 8 unmarried) Women who did not have a birth in the past 12 months: 440 (286 now married, 150 unmarried)
Housing units in zip code 61723 with a mortgage: 542 (32 second mortgage, 4 home equity loan, 12 both second mortgage and home equity loan) Houses without a mortgage: 3
Median monthly owner costs for units with a mortgage: $1,225 Median monthly owner costs for units without a mortgage: $565
Residents with income below the poverty level in 2022:
This zip code:
10.6%
Whole state:
11.9%
Residents with income below 50% of the poverty level in 2022:
This zip code:
7.0%
Whole state:
5.7%
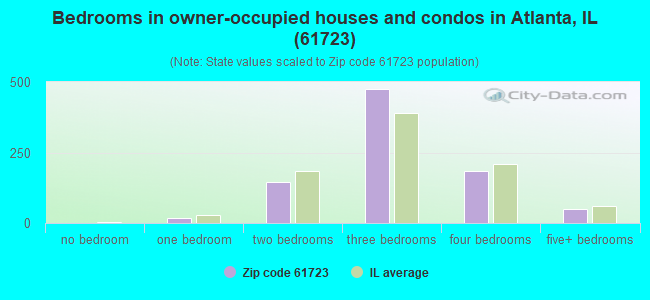
Median number of rooms in houses and condos:
Here:
6.5
State:
6.4
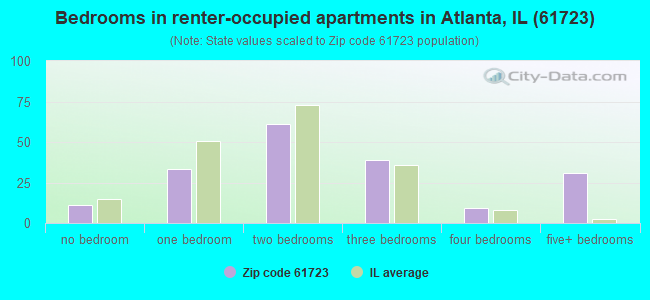
Median number of rooms in apartments:
Here:
5.1
State:
4.1
Notable locations in this zip code not listed on our city pages
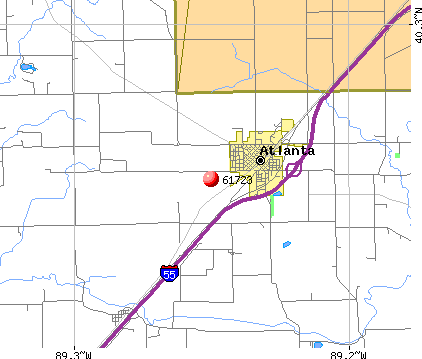
Notable locations in zip code 61723: Camp Griesheim (A), Eminence Townhall (B), Atlanta Fire Protection District (C). Display/hide their locations on the map
Cemeteries: Atlanta Cemetery (1), Jolly Cemetery (2), Thompson Cemetery (3), Blue Grass Cemetery (4), Carlock Cemetery (5), Howser Cemetery (6), Morgan Cemetery (7). Display/hide their locations on the map
In group quarters: 3 (-1 institutionalized population)
Size of family households: 436 2-persons, 78 3-persons, 160 4-persons, 48 5-persons, 17 6-persons, 12 7-or-more-persons
Size of nonfamily households: 259 1-person, 40 2-persons
386 married couples with children.
145 single-parent households (19 men, 126 women).
99.6% of residents of 61723 zip code speak English at home.
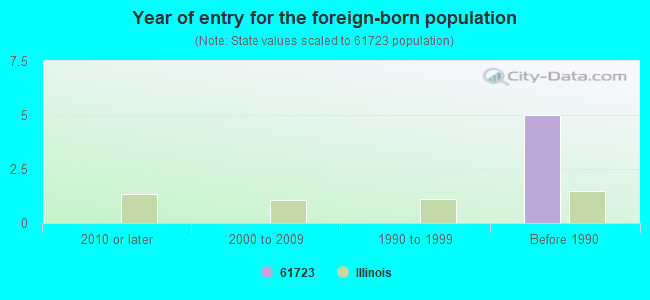
Foreign born population: 0 (0.0%)
:
0.0%
Whole state:
14.4%
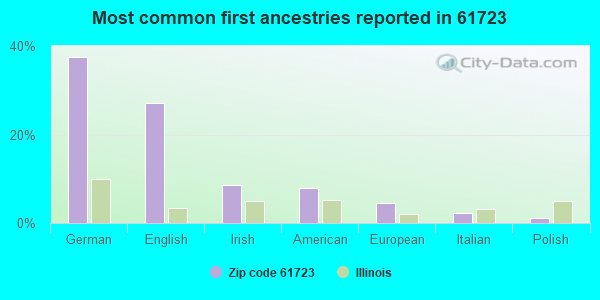
38%German
27%English
9%Irish
8%American
4%European
2%Italian
1%Polish
Year of entry for the foreign-born population
02010 or later
02000 to 2009
01990 to 1999
5Before 1990
Facilities with environmental interests located in this zip code:
HACO INC (303 SW ARCH STREET in ATLANTA, IL)
STATE MASTER (Illinois EPA Project) - SOLID WASTE PROGRAM, HAZARDOUS WASTE PROGRAM, AIR PROGRAM AIR MINOR (AIRS/AFS) National Pollutant Discharge Elimination System NON-MAJOR (Tracking pollutant discharge elimination systems) - permit TRANSPORTER (Resource Conservation and Recovery Act (tracking hazardous waste)) TSD (Resource Conservation and Recovery Act (tracking hazardous waste)) TRI REPORTER (Tracking of toxic chemicals releasing facilities) Business SIC classification: PESTICIDES AND AGRICULTURAL CHEMICALS Organizations: HACO, INC. (CONTACT/OWNER)
ATLANTA THERMOGAS (R.R.#2 in ATLANTA, IL)
STATE MASTER (Illinois EPA Project) - AIR PROGRAM AIR MINOR (AIRS/AFS) (Integrated Compliance Information System) - ICIS-05-1997-0402, FORMAL ENFORCEMENT ACTION Business SIC classification: LIQUEFIED PETROLEUM GAS (BOTTLED GAS) DEALERS
ATLANTA STP (2000 FIRST STREET in ATLANTA, IL)
STATE MASTER (Illinois EPA Project) - National Pollutant Discharge Elimination System Permit, National Pollutant Discharge Elimination System NON-MAJOR (Tracking pollutant discharge elimination systems) - permit Business SIC classification: SEWERAGE SYSTEMS Organizations: ATLANTA STP, CITY OF (CONTACT/OWNER)
Alternative names: ATLANTA STP, CITY OF
ARMINGTON FINISHERS (1533 US HWY 136 in ATLANTA, IL)
STATE MASTER (Illinois EPA Project) - AIR PROGRAM AIR MINOR (AIRS/AFS) Business SIC classification: NONCLASSIFIABLE ESTABLISHMENTS Alternative names: HEARTLAND PORK ENTERPRISES
MICHAEL MEDERICH (2070 2100TH STREET in ATLANTA, IL)
STATE MASTER (Illinois EPA Project) - AIR PROGRAM AIR MINOR (AIRS/AFS) Business SIC classification: NONCLASSIFIABLE ESTABLISHMENTS
ATLANTA ELEMENTARY SCHOOL (103 NE 5TH ST in ATLANTA, IL)
(Geographic Names Information System) (National Center for Education Statistics) - STATE ID-1706401602002 Organizations: OLYMPIA C U SCHOOL DIST 16 (SCHOOL DISTRICT)
JOEL FARMS, INC. (R.R., 507 SOUTH STREET in ATLANTA, IL)
National Pollutant Discharge Elimination System NON-MAJOR (Tracking pollutant discharge elimination systems) - permit
ILDOT BRG 054 0026 (US RTE 136 OVER SUGAR CREEK in ATLANTA, IL)
Conditionally Exempt Small Quantity Generators, less than 100 kg/month of hazardous waste (Resource Conservation and Recovery Act (tracking hazardous waste)) - notification
ILDOT BRG 054 0065 AND 0066 (FAI 55 OVER RACE ST in ATLANTA, IL)
Small Quantity Generators, between 100 kg and 1000 kg of hazardous waste/month (Resource Conservation and Recovery Act (tracking hazardous waste)) - notification
ILDOT BRG 054 0067 AND 0068 (FAI 55 OVER PENN CENTRAL RR in ATLANTA, IL)
Small Quantity Generators, between 100 kg and 1000 kg of hazardous waste/month (Resource Conservation and Recovery Act (tracking hazardous waste)) - notification
ATLANTA AG CENTER, INC. (2305-2050TH AVE. in ATLANTA, IL)
COMPLIANCE ACTIVITY (Tracking inspections of insecticide, fungicide, and rodenticide, and toxic substances)
HG & N FERTILIZER (2016 2400 TH STREET in ATLANTA, IL)
ENFORCEMENT/COMPLIANCE ACTIVITY (Integrated Compliance Information System)
Housing units lacking complete plumbing facilities: 2.0%
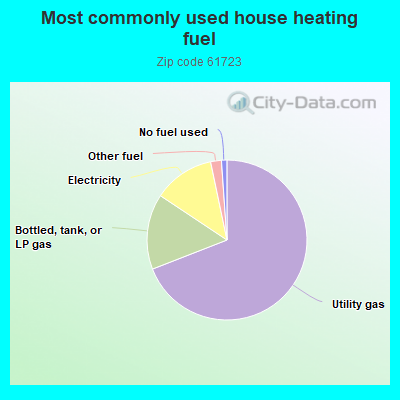
69.3%Utility gas
15.3%Bottled, tank, or LP gas
12.4%Electricity
2.2%Other fuel
1.1%No fuel used
Population in 1990: 1,978. Population change in the 1990s: +458 (+23.2%).
Place of birth for U.S.-born residents:
This state: 2,200
Northeast: 18
Midwest: 128
South: 64
West: 34
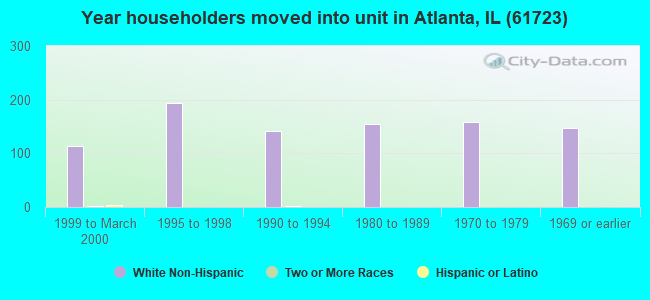
63% of the 61723 zip code residents lived in the same house 5 years ago. Out of people who lived in different houses, 49% lived in this county. Out of people who lived in different counties, 50% lived in Illinois.
91% of the 61723 zip code residents lived in the same house 1 year ago. Out of people who lived in different houses, 14% moved from this county. Out of people who lived in different houses, 92% moved from different county within same state.
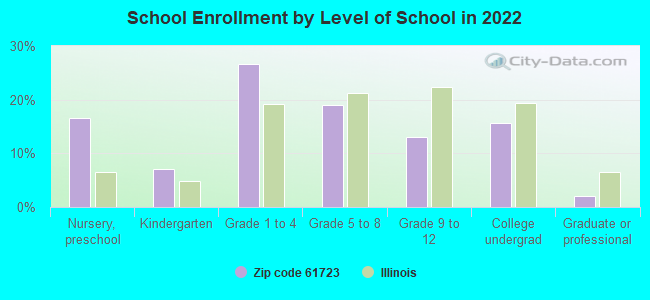
Private vs. public school enrollment:
Students in private schools in grades 1 to 8 (elementary and middle school): 8
Here:
3.2%
Illinois:
13.3%
Students in private schools in grades 9 to 12 (high school):
Here:
0.0%
Illinois:
9.9%
Students in private undergraduate colleges: 26
Here:
29.8%
Illinois:
27.4%
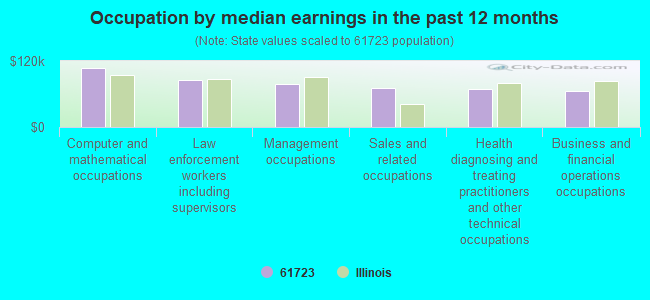
Occupation by median earnings in the past 12 months ($)
106,914Computer and mathematical occupations
85,956Law enforcement workers including supervisors
77,389Management occupations
70,873Sales and related occupations
68,808Health diagnosing and treating practitioners and other technical occupations
66,222Business and financial operations occupations
Companies with federal contracts located in this zip code:
DELORES BILLINGTON (408 E PRESTON ST in ATLANTA, IL; small business) : $29,239 in 17 contractsfrom 2003 to 2006
Contracts for Operation of Government-Owned Facilities -- Recreation Facilities (Non-Building) by Army, U.S. Army Corps of Engineers - civil program financing only Signed by year:2000: $0; 2001: $0; 2002: $0; 2003: $4,776; 2004: $9,240; 2005: $10,860; 2006: $4,363.
Biggest contracts:
$4,710 with Army for Operation of Government-Owned Facilities -- Recreation Facilities (Non-Building). Signed on 2005-02-08. Completion date: 2003-04-24.
$4,710 with U.S. Army Corps of Engineers - civil program financing only for Operation of Government-Owned Facilities -- Recreation Facilities (Non-Building). Signed on 2005-02-08. Completion date: 2003-04-24.
$4,710, same as above.Signed on 2004-01-23. Completion date: 2003-04-24.
$4,710 with Army for Operation of Government-Owned Facilities -- Recreation Facilities (Non-Building). Signed on 2004-01-23. Completion date: 2003-04-24.
Top industries in this zip code by the number of employees in 2005:
Construction: New Single-Family Housing Construction (except Operative Builders) (5-9: 1, 1-4: 1)
People in group quarters in 2010:
8 people in group homes intended for adults
People in group quarters in 2000:
97 people in nursing homes
Fatal accident statistics in 2014:
Fatal accident count: 2
Vehicles involved in fatal accidents: 2
Fatal accidents caused by drunken drivers: 1
Fatalities: 2
Persons involved in fatal accidents: 3
Pedestrians involved in fatal accidents: 0
Fatal accident statistics in 2011:
Fatal accident count: 1
Vehicles involved in fatal accidents: 2
Fatal accidents caused by drunken drivers: 1
Fatalities: 1
Persons involved in fatal accidents: 6
Pedestrians involved in fatal accidents: 0
2002 - 2018 National Fire Incident Reporting System (NFIRS) incidents
Based on the data from the years 2002 - 2018 the average number of fire incidents per year is 22. The highest number of fires - 34 took place in 2012, and the least - 4 in 2017. The data has a decreasing trend.
When looking into fire subcategories, the most incidents belonged to: Outside Fires (43.5%), and Structure Fires (38.3%).
Fire incident types reported to NFIRS in Zip Code 61723
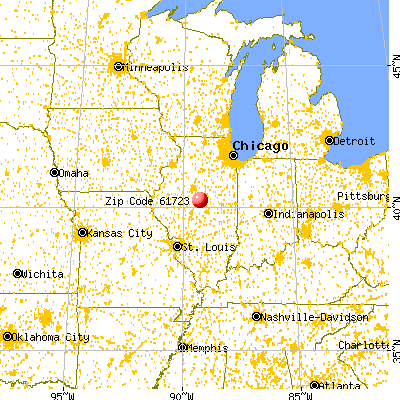


 Nearest zip codes: 61751, 61721, 61754, 62512, 62656, 62643.
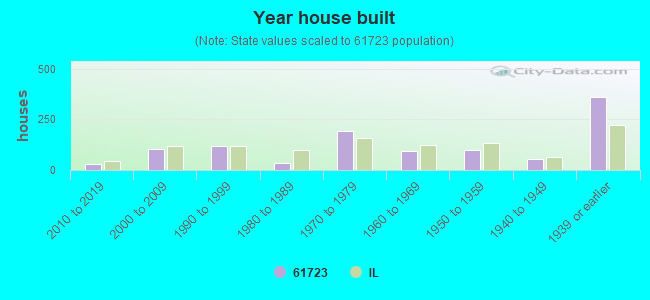


 Based on the data from the years 2002 - 2018 the average number of fire incidents per year is 22. The highest number of fires - 34 took place in 2012, and the least - 4 in 2017. The data has a decreasing trend.
 When looking into fire subcategories, the most incidents belonged to: Outside Fires (43.5%), and Structure Fires (38.3%).