Estimated zip code population in 2022: 2,694 Zip code population in 2010: 2,782 Zip code population in 2000: 2,589
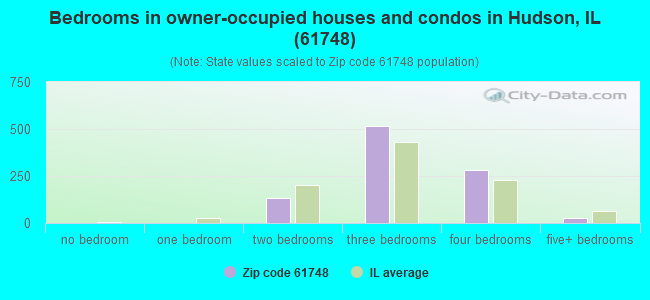
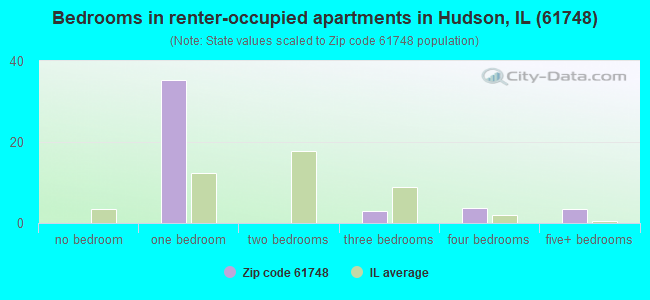
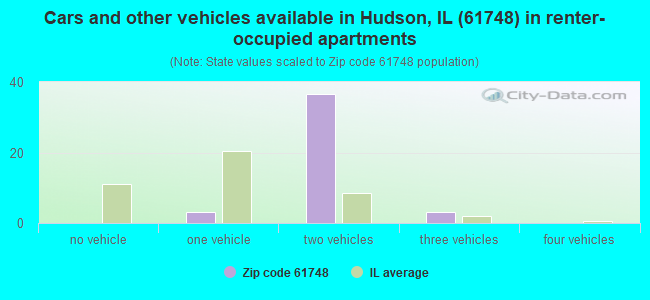
Houses and condos: 1,228 Renter-occupied apartments: 45
% of renters here:
4%
State:
33%
March 2022 cost of living index in zip code 61748: 83.1 (low, U.S. average is 100)
Land area: 39.5 sq. mi. Water area: 2.1 sq. mi.
Population density: 68 people per square mile
(very low).
OSM Map
General Map
Google Map
MSN Map
OSM Map
General Map
Google Map
MSN Map
OSM Map
General Map
Google Map
MSN Map
OSM Map
General Map
Google Map
MSN Map
Please wait while loading the map...
Real estate property taxes paid for housing units in 2022:
This zip code:
2.1% ($4,674)
Illinois:
2.0% ($4,912)
Median real estate property taxes paid for housing units with mortgages in 2022: $4,509 (2.1%) Median real estate property taxes paid for housing units with no mortgage in 2022: $5,125 (2.2%)
Business Search- 14 Million verified businesses
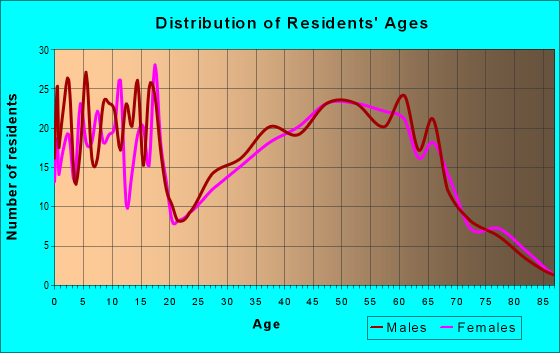
Males: 1,388
(51.5%)
Females: 1,306
(48.5%)
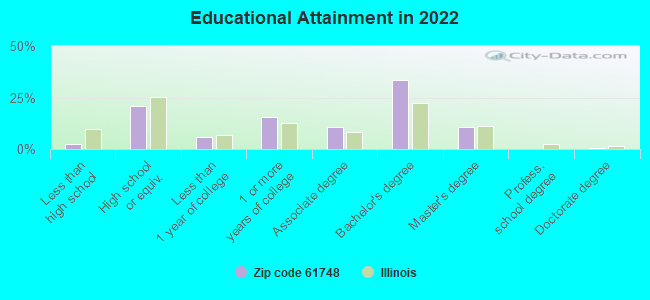
For population 25 years and over in 61748:
High school or higher: 97.8%
Bachelor's degree or higher: 44.7%
Graduate or professional degree: 11.2%
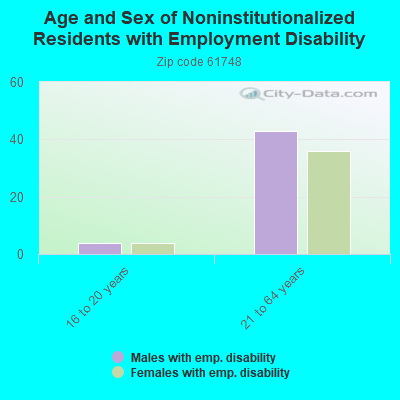
Unemployed: 2.2%
Mean travel time to work (commute): 24.8 minutes
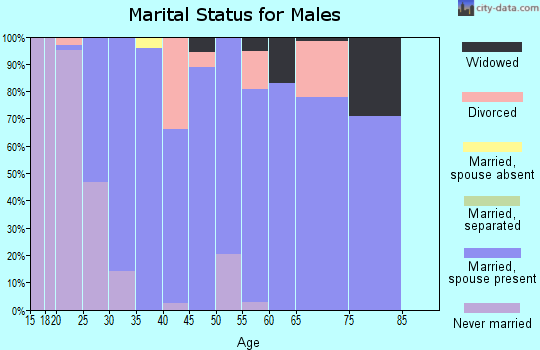
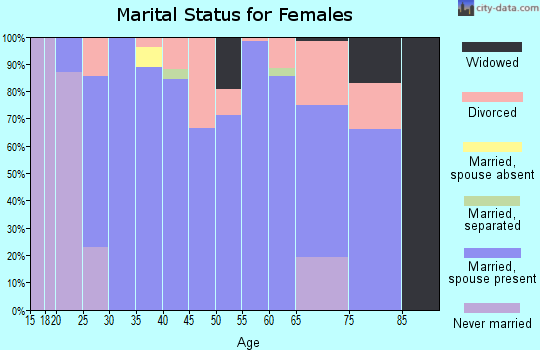
For population 15 years and over in 61748:
Never married: 20.4%
Now married: 68.5%
Separated: 0.1%
Widowed: 4.4%
Divorced: 6.6%
Zip code 61748 compared to state average:
Unemployed percentage below state average.
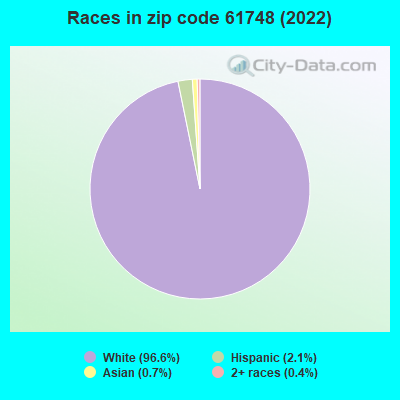
Black race population percentage significantly below state average.
Hispanic race population percentage significantly below state average.
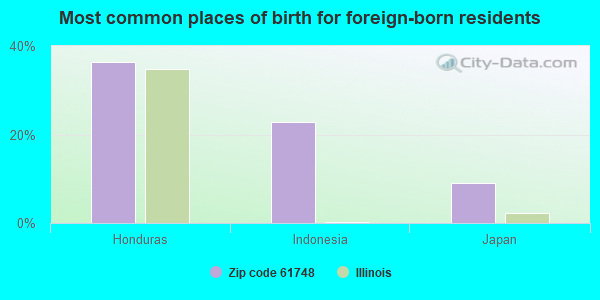
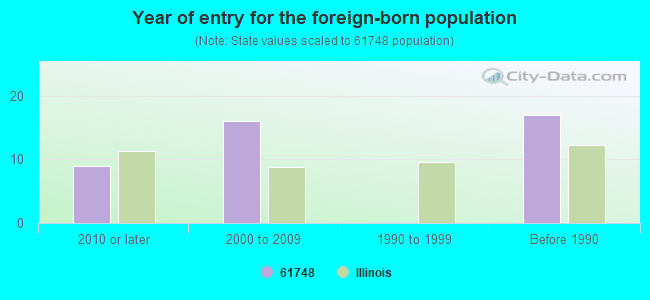
Foreign-born population percentage significantly below state average.
Renting percentage significantly below state average.
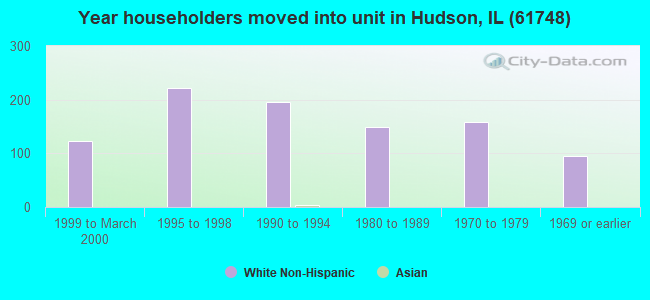
Length of stay since moving in above state average.
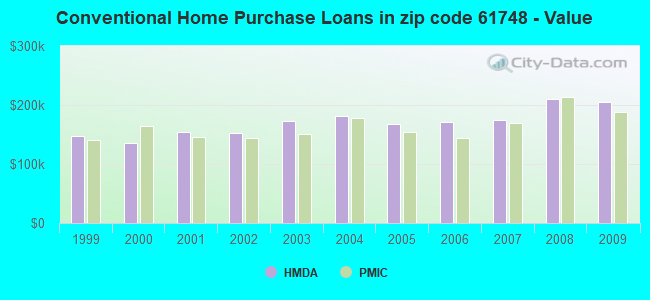
Estimated median house/condo value in 2022: $220,979
61748:
$220,979
Illinois:
$251,600
According to our research of Illinois and other state lists, there were 2 registered sex offenders living in 61748 zip code as of May 04, 2024. The ratio of all residents to sex offenders in zip code 61748 is 1,402 to 1. The ratio of registered sex offenders to all residents in this zip code is lower than the state average.
Median resident age:
This zip code:
41.3 years
Illinois median age:
39.1 years
Average household size:
This zip code:
2.7 people
Illinois:
2.4 people
Averages for the 2020 tax year for zip code 61748, filed in 2021:
Average Adjusted Gross Income (AGI) in 2020: $112,960 (Individual Income Tax Returns)
Here:
$112,960
State:
$82,626
Salary/wage: $83,667 (reported on 81.6% of returns)
Here:
$83,667
State:
$66,640
(% of AGI for various income ranges: 1145.0% for AGIs below $25k, 3113.9% for AGIs $25k-50k, 5554.2% for AGIs $50k-75k, 8131.8% for AGIs $75k-100k, 16794.5% for AGIs $100k-200k, 89410.0% for AGIs over 200k)
Taxable interest for individuals: $2,289 (reported on 58.2% of returns)
This zip code:
$2,289
Illinois:
$2,376
(% of AGI for various income ranges: 15.0% for AGIs below $25k, 28.9% for AGIs $25k-50k, 90.0% for AGIs $50k-75k, 57.3% for AGIs $75k-100k, 186.4% for AGIs $100k-200k, 3035.0% for AGIs over 200k)
Ordinary dividends: $9,823 (reported on 30.5% of returns)
Here:
$9,823
State:
$9,061
(% of AGI for various income ranges: 35.5% for AGIs below $25k, 38.3% for AGIs $25k-50k, 225.0% for AGIs $50k-75k, 152.7% for AGIs $75k-100k, 226.8% for AGIs $100k-200k, 7867.5% for AGIs over 200k)
Net capital gain/loss in AGI: +$14,226 (reported on 27.7% of returns)
Here:
+$14,226
State:
+$31,684
(% of AGI for various income ranges: 11.0% for AGIs below $25k, 65.6% for AGIs $25k-50k, 66.7% for AGIs $50k-75k, 118.2% for AGIs $75k-100k, 310.5% for AGIs $100k-200k, 11287.5% for AGIs over 200k)
Profit/loss from business: +$14,581 (reported on 14.9% of returns)
Here:
+$14,581
State:
+$12,175
(% of AGI for various income ranges: 99.0% for AGIs below $25k, 201.7% for AGIs $25k-50k, 308.3% for AGIs $50k-75k, 289.1% for AGIs $75k-100k, 378.6% for AGIs $100k-200k, 2450.0% for AGIs over 200k)
Taxable individual retirement arrangement distribution: $21,605 (reported on 13.5% of returns)
61748:
$21,605
Illinois:
$21,613
(% of AGI for various income ranges: 40.5% for AGIs below $25k, 150.6% for AGIs $25k-50k, 319.2% for AGIs $50k-75k, 292.7% for AGIs $75k-100k, 611.8% for AGIs $100k-200k, 4255.0% for AGIs over 200k)
Total itemized deductions: $40,933 (reported on 10.6% of returns)
Here:
$40,933
State:
$34,948
(% of AGI for various income ranges: 887.5% for AGIs $50k-75k, 596.8% for AGIs $100k-200k, 9405.0% for AGIs over 200k)
Charity contributions: $28,142 (reported on 8.5% of returns)
Here:
$28,142
State:
$13,122
(% of AGI for various income ranges: 170.0% for AGIs $50k-75k, 177.3% for AGIs $100k-200k, 6957.5% for AGIs over 200k)
Taxes paid: $7,753 (reported on 10.6% of returns)
61748:
$7,753
State:
$8,563
(% of AGI for various income ranges: 231.7% for AGIs $50k-75k, 202.3% for AGIs $100k-200k, 1100.0% for AGIs over 200k)
Earned income credit: $2,043 (reported on 5.0% of returns)
Here:
$2,043
State:
$2,311
(% of AGI for various income ranges: 37.5% for AGIs below $25k, 37.8% for AGIs $25k-50k)
Percentage of individuals using paid preparers for their 2020 taxes: 94.3%
Here:
94%
State:
93%
(% for various income ranges: 90.6% for AGIs below $25k, 95.7% for AGIs $25k-50k, 94.4% for AGIs $50k-75k, 94.1% for AGIs $75k-100k, 97.4% for AGIs $100k-200k, 92.3% for AGIs over 200k)
Averages for the 2012 tax year for zip code 61748, filed in 2013:
Average Adjusted Gross Income (AGI) in 2012: $101,811 (Individual Income Tax Returns)
Here:
$101,811
State:
$68,058
Salary/wage: $67,536 (reported on 84.7% of returns)
Here:
$67,536
State:
$55,396
(% of AGI for various income ranges: 72.9% for AGIs below $25k, 74.9% for AGIs $25k-50k, 69.2% for AGIs $50k-75k, 73.4% for AGIs $75k-100k, 75.6% for AGIs $100k-200k, 30.5% for AGIs over 200k)
Taxable interest for individuals: $1,695 (reported on 59.1% of returns)
This zip code:
$1,695
Illinois:
$1,969
(% of AGI for various income ranges: 1.2% for AGIs below $25k, 0.5% for AGIs $25k-50k, 0.6% for AGIs $50k-75k, 1.0% for AGIs $75k-100k, 0.6% for AGIs $100k-200k, 1.4% for AGIs over 200k)
Ordinary dividends: $5,609 (reported on 32.8% of returns)
Here:
$5,609
State:
$7,786
(% of AGI for various income ranges: 0.8% for AGIs below $25k, 0.8% for AGIs $25k-50k, 1.1% for AGIs $50k-75k, 0.8% for AGIs $75k-100k, 0.9% for AGIs $100k-200k, 3.2% for AGIs over 200k)
Net capital gain/loss in AGI: +$15,319 (reported on 22.6% of returns)
Here:
+$15,319
State:
+$22,183
(% of AGI for various income ranges: 0.6% for AGIs $50k-75k, 0.9% for AGIs $75k-100k, 0.7% for AGIs $100k-200k, 7.5% for AGIs over 200k)
Profit/loss from business: +$19,590 (reported on 15.3% of returns)
Here:
+$19,590
State:
+$12,903
(% of AGI for various income ranges: 4.9% for AGIs below $25k, 2.1% for AGIs $25k-50k, 2.9% for AGIs $50k-75k, 0.6% for AGIs $75k-100k, 2.3% for AGIs $100k-200k, 4.1% for AGIs over 200k)
Taxable individual retirement arrangement distribution: $13,737 (reported on 13.9% of returns)
61748:
$13,737
Illinois:
$17,929
(% of AGI for various income ranges: 5.0% for AGIs below $25k, 2.7% for AGIs $25k-50k, 3.6% for AGIs $50k-75k, 1.3% for AGIs $75k-100k, 1.4% for AGIs $100k-200k, 1.7% for AGIs over 200k)
Self-employment retirement plans: $33,550 (reported on 1.5% of returns)
61748:
$33,550
Illinois:
$24,666
(% of AGI for various income ranges: 3.9% for AGIs $75k-100k)
Total itemized deductions: $26,706 (16% of AGI, reported on 48.2% of returns)
Here:
$26,706
State:
$26,433
Here:
16.2% of AGI
State:
19.2% of AGI
(% of AGI for various income ranges: 13.7% for AGIs below $25k, 11.5% for AGIs $25k-50k, 13.7% for AGIs $50k-75k, 14.6% for AGIs $75k-100k, 13.7% for AGIs $100k-200k, 11.1% for AGIs over 200k)
Charity contributions: $6,349 (reported on 40.1% of returns)
Here:
$6,349
State:
$4,525
(% of AGI for various income ranges: 1.0% for AGIs below $25k, 1.5% for AGIs $25k-50k, 1.7% for AGIs $50k-75k, 2.0% for AGIs $75k-100k, 1.8% for AGIs $100k-200k, 3.6% for AGIs over 200k)
Taxes paid: $12,794 (reported on 48.2% of returns)
61748:
$12,794
State:
$11,968
(% of AGI for various income ranges: 3.4% for AGIs below $25k, 4.0% for AGIs $25k-50k, 5.7% for AGIs $50k-75k, 6.0% for AGIs $75k-100k, 7.2% for AGIs $100k-200k, 5.8% for AGIs over 200k)
Earned income credit: $1,778 (reported on 6.6% of returns)
Here:
$1,778
State:
$2,349
(% of AGI for various income ranges: 2.7% for AGIs below $25k, 0.6% for AGIs $25k-50k)
Percentage of individuals using paid preparers for their 2012 taxes: 51.8%
Here:
52%
State:
57%
(% for various income ranges: 42.9% for AGIs below $25k, 54.5% for AGIs $25k-50k, 57.1% for AGIs $50k-75k, 55.0% for AGIs $75k-100k, 46.7% for AGIs $100k-200k, 77.8% for AGIs over 200k)
Averages for the 2004 tax year for zip code 61748, filed in 2005:
Average Adjusted Gross Income (AGI) in 2004: $71,355 (Individual Income Tax Returns)
Here:
$71,355
State:
$54,625
Salary/wage: $55,982 (reported on 86.3% of returns)
Here:
$55,982
State:
$46,811
(% of AGI for various income ranges: 117.5% for AGIs below $10k, 63.0% for AGIs $10k-25k, 68.1% for AGIs $25k-50k, 80.8% for AGIs $50k-75k, 83.2% for AGIs $75k-100k, 54.8% for AGIs over 100k)
Taxable interest for individuals: $2,151 (reported on 67.5% of returns)
This zip code:
$2,151
Illinois:
$2,101
(% of AGI for various income ranges: 3.9% for AGIs below $10k, 4.4% for AGIs $10k-25k, 2.1% for AGIs $25k-50k, 1.7% for AGIs $50k-75k, 1.2% for AGIs $75k-100k, 2.4% for AGIs over 100k)
Taxable dividends: $2,900 (reported on 35.6% of returns)
Here:
$2,900
State:
$4,306
(% of AGI for various income ranges: 2.7% for AGIs below $10k, 1.2% for AGIs $10k-25k, 1.2% for AGIs $25k-50k, 1.0% for AGIs $50k-75k, 0.8% for AGIs $75k-100k, 2.0% for AGIs over 100k)
Net capital gain/loss: +$5,720 (reported on 24.8% of returns)
Here:
+$5,720
State:
+$17,321
(% of AGI for various income ranges: 1.3% for AGIs below $10k, 0.0% for AGIs $10k-25k, 1.0% for AGIs $25k-50k, 1.0% for AGIs $50k-75k, 0.2% for AGIs $75k-100k, 3.6% for AGIs over 100k)
Profit/loss from business: +$12,253 (reported on 14.9% of returns)
Here:
+$12,253
State:
+$11,771
(% of AGI for various income ranges: -0.4% for AGIs below $10k, 1.4% for AGIs $10k-25k, 4.1% for AGIs $25k-50k, 1.6% for AGIs $50k-75k, 0.3% for AGIs $75k-100k, 3.7% for AGIs over 100k)
Profit/loss from farming: +$4,261 (reported on 3.5% of returns)
Here:
+$4,261
State:
+$2,327
IRA payment deduction: $2,690 (reported on 2.2% of returns)
61748:
$2,690
Illinois:
$3,087
Total itemized deductions: $18,422 (17% of AGI, reported on 48.6% of returns)
Here:
$18,422
State:
$20,239
Here:
16.6% of AGI
State:
19.5% of AGI
(% of AGI for various income ranges: 10.6% for AGIs below $10k, 16.3% for AGIs $10k-25k, 13.4% for AGIs $25k-50k, 13.7% for AGIs $50k-75k, 14.0% for AGIs $75k-100k, 11.0% for AGIs over 100k)
Charity contributions deductions: $4,093 (3% of AGI, reported on 41.5% of returns)
Here:
$4,093
State:
$3,719
Here:
3.5% of AGI
State:
3.4% of AGI
(% of AGI for various income ranges: 1.4% for AGIs $10k-25k, 1.0% for AGIs $25k-50k, 2.0% for AGIs $50k-75k, 2.1% for AGIs $75k-100k, 3.0% for AGIs over 100k)
Total tax: $11,523 (reported on 84.9% of returns)
61748:
$11,523
State:
$9,882
(% of AGI for various income ranges: 2.1% for AGIs below $10k, 4.5% for AGIs $10k-25k, 7.6% for AGIs $25k-50k, 8.6% for AGIs $50k-75k, 10.3% for AGIs $75k-100k, 19.4% for AGIs over 100k)
Earned income credit: $1,226 (reported on 4.0% of returns)
Here:
$1,226
State:
$1,788
Percentage of individuals using paid preparers for their 2004 taxes: 52.0%
Here:
52%
State:
61%
(% for various income ranges: 36.6% for AGIs below $10k, 55.7% for AGIs $10k-25k, 54.5% for AGIs $25k-50k, 57.7% for AGIs $50k-75k, 48.2% for AGIs $75k-100k, 57.9% for AGIs over 100k)
Household received Food Stamps/SNAP in the past 12 months: 16 Household did not receive Food Stamps/SNAP in the past 12 months: 971
Women who had a birth in the past 12 months: 29 (29 now married, 0 unmarried) Women who did not have a birth in the past 12 months: 497 (294 now married, 198 unmarried)
Housing units in zip code 61748 with a mortgage: 605 (57 second mortgage, 47 both second mortgage and home equity loan) Houses without a mortgage: 22
Median monthly owner costs for units with a mortgage: $1,521 Median monthly owner costs for units without a mortgage: $735
Residents with income below the poverty level in 2022:
This zip code:
2.0%
Whole state:
11.9%
Residents with income below 50% of the poverty level in 2022:
This zip code:
0.7%
Whole state:
5.7%
Median number of rooms in houses and condos:
Here:
6.8
State:
6.4
Median number of rooms in apartments:
Here:
5.0
State:
4.1
Notable locations in this zip code not listed on our city pages
Notable locations in zip code 61748: Hazy Hills Golf Course (A), East Bay Camp (B), Camp Peairs (C), Camp Heffernan (D), Hudson Community Fire Protection District Headquarters (E), Hudson Community Fire Protection District Lake (F). Display/hide their locations on the map
Size of family households: 358 2-persons, 115 3-persons, 109 4-persons, 118 5-persons, 29 6-persons, 9 7-or-more-persons
Size of nonfamily households: 246 1-person, 7 2-persons
642 married couples with children.
55 single-parent households (20 men, 35 women).
97.2% of residents of 61748 zip code speak English at home.
2.0% of residents speak Spanish at home (69% very well, 13% well, 17% not well).
0.1% of residents speak other Indo-European language at home (100% very well).
Foreign born population: 22 (0.8%) (41.1% of them are naturalized citizens)
This zip code:
0.8%
Whole state:
14.4%
36%Honduras
23%Indonesia
9%Japan
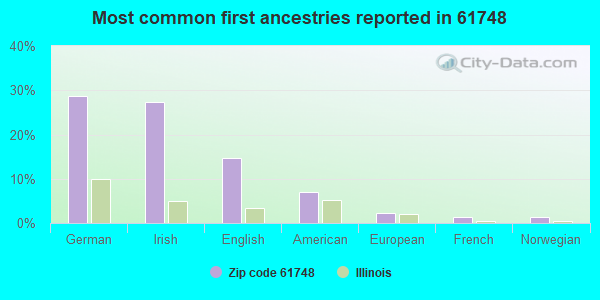
29%German
27%Irish
15%English
7%American
2%European
1%French
1%Norwegian
Year of entry for the foreign-born population
92010 or later
162000 to 2009
01990 to 1999
17Before 1990
Facilities with environmental interests located in this zip code:
NICOR GAS (20487 NORTH 1700 EAST ROAD in HUDSON, IL)
STATE MASTER (Illinois EPA Project) - SOLID WASTE PROGRAM, HAZARDOUS WASTE PROGRAM, AIR PROGRAM AIR MAJOR (AIRS/AFS) Small Quantity Generators, between 100 kg and 1000 kg of hazardous waste/month (Resource Conservation and Recovery Act (tracking hazardous waste)) Business SIC classification: NATURAL GAS DISTRIBUTION
NORTHERN ILLINOIS GAS CO (PIPELINE RD in HUDSON, IL)
STATE MASTER (Illinois EPA Project) - AIR PROGRAM AIR MINOR (AIRS/AFS) CRITERIA AND HAZARDOUS AIR POLLUTANT INVENTORY (Inventory of air pollution sources) Business SIC and NAICS classification: NATURAL GAS DISTRIBUTION
MCLEAN CO DEPT PARKS&RECREATN (R. R. #1, BOX 73 in HUDSON, IL)
STATE MASTER (Illinois EPA Project) - National Pollutant Discharge Elimination System Permit National Pollutant Discharge Elimination System NON-MAJOR (Tracking pollutant discharge elimination systems) - permit Business SIC classification: AMUSEMENT AND RECREATION SERVICES Alternative names: COMLARA PARK STP, MCLEAN COUNTY PARKS&RECREATION
PRAIRIE VIEW HOMEOWNERS ASSOC (SOUTH MCLEAN STREET in HUDSON, IL)
STATE MASTER (Illinois EPA Project) - National Pollutant Discharge Elimination System Permit National Pollutant Discharge Elimination System NON-MAJOR (Tracking pollutant discharge elimination systems) - permit Business SIC classification: PRIVATE HOUSEHOLDS
ROWE CONSTRUCTION CO (ROUTE 51 & COUNTY HWY 39 in HUDSON, IL)
STATE MASTER (Illinois EPA Project) - AIR PROGRAM AIR MINOR (AIRS/AFS) Business SIC classification: READY-MIXED CONCRETE
HUDSON GRAIN CO (WALNUT & SHINER ST. in HUDSON, IL)
STATE MASTER (Illinois EPA Project) - AIR PROGRAM AIR MAJOR (AIRS/AFS) CRITERIA AND HAZARDOUS AIR POLLUTANT INVENTORY (Inventory of air pollution sources) Business SIC classification: GRAIN AND FIELD BEANS
HUDSON ELEM SCHOOL (205 S MCLEAN ST in HUDSON, IL)
(National Center for Education Statistics) - STATE ID-1706400502009 Organizations: MCLEAN COUNTY UNIT DIST NO 5 (SCHOOL DISTRICT)
Housing units lacking complete kitchen facilities: 0.5%
91.7%Utility gas
4.4%Electricity
3.6%Bottled, tank, or LP gas
Population in 1990: 1,850. Population change in the 1990s: +739 (+39.9%).
Place of birth for U.S.-born residents:
This state: 2,304
Northeast: 51
Midwest: 139
South: 69
West: 75
64% of the 61748 zip code residents lived in the same house 5 years ago. Out of people who lived in different houses, 72% lived in this county. Out of people who lived in different counties, 50% lived in Illinois.
90% of the 61748 zip code residents lived in the same house 1 year ago. Out of people who lived in different houses, 61% moved from this county. Out of people who lived in different houses, 34% moved from different county within same state. Out of people who lived in different houses, 2% moved from abroad.
Private vs. public school enrollment:
Students in private schools in grades 1 to 8 (elementary and middle school): 65
Here:
18.6%
Illinois:
13.3%
Students in private schools in grades 9 to 12 (high school): 31
Here:
15.0%
Illinois:
9.9%
Students in private undergraduate colleges: 11
Here:
16.0%
Illinois:
27.4%
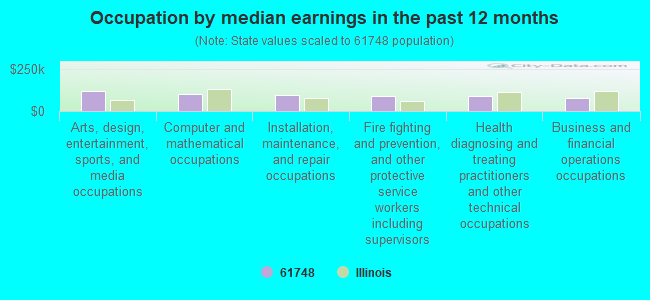
Occupation by median earnings in the past 12 months ($)
117,155Arts, design, entertainment, sports, and media occupations
103,869Computer and mathematical occupations
97,240Installation, maintenance, and repair occupations
89,626Fire fighting and prevention, and other protective service workers including supervisors
87,365Health diagnosing and treating practitioners and other technical occupations
78,321Business and financial operations occupations
Top industries in this zip code by the number of employees in 2005:
Wholesale Trade: Farm and Garden Machinery and Equipment Merchant Wholesalers (10-19 employees: 2 establishments)
Health Care and Social Assistance: Home Health Care Services (10-19: 1)
Construction: Painting and Wall Covering Contractors (10-19: 1)
Accommodation and Food Services: Full-Service Restaurants (10-19: 1)
Accommodation and Food Services: Recreational and Vacation Camps (except Campgrounds) (10-19: 1)
Construction: New Single-Family Housing Construction (except Operative Builders) (5-9: 1, 1-4: 2)
Administrative and Support and Waste Management and Remediation Services: Janitorial Services (5-9: 1, 1-4: 1)
Construction: Drywall and Insulation Contractors (5-9: 1, 1-4: 1)
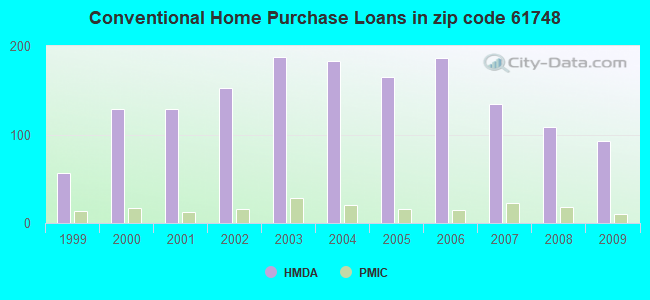
Detailed PMIC statistics for the following Tracts:0001.05
, 0051.00
2002 - 2018 National Fire Incident Reporting System (NFIRS) incidents
Based on the data from the years 2002 - 2018 the average number of fires per year is 13. The highest number of fires - 23 took place in 2015, and the least - 1 in 2008. The data has a declining trend.
When looking into fire subcategories, the most incidents belonged to: Outside Fires (44.8%), and Structure Fires (24.7%).
Fire incident types reported to NFIRS in Zip Code 61748
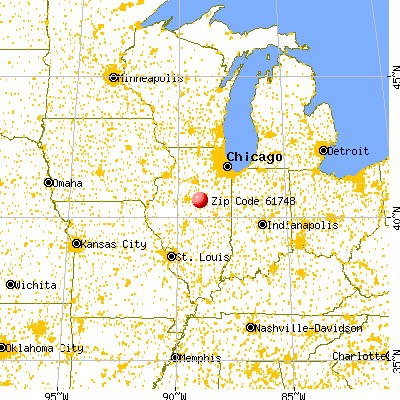


 Nearest zip codes: 61761, 61725, 61738, 61776, 61701, 61771.


 Based on the data from the years 2002 - 2018 the average number of fires per year is 13. The highest number of fires - 23 took place in 2015, and the least - 1 in 2008. The data has a declining trend.
 When looking into fire subcategories, the most incidents belonged to: Outside Fires (44.8%), and Structure Fires (24.7%).