Estimated zip code population in 2022: 1,039 Zip code population in 2010: 912 Zip code population in 2000: 924
Houses and condos: 480 Renter-occupied apartments: 82
% of renters here:
18%
State:
33%
March 2022 cost of living index in zip code 61925: 83.8 (less than average, U.S. average is 100)
Land area: 41.8 sq. mi. Water area: 0.0 sq. mi.
Population density: 25 people per square mile
(very low).
OSM Map
General Map
Google Map
MSN Map
OSM Map
General Map
Google Map
MSN Map
OSM Map
General Map
Google Map
MSN Map
OSM Map
General Map
Google Map
MSN Map
Please wait while loading the map...
Real estate property taxes paid for housing units in 2022:
This zip code:
1.8% ($2,205)
Illinois:
2.0% ($4,912)
Median real estate property taxes paid for housing units with mortgages in 2022: $1,938 (1.7%) Median real estate property taxes paid for housing units with no mortgage in 2022: $2,381 (1.8%)
Business Search- 14 Million verified businesses
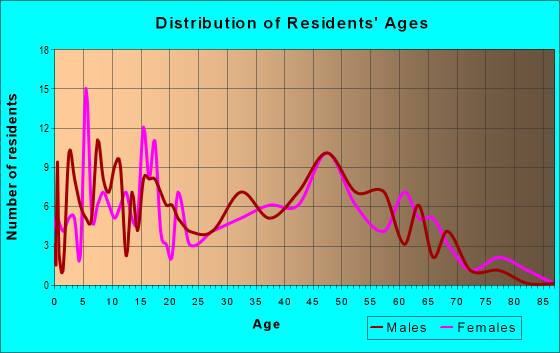
Males: 557
(53.6%)
Females: 482
(46.4%)
For population 25 years and over in 61925:
High school or higher: 94.0%
Bachelor's degree or higher: 17.7%
Graduate or professional degree: 3.4%
Unemployed: 1.8%
Mean travel time to work (commute): 23.5 minutes
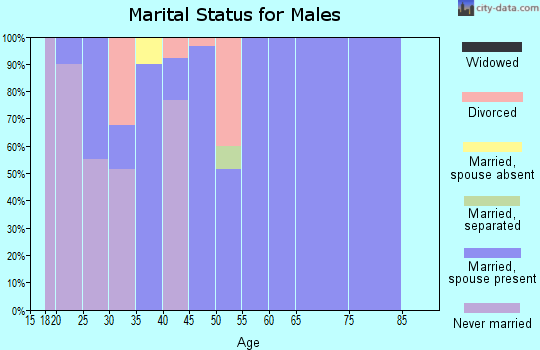
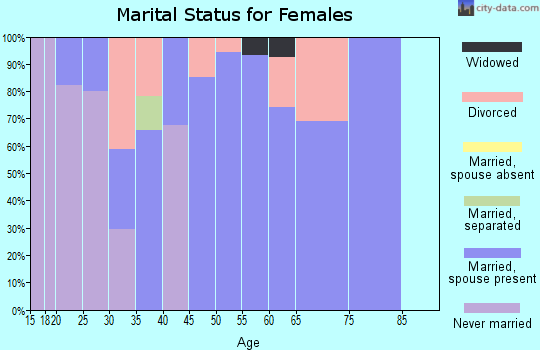
For population 15 years and over in 61925:
Never married: 21.3%
Now married: 69.8%
Separated: 1.2%
Widowed: 0.5%
Divorced: 7.3%
Zip code 61925 compared to state average:
Median house value below state average.
Unemployed percentage below state average.
Black race population percentage significantly below state average.
Hispanic race population percentage significantly below state average.
Median age above state average.
Foreign-born population percentage significantly below state average.
Renting percentage below state average.
Length of stay since moving in significantly above state average.
Number of college students significantly below state average.
Percentage of population with a bachelor's degree or higher below state average.
Averages for the 2020 tax year for zip code 61925, filed in 2021:
Average Adjusted Gross Income (AGI) in 2020: $76,815 (Individual Income Tax Returns)
Here:
$76,815
State:
$82,626
Salary/wage: $66,827 (reported on 80.4% of returns)
Here:
$66,827
State:
$66,640
(% of AGI for various income ranges: 1248.8% for AGIs below $25k, 3155.0% for AGIs $25k-50k, 6707.5% for AGIs $50k-75k, 8390.0% for AGIs $75k-100k, 13618.3% for AGIs $100k-200k)
Taxable interest for individuals: $917 (reported on 39.1% of returns)
This zip code:
$917
Illinois:
$2,376
(% of AGI for various income ranges: 2.5% for AGIs below $25k, 22.5% for AGIs $25k-50k, 200.0% for AGIs $50k-75k, 91.7% for AGIs $100k-200k)
Ordinary dividends: $1,650 (reported on 21.7% of returns)
Here:
$1,650
State:
$9,061
(% of AGI for various income ranges: 35.0% for AGIs $25k-50k, 147.5% for AGIs $75k-100k)
Net capital gain/loss in AGI: +$9,200 (reported on 15.2% of returns)
Here:
+$9,200
State:
+$31,684
(% of AGI for various income ranges: 16.2% for AGIs below $25k, 252.5% for AGIs $75k-100k)
Profit/loss from business: +$5,450 (reported on 8.7% of returns)
Here:
+$5,450
State:
+$12,175
(% of AGI for various income ranges: 58.8% for AGIs below $25k, 427.5% for AGIs $50k-75k)
Taxable individual retirement arrangement distribution: $9,650 (reported on 8.7% of returns)
61925:
$9,650
Illinois:
$21,613
(% of AGI for various income ranges: 482.5% for AGIs $25k-50k)
Taxes paid: $7,950 (reported on 4.3% of returns)
61925:
$7,950
State:
$8,563
(% of AGI for various income ranges: 198.8% for AGIs $25k-50k)
Earned income credit: $2,500 (reported on 8.7% of returns)
Here:
$2,500
State:
$2,311
(% of AGI for various income ranges: 61.3% for AGIs below $25k, 63.7% for AGIs $25k-50k)
Percentage of individuals using paid preparers for their 2020 taxes: 95.7%
Here:
96%
State:
93%
(% for various income ranges: 92.3% for AGIs below $25k, 100.0% for AGIs $25k-50k, 100.0% for AGIs $50k-75k, 100.0% for AGIs $75k-100k, 87.5% for AGIs $100k-200k, 100.0% for AGIs over 200k)
Averages for the 2012 tax year for zip code 61925, filed in 2013:
Average Adjusted Gross Income (AGI) in 2012: $68,028 (Individual Income Tax Returns)
Here:
$68,028
State:
$68,058
Salary/wage: $51,962 (reported on 87.0% of returns)
Here:
$51,962
State:
$55,396
(% of AGI for various income ranges: 71.6% for AGIs below $25k, 79.4% for AGIs $25k-50k, 78.4% for AGIs $50k-75k, 77.9% for AGIs $75k-100k, 56.1% for AGIs $100k-200k)
Taxable interest for individuals: $390 (reported on 45.7% of returns)
This zip code:
$390
Illinois:
$1,969
(% of AGI for various income ranges: 0.8% for AGIs below $25k, 0.2% for AGIs $25k-50k, 0.2% for AGIs $50k-75k, 0.1% for AGIs $75k-100k, 0.3% for AGIs $100k-200k)
Ordinary dividends: $682 (reported on 23.9% of returns)
Here:
$682
State:
$7,786
(% of AGI for various income ranges: 0.6% for AGIs $25k-50k, 0.2% for AGIs $75k-100k, 0.3% for AGIs $100k-200k)
Net capital gain/loss in AGI: +$425 (reported on 8.7% of returns)
Here:
+$425
State:
+$22,183
Profit/loss from business: +$2,140 (reported on 10.9% of returns)
Here:
+$2,140
State:
+$12,903
Taxable individual retirement arrangement distribution: $7,300 (reported on 6.5% of returns)
61925:
$7,300
Illinois:
$17,929
Total itemized deductions: $19,650 (17% of AGI, reported on 34.8% of returns)
Here:
$19,650
State:
$26,433
Here:
16.9% of AGI
State:
19.2% of AGI
(% of AGI for various income ranges: 10.7% for AGIs $50k-75k, 14.9% for AGIs $75k-100k, 11.3% for AGIs $100k-200k)
Charity contributions: $3,650 (reported on 26.1% of returns)
Here:
$3,650
State:
$4,525
(% of AGI for various income ranges: 1.0% for AGIs $50k-75k, 3.3% for AGIs $75k-100k, 1.4% for AGIs $100k-200k)
Taxes paid: $8,306 (reported on 34.8% of returns)
61925:
$8,306
State:
$11,968
(% of AGI for various income ranges: 4.1% for AGIs $50k-75k, 4.7% for AGIs $75k-100k, 5.4% for AGIs $100k-200k)
Earned income credit: $2,320 (reported on 10.9% of returns)
Here:
$2,320
State:
$2,349
(% of AGI for various income ranges: 4.9% for AGIs below $25k, 1.3% for AGIs $25k-50k)
Percentage of individuals using paid preparers for their 2012 taxes: 63.0%
Here:
63%
State:
57%
(% for various income ranges: 46.2% for AGIs below $25k, 60.0% for AGIs $25k-50k, 75.0% for AGIs $50k-75k, 66.7% for AGIs $75k-100k, 77.8% for AGIs $100k-200k)
Averages for the 2004 tax year for zip code 61925, filed in 2005:
Average Adjusted Gross Income (AGI) in 2004: $49,298 (Individual Income Tax Returns)
Here:
$49,298
State:
$54,625
Salary/wage: $43,732 (reported on 88.6% of returns)
Here:
$43,732
State:
$46,811
(% of AGI for various income ranges: 76.5% for AGIs below $10k, 69.3% for AGIs $10k-25k, 76.3% for AGIs $25k-50k, 83.5% for AGIs $50k-75k, 86.6% for AGIs $75k-100k, 71.2% for AGIs over 100k)
Taxable interest for individuals: $681 (reported on 52.0% of returns)
This zip code:
$681
Illinois:
$2,101
(% of AGI for various income ranges: 1.6% for AGIs below $10k, 1.3% for AGIs $10k-25k, 0.5% for AGIs $25k-50k, 1.2% for AGIs $50k-75k, 0.3% for AGIs $75k-100k, 0.6% for AGIs over 100k)
Taxable dividends: $461 (reported on 25.8% of returns)
Here:
$461
State:
$4,306
(% of AGI for various income ranges: 0.6% for AGIs $10k-25k, 0.3% for AGIs $25k-50k, 0.3% for AGIs $50k-75k, 0.1% for AGIs $75k-100k, 0.2% for AGIs over 100k)
Profit/loss from business: +$5,400 (reported on 13.5% of returns)
Here:
+$5,400
State:
+$11,771
(% of AGI for various income ranges: 1.3% for AGIs below $10k, 3.4% for AGIs $25k-50k, 0.7% for AGIs $50k-75k, 3.1% for AGIs $75k-100k)
Profit/loss from farming: +$6,950 (reported on 4.5% of returns)
Here:
+$6,950
State:
+$2,327
Total itemized deductions: $15,484 (18% of AGI, reported on 27.4% of returns)
Here:
$15,484
State:
$20,239
Here:
18.0% of AGI
State:
19.5% of AGI
(% of AGI for various income ranges: 9.5% for AGIs $25k-50k, 6.6% for AGIs $50k-75k, 11.2% for AGIs $75k-100k, 10.3% for AGIs over 100k)
Charity contributions deductions: $2,422 (3% of AGI, reported on 22.9% of returns)
Here:
$2,422
State:
$3,719
Here:
2.7% of AGI
State:
3.4% of AGI
(% of AGI for various income ranges: 0.8% for AGIs $25k-50k, 0.7% for AGIs $50k-75k, 1.3% for AGIs $75k-100k, 1.9% for AGIs over 100k)
Total tax: $6,508 (reported on 80.7% of returns)
61925:
$6,508
State:
$9,882
(% of AGI for various income ranges: 1.9% for AGIs below $10k, 3.9% for AGIs $10k-25k, 6.8% for AGIs $25k-50k, 9.0% for AGIs $50k-75k, 10.2% for AGIs $75k-100k, 17.2% for AGIs over 100k)
Earned income credit: $1,422 (reported on 10.1% of returns)
Here:
$1,422
State:
$1,788
Percentage of individuals using paid preparers for their 2004 taxes: 65.7%
Here:
66%
State:
61%
(% for various income ranges: 46.6% for AGIs below $10k, 63.3% for AGIs $10k-25k, 71.6% for AGIs $25k-50k, 70.8% for AGIs $50k-75k, 68.4% for AGIs $75k-100k, 74.4% for AGIs over 100k)
Household received Food Stamps/SNAP in the past 12 months: 45 Household did not receive Food Stamps/SNAP in the past 12 months: 405
Women who did not have a birth in the past 12 months: 170 (133 now married, 34 unmarried)
Housing units in zip code 61925 with a mortgage: 208 (15 second mortgage, 15 both second mortgage and home equity loan) Median monthly owner costs for units with a mortgage: $1,085 Median monthly owner costs for units without a mortgage: $474
Residents with income below the poverty level in 2022:
This zip code:
16.4%
Whole state:
11.9%
Residents with income below 50% of the poverty level in 2022:
This zip code:
0.4%
Whole state:
5.7%
Median number of rooms in houses and condos:
Here:
6.4
State:
6.4
Median number of rooms in apartments:
Here:
3.8
State:
4.1
Notable locations in this zip code not listed on our city pages
Size of family households: 174 2-persons, 56 3-persons, 57 4-persons, 11 5-persons, 1 6-persons, 12 7-or-more-persons
Size of nonfamily households: 137 1-person, 3 2-persons
158 married couples with children.
13 single-parent households (13 men).
98.8% of residents of 61925 zip code speak English at home.
Foreign born population: 0 (0.0%)
:
0.0%
Whole state:
14.4%
49%American
30%English
14%German
6%Irish
1%Italian
1%Scandinavian
1%Scotch-Irish
Year of entry for the foreign-born population
02010 or later
02000 to 2009
01990 to 1999
6Before 1990
Facilities with environmental interests located in this zip code:
DALTON CITY STP (EAST OAK STREET in DALTON CITY, IL)
STATE MASTER (Illinois EPA Project) - National Pollutant Discharge Elimination System Permit National Pollutant Discharge Elimination System NON-MAJOR (Tracking pollutant discharge elimination systems) - permit National Pollutant Discharge Elimination System NON-MAJOR (Tracking pollutant discharge elimination systems) - permit Business SIC classification: SEWERAGE SYSTEMS Alternative names: DALTON CITY STP, VILLAGE OF
HERITAGE GRAIN COOPERATIVE (200 W MAIN ST in DALTON CITY, IL)
STATE MASTER (Illinois EPA Project) - AIR PROGRAM AIR MINOR (AIRS/AFS) CRITERIA AND HAZARDOUS AIR POLLUTANT INVENTORY (Inventory of air pollution sources) Business SIC classification: GRAIN AND FIELD BEANS Alternative names: FARMERS COOP GRAIN COMPANY
KAISER AGRICULTURAL CHEMICALS (WEST ROANYE ST in DALTON CITY, IL)
(Resource Conservation and Recovery Act (tracking hazardous waste))
Housing units lacking complete kitchen facilities: 1.2%
74.1%Utility gas
14.9%Bottled, tank, or LP gas
11.5%Electricity
Population in 1990: 715. Population change in the 1990s: +209 (+29.2%).
Place of birth for U.S.-born residents:
This state: 959
Northeast: 9
Midwest: 38
South: 18
West: 2
58% of the 61925 zip code residents lived in the same house 5 years ago. Out of people who lived in different houses, 48% lived in this county. Out of people who lived in different counties, 50% lived in Illinois.
94% of the 61925 zip code residents lived in the same house 1 year ago. Out of people who lived in different houses, 74% moved from this county. Out of people who lived in different houses, 13% moved from different county within same state. Out of people who lived in different houses, 7% moved from different state.
Private vs. public school enrollment:
Students in private schools in grades 1 to 8 (elementary and middle school):
Here:
0.0%
Illinois:
13.3%
Students in private schools in grades 9 to 12 (high school):
Here:
0.0%
Illinois:
9.9%
Students in private undergraduate colleges:
Here:
0.0%
Illinois:
27.4%
Occupation by median earnings in the past 12 months ($)
149,295Management occupations
77,384Architecture and engineering occupations
76,848Health diagnosing and treating practitioners and other technical occupations
70,406Material moving occupations
63,418Transportation occupations
57,977Production occupations
Top industries in this zip code by the number of employees in 2005:
Construction: Commercial and Institutional Building Construction (10-19 employees: 1 establishment)
Wholesale Trade: Grain and Field Bean Merchant Wholesalers (10-19: 1)
Construction: Site Preparation Contractors (5-9: 1)
Accommodation and Food Services: Full-Service Restaurants (1-4: 2)
Professional, Scientific, and Technical Services: Photography Studios, Portrait (1-4: 1)
Other Services (except Public Administration): Commercial and Industrial Machinery and Equipment (except Automotive and Electronic) Repair and Maintenance (1-4: 1)
Accommodation and Food Services: Caterers (1-4: 1)
Home Mortgage Disclosure Act Aggregated Statistics For Year 2009 (Based on 2 partial tracts)
A) FHA, FSA/RHS & VA Home Purchase Loans
B) Conventional Home Purchase Loans
C) Refinancings
D) Home Improvement Loans
E) Loans on Dwellings For 5+ Families
F) Non-occupant Loans on < 5 Family Dwellings (A B C & D)
Number
Average Value
Number
Average Value
Number
Average Value
Number
Average Value
Number
Average Value
Number
Average Value
LOANS ORIGINATED
30
$129,385
62
$140,591
298
$135,842
9
$63,734
1
$253,610
10
$65,384
APPLICATIONS APPROVED, NOT ACCEPTED
0
$0
3
$155,543
11
$188,296
1
$35,040
0
$0
0
$0
APPLICATIONS DENIED
6
$83,305
4
$300,175
26
$113,679
2
$23,055
0
$0
0
$0
APPLICATIONS WITHDRAWN
1
$87,610
4
$116,890
30
$113,922
1
$131,870
0
$0
0
$0
FILES CLOSED FOR INCOMPLETENESS
0
$0
2
$88,990
2
$135,100
0
$0
0
$0
0
$0
Aggregated Statistics For Year 2008 (Based on 2 partial tracts)
A) FHA, FSA/RHS & VA Home Purchase Loans
B) Conventional Home Purchase Loans
C) Refinancings
D) Home Improvement Loans
E) Loans on Dwellings For 5+ Families
F) Non-occupant Loans on < 5 Family Dwellings (A B C & D)
G) Loans On Manufactured Home Dwelling (A B C & D)
Number
Average Value
Number
Average Value
Number
Average Value
Number
Average Value
Number
Average Value
Number
Average Value
Number
Average Value
LOANS ORIGINATED
30
$141,558
88
$126,656
129
$132,261
14
$66,728
4
$235,160
16
$72,911
0
$0
APPLICATIONS APPROVED, NOT ACCEPTED
0
$0
5
$228,522
12
$155,083
3
$75,927
0
$0
0
$0
0
$0
APPLICATIONS DENIED
1
$136,490
7
$111,323
45
$118,288
13
$48,096
0
$0
1
$64,550
1
$34,120
APPLICATIONS WITHDRAWN
2
$110,665
4
$224,325
26
$123,043
4
$37,350
0
$0
0
$0
0
$0
FILES CLOSED FOR INCOMPLETENESS
1
$89,450
0
$0
3
$105,437
2
$136,485
0
$0
0
$0
0
$0
Aggregated Statistics For Year 2007 (Based on 2 partial tracts)
A) FHA, FSA/RHS & VA Home Purchase Loans
B) Conventional Home Purchase Loans
C) Refinancings
D) Home Improvement Loans
E) Loans on Dwellings For 5+ Families
F) Non-occupant Loans on < 5 Family Dwellings (A B C & D)
G) Loans On Manufactured Home Dwelling (A B C & D)
Number
Average Value
Number
Average Value
Number
Average Value
Number
Average Value
Number
Average Value
Number
Average Value
Number
Average Value
LOANS ORIGINATED
11
$128,689
136
$120,218
87
$119,727
22
$49,757
1
$296,030
10
$62,249
2
$48,415
APPLICATIONS APPROVED, NOT ACCEPTED
0
$0
4
$102,132
12
$87,148
5
$32,830
0
$0
0
$0
0
$0
APPLICATIONS DENIED
2
$61,785
18
$116,351
72
$114,955
22
$83,962
0
$0
3
$84,537
2
$66,400
APPLICATIONS WITHDRAWN
0
$0
6
$130,952
31
$100,906
3
$119,887
0
$0
1
$64,550
0
$0
FILES CLOSED FOR INCOMPLETENESS
0
$0
1
$62,710
7
$134,377
2
$91,300
0
$0
0
$0
0
$0
Aggregated Statistics For Year 2006 (Based on 2 partial tracts)
A) FHA, FSA/RHS & VA Home Purchase Loans
B) Conventional Home Purchase Loans
C) Refinancings
D) Home Improvement Loans
F) Non-occupant Loans on < 5 Family Dwellings (A B C & D)
Number
Average Value
Number
Average Value
Number
Average Value
Number
Average Value
Number
Average Value
LOANS ORIGINATED
17
$117,608
135
$116,102
78
$117,368
19
$69,602
9
$100,827
APPLICATIONS APPROVED, NOT ACCEPTED
2
$107,895
9
$122,346
6
$146,630
2
$43,805
0
$0
APPLICATIONS DENIED
1
$99,600
14
$103,814
50
$112,306
7
$52,170
0
$0
APPLICATIONS WITHDRAWN
0
$0
7
$204,333
29
$114,003
5
$86,872
1
$13,830
FILES CLOSED FOR INCOMPLETENESS
0
$0
4
$70,088
6
$109,127
0
$0
0
$0
Aggregated Statistics For Year 2005 (Based on 2 partial tracts)
A) FHA, FSA/RHS & VA Home Purchase Loans
B) Conventional Home Purchase Loans
C) Refinancings
D) Home Improvement Loans
E) Loans on Dwellings For 5+ Families
F) Non-occupant Loans on < 5 Family Dwellings (A B C & D)
Number
Average Value
Number
Average Value
Number
Average Value
Number
Average Value
Number
Average Value
Number
Average Value
LOANS ORIGINATED
13
$104,776
138
$103,220
89
$108,612
15
$89,761
3
$138,330
9
$65,783
APPLICATIONS APPROVED, NOT ACCEPTED
1
$126,340
6
$129,415
28
$97,160
3
$20,290
0
$0
2
$53,950
APPLICATIONS DENIED
1
$90,380
6
$101,750
66
$121,074
8
$28,589
0
$0
2
$37,350
APPLICATIONS WITHDRAWN
1
$82,080
13
$154,149
39
$116,765
5
$131,506
0
$0
1
$58,100
FILES CLOSED FOR INCOMPLETENESS
1
$56,250
1
$78,390
6
$85,150
0
$0
0
$0
0
$0
Aggregated Statistics For Year 2004 (Based on 2 partial tracts)
A) FHA, FSA/RHS & VA Home Purchase Loans
B) Conventional Home Purchase Loans
C) Refinancings
D) Home Improvement Loans
F) Non-occupant Loans on < 5 Family Dwellings (A B C & D)
Number
Average Value
Number
Average Value
Number
Average Value
Number
Average Value
Number
Average Value
LOANS ORIGINATED
17
$104,751
117
$107,606
139
$113,603
18
$34,583
12
$73,392
APPLICATIONS APPROVED, NOT ACCEPTED
3
$108,203
6
$110,510
9
$77,977
5
$37,442
0
$0
APPLICATIONS DENIED
0
$0
9
$90,273
45
$81,707
4
$33,200
1
$59,940
APPLICATIONS WITHDRAWN
0
$0
3
$79,003
38
$107,679
2
$78,385
0
$0
FILES CLOSED FOR INCOMPLETENESS
0
$0
0
$0
4
$94,755
1
$32,280
0
$0
Aggregated Statistics For Year 2003 (Based on 2 partial tracts)
A) FHA, FSA/RHS & VA Home Purchase Loans
B) Conventional Home Purchase Loans
C) Refinancings
D) Home Improvement Loans
F) Non-occupant Loans on < 5 Family Dwellings (A B C & D)
Number
Average Value
Number
Average Value
Number
Average Value
Number
Average Value
Number
Average Value
LOANS ORIGINATED
18
$98,061
93
$104,566
445
$98,746
14
$17,983
8
$61,902
APPLICATIONS APPROVED, NOT ACCEPTED
2
$97,290
4
$69,858
23
$98,475
2
$11,990
0
$0
APPLICATIONS DENIED
0
$0
9
$78,899
40
$89,569
6
$32,430
1
$70,090
APPLICATIONS WITHDRAWN
0
$0
5
$42,236
41
$98,698
1
$18,440
0
$0
FILES CLOSED FOR INCOMPLETENESS
0
$0
0
$0
3
$122,653
2
$93,605
0
$0
Aggregated Statistics For Year 2002 (Based on 2 partial tracts)
A) FHA, FSA/RHS & VA Home Purchase Loans
B) Conventional Home Purchase Loans
C) Refinancings
D) Home Improvement Loans
F) Non-occupant Loans on < 5 Family Dwellings (A B C & D)
Number
Average Value
Number
Average Value
Number
Average Value
Number
Average Value
Number
Average Value
LOANS ORIGINATED
14
$82,998
80
$104,347
267
$98,976
14
$23,582
8
$77,234
APPLICATIONS APPROVED, NOT ACCEPTED
0
$0
5
$105,316
18
$88,736
1
$4,610
1
$71,930
APPLICATIONS DENIED
2
$97,290
5
$83,736
53
$81,101
8
$22,940
0
$0
APPLICATIONS WITHDRAWN
1
$84,840
4
$72,622
17
$77,845
0
$0
0
$0
FILES CLOSED FOR INCOMPLETENESS
0
$0
1
$138,330
5
$61,972
0
$0
1
$33,200
Aggregated Statistics For Year 2001 (Based on 2 partial tracts)
A) FHA, FSA/RHS & VA Home Purchase Loans
B) Conventional Home Purchase Loans
C) Refinancings
D) Home Improvement Loans
E) Loans on Dwellings For 5+ Families
F) Non-occupant Loans on < 5 Family Dwellings (A B C & D)
Number
Average Value
Number
Average Value
Number
Average Value
Number
Average Value
Number
Average Value
Number
Average Value
LOANS ORIGINATED
24
$87,032
80
$92,416
246
$88,951
18
$17,983
1
$324,610
6
$58,407
APPLICATIONS APPROVED, NOT ACCEPTED
2
$84,380
3
$57,483
20
$91,528
2
$12,910
0
$0
1
$51,640
APPLICATIONS DENIED
0
$0
5
$78,756
33
$60,306
6
$21,210
0
$0
0
$0
APPLICATIONS WITHDRAWN
0
$0
5
$98,676
20
$103,840
1
$27,670
0
$0
0
$0
FILES CLOSED FOR INCOMPLETENESS
0
$0
0
$0
4
$48,415
1
$10,140
0
$0
1
$9,220
Aggregated Statistics For Year 2000 (Based on 2 partial tracts)
A) FHA, FSA/RHS & VA Home Purchase Loans
B) Conventional Home Purchase Loans
C) Refinancings
D) Home Improvement Loans
E) Loans on Dwellings For 5+ Families
F) Non-occupant Loans on < 5 Family Dwellings (A B C & D)
Number
Average Value
Number
Average Value
Number
Average Value
Number
Average Value
Number
Average Value
Number
Average Value
LOANS ORIGINATED
12
$78,772
85
$105,283
57
$66,706
27
$10,213
1
$237,930
7
$59,416
APPLICATIONS APPROVED, NOT ACCEPTED
0
$0
0
$0
8
$59,942
6
$21,365
0
$0
0
$0
APPLICATIONS DENIED
0
$0
6
$47,647
21
$69,516
5
$10,698
0
$0
1
$21,210
APPLICATIONS WITHDRAWN
0
$0
5
$89,084
15
$77,526
1
$72,850
0
$0
1
$253,610
FILES CLOSED FOR INCOMPLETENESS
0
$0
1
$65,480
5
$68,058
0
$0
0
$0
1
$65,480
Aggregated Statistics For Year 1999 (Based on 1 partial tract)
A) FHA, FSA/RHS & VA Home Purchase Loans
B) Conventional Home Purchase Loans
C) Refinancings
D) Home Improvement Loans
E) Loans on Dwellings For 5+ Families
F) Non-occupant Loans on < 5 Family Dwellings (A B C & D)


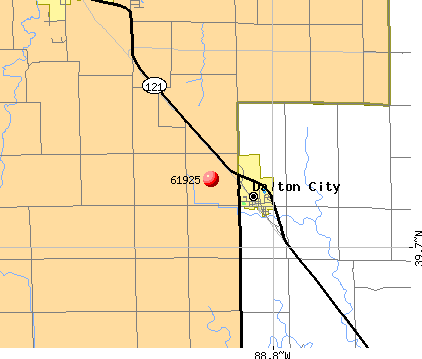 Nearest zip codes: 62549, 61914, 62544, 62521, 61936, 62532.