Estimated zip code population in 2022: 2,045 Zip code population in 2010: 1,872 Zip code population in 2000: 1,208
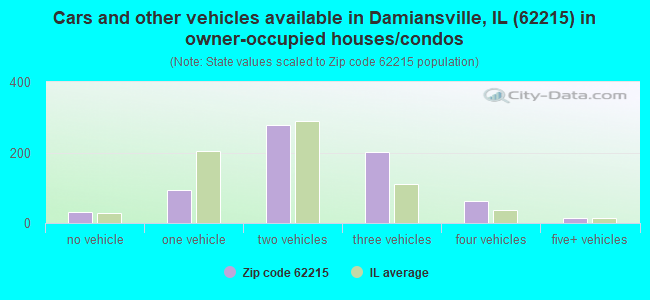
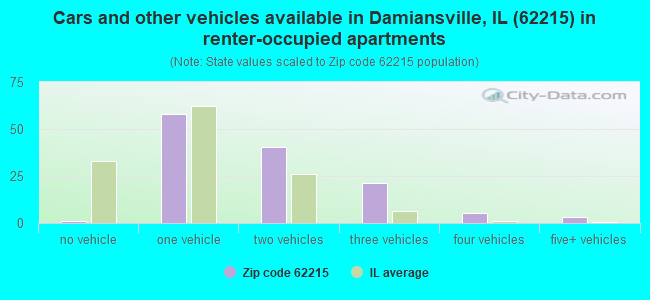
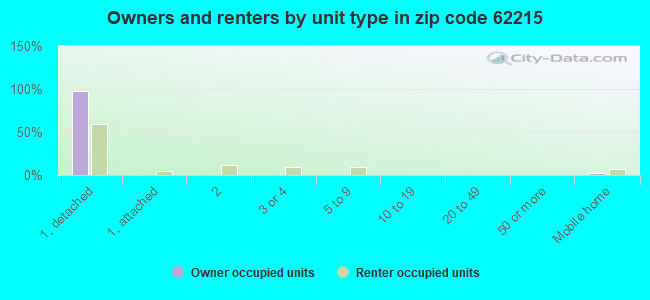
Houses and condos: 833 Renter-occupied apartments: 132
% of renters here:
16%
State:
33%
March 2022 cost of living index in zip code 62215: 94.5 (less than average, U.S. average is 100)
Land area: 10.7 sq. mi. Water area: 0.1 sq. mi.
Population density: 191 people per square mile
(very low).
OSM Map
General Map
Google Map
MSN Map
OSM Map
General Map
Google Map
MSN Map
OSM Map
General Map
Google Map
MSN Map
OSM Map
General Map
Google Map
MSN Map
Please wait while loading the map...
Real estate property taxes paid for housing units in 2022:
This zip code:
1.8% ($3,866)
Illinois:
2.0% ($4,912)
Median real estate property taxes paid for housing units with mortgages in 2022: $3,877 (1.8%) Median real estate property taxes paid for housing units with no mortgage in 2022: $3,716 (1.8%)
Business Search- 14 Million verified businesses
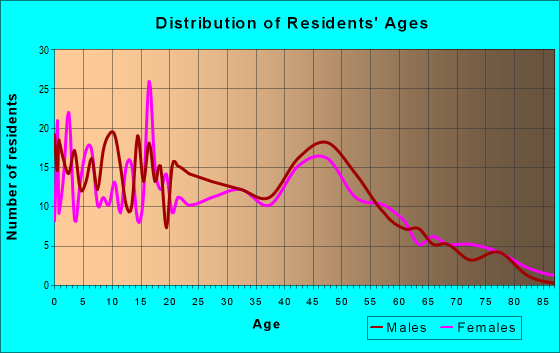
Males: 1,041
(50.9%)
Females: 1,003
(49.1%)
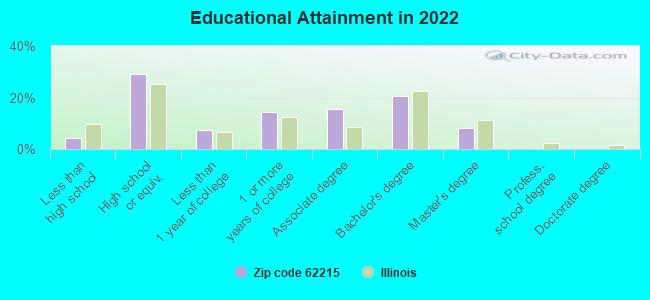
For population 25 years and over in 62215:
High school or higher: 95.0%
Bachelor's degree or higher: 29.1%
Graduate or professional degree: 8.6%
Unemployed: 1.7%
Mean travel time to work (commute): 28.5 minutes
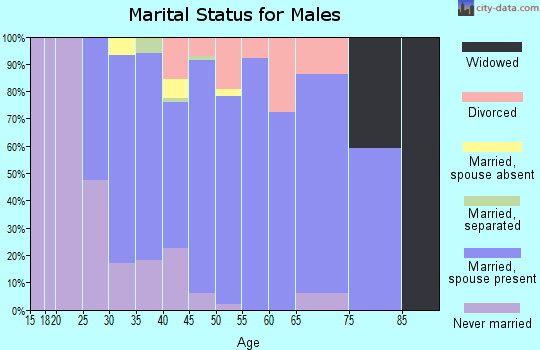
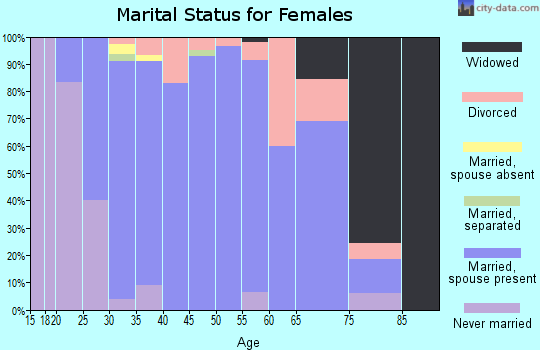
For population 15 years and over in 62215:
Never married: 30.8%
Now married: 55.0%
Separated: 0.9%
Widowed: 6.1%
Divorced: 7.1%
Zip code 62215 compared to state average:
Unemployed percentage below state average.
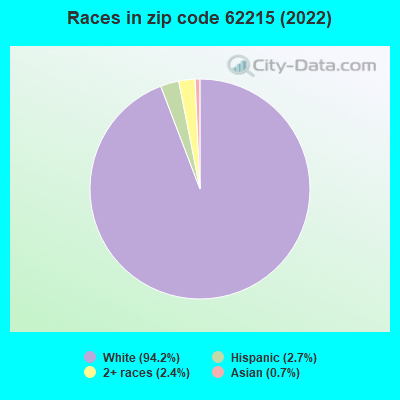
Black race population percentage significantly below state average.
Hispanic race population percentage significantly below state average.
Median age above state average.
Foreign-born population percentage significantly below state average.
Renting percentage below state average.
Length of stay since moving in significantly above state average.
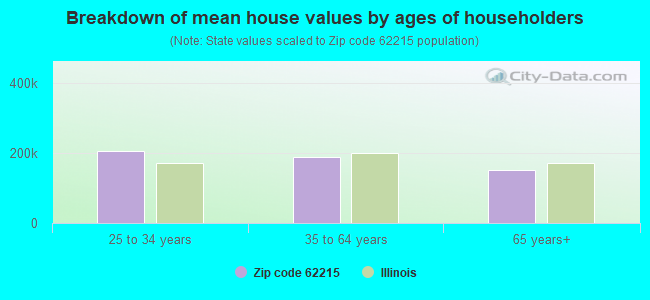
Estimated median house/condo value in 2022: $213,192
62215:
$213,192
Illinois:
$251,600
Median resident age:
This zip code:
43.4 years
Illinois median age:
39.1 years
Average household size:
This zip code:
2.4 people
Illinois:
2.4 people
Averages for the 2020 tax year for zip code 62215, filed in 2021:
Average Adjusted Gross Income (AGI) in 2020: $75,274 (Individual Income Tax Returns)
Here:
$75,274
State:
$82,626
Salary/wage: $64,538 (reported on 87.6% of returns)
Here:
$64,538
State:
$66,640
(% of AGI for various income ranges: 1363.3% for AGIs below $25k, 3680.9% for AGIs $25k-50k, 5981.7% for AGIs $50k-75k, 11071.7% for AGIs $75k-100k, 14946.0% for AGIs $100k-200k)
Taxable interest for individuals: $715 (reported on 52.8% of returns)
This zip code:
$715
Illinois:
$2,376
(% of AGI for various income ranges: 30.7% for AGIs below $25k, 27.3% for AGIs $25k-50k, 43.3% for AGIs $50k-75k, 163.3% for AGIs $75k-100k, 66.0% for AGIs $100k-200k)
Ordinary dividends: $1,960 (reported on 28.1% of returns)
Here:
$1,960
State:
$9,061
(% of AGI for various income ranges: 19.3% for AGIs below $25k, 36.4% for AGIs $25k-50k, 30.8% for AGIs $50k-75k, 121.7% for AGIs $75k-100k, 168.0% for AGIs $100k-200k)
Net capital gain/loss in AGI: +$4,865 (reported on 25.8% of returns)
Here:
+$4,865
State:
+$31,684
(% of AGI for various income ranges: 20.7% for AGIs below $25k, 30.9% for AGIs $25k-50k, 12.5% for AGIs $50k-75k, 291.7% for AGIs $75k-100k, 524.0% for AGIs $100k-200k)
Profit/loss from business: +$6,350 (reported on 11.2% of returns)
Here:
+$6,350
State:
+$12,175
(% of AGI for various income ranges: 13.3% for AGIs below $25k, 412.5% for AGIs $50k-75k, 80.0% for AGIs $100k-200k)
Taxable individual retirement arrangement distribution: $14,810 (reported on 11.2% of returns)
62215:
$14,810
Illinois:
$21,613
(% of AGI for various income ranges: 234.0% for AGIs below $25k, 326.7% for AGIs $50k-75k, 492.0% for AGIs $100k-200k)
Total itemized deductions: $24,950 (reported on 4.5% of returns)
Here:
$24,950
State:
$34,948
(% of AGI for various income ranges: 665.3% for AGIs $100k-200k)
Charity contributions: $5,050 (reported on 2.2% of returns)
Here:
$5,050
State:
$13,122
(% of AGI for various income ranges: 84.2% for AGIs $50k-75k)
Taxes paid: $7,700 (reported on 4.5% of returns)
62215:
$7,700
State:
$8,563
(% of AGI for various income ranges: 205.3% for AGIs $100k-200k)
Earned income credit: $1,738 (reported on 9.0% of returns)
Here:
$1,738
State:
$2,311
(% of AGI for various income ranges: 54.7% for AGIs below $25k, 51.8% for AGIs $25k-50k)
Percentage of individuals using paid preparers for their 2020 taxes: 94.4%
Here:
94%
State:
93%
(% for various income ranges: 91.7% for AGIs below $25k, 92.9% for AGIs $25k-50k, 93.8% for AGIs $50k-75k, 100.0% for AGIs $75k-100k, 95.2% for AGIs $100k-200k, 100.0% for AGIs over 200k)
Averages for the 2012 tax year for zip code 62215, filed in 2013:
Average Adjusted Gross Income (AGI) in 2012: $59,066 (Individual Income Tax Returns)
Here:
$59,066
State:
$68,058
Salary/wage: $52,894 (reported on 88.9% of returns)
Here:
$52,894
State:
$55,396
(% of AGI for various income ranges: 80.0% for AGIs below $25k, 75.7% for AGIs $25k-50k, 82.1% for AGIs $50k-75k, 81.3% for AGIs $75k-100k, 79.3% for AGIs $100k-200k)
Taxable interest for individuals: $738 (reported on 52.2% of returns)
This zip code:
$738
Illinois:
$1,969
(% of AGI for various income ranges: 1.6% for AGIs below $25k, 0.8% for AGIs $25k-50k, 0.9% for AGIs $50k-75k, 0.9% for AGIs $75k-100k, 0.3% for AGIs $100k-200k)
Ordinary dividends: $1,355 (reported on 24.4% of returns)
Here:
$1,355
State:
$7,786
(% of AGI for various income ranges: 0.3% for AGIs below $25k, 0.8% for AGIs $25k-50k, 0.4% for AGIs $50k-75k, 0.5% for AGIs $75k-100k, 0.6% for AGIs $100k-200k)
Net capital gain/loss in AGI: +$3,636 (reported on 15.6% of returns)
Here:
+$3,636
State:
+$22,183
(% of AGI for various income ranges: 0.3% for AGIs $50k-75k, 1.8% for AGIs $100k-200k)
Profit/loss from business: +$6,145 (reported on 12.2% of returns)
Here:
+$6,145
State:
+$12,903
(% of AGI for various income ranges: 4.3% for AGIs below $25k, 3.2% for AGIs $50k-75k, 1.0% for AGIs $100k-200k)
Taxable individual retirement arrangement distribution: $12,788 (reported on 8.9% of returns)
62215:
$12,788
Illinois:
$17,929
(% of AGI for various income ranges: 3.8% for AGIs $25k-50k, 2.9% for AGIs $50k-75k, 1.9% for AGIs $100k-200k)
Total itemized deductions: $18,047 (18% of AGI, reported on 35.6% of returns)
Here:
$18,047
State:
$26,433
Here:
18.2% of AGI
State:
19.2% of AGI
(% of AGI for various income ranges: 11.5% for AGIs $25k-50k, 11.6% for AGIs $50k-75k, 10.2% for AGIs $75k-100k, 12.1% for AGIs $100k-200k)
Charity contributions: $2,200 (reported on 26.7% of returns)
Here:
$2,200
State:
$4,525
(% of AGI for various income ranges: 0.8% for AGIs $25k-50k, 0.7% for AGIs $50k-75k, 0.5% for AGIs $75k-100k, 1.4% for AGIs $100k-200k)
Taxes paid: $8,444 (reported on 35.6% of returns)
62215:
$8,444
State:
$11,968
(% of AGI for various income ranges: 3.3% for AGIs $25k-50k, 4.4% for AGIs $50k-75k, 4.8% for AGIs $75k-100k, 6.5% for AGIs $100k-200k)
Earned income credit: $2,062 (reported on 8.9% of returns)
Here:
$2,062
State:
$2,349
(% of AGI for various income ranges: 3.6% for AGIs below $25k, 0.6% for AGIs $25k-50k)
Percentage of individuals using paid preparers for their 2012 taxes: 64.4%
Here:
64%
State:
57%
(% for various income ranges: 55.2% for AGIs below $25k, 68.4% for AGIs $25k-50k, 64.3% for AGIs $50k-75k, 77.8% for AGIs $75k-100k, 68.4% for AGIs $100k-200k)
Averages for the 2004 tax year for zip code 62215, filed in 2005:
Average Adjusted Gross Income (AGI) in 2004: $51,053 (Individual Income Tax Returns)
Here:
$51,053
State:
$54,625
Salary/wage: $47,655 (reported on 89.9% of returns)
Here:
$47,655
State:
$46,811
(% of AGI for various income ranges: 110.3% for AGIs below $10k, 75.8% for AGIs $10k-25k, 81.8% for AGIs $25k-50k, 87.6% for AGIs $50k-75k, 83.2% for AGIs $75k-100k, 84.7% for AGIs over 100k)
Taxable interest for individuals: $1,017 (reported on 66.1% of returns)
This zip code:
$1,017
Illinois:
$2,101
(% of AGI for various income ranges: 8.6% for AGIs below $10k, 3.9% for AGIs $10k-25k, 1.7% for AGIs $25k-50k, 0.9% for AGIs $50k-75k, 1.7% for AGIs $75k-100k, 0.3% for AGIs over 100k)
Taxable dividends: $774 (reported on 33.5% of returns)
Here:
$774
State:
$4,306
(% of AGI for various income ranges: 2.9% for AGIs below $10k, 1.2% for AGIs $10k-25k, 0.3% for AGIs $25k-50k, 0.3% for AGIs $50k-75k, 0.5% for AGIs $75k-100k, 0.6% for AGIs over 100k)
Net capital gain/loss: +$1,957 (reported on 22.9% of returns)
Here:
+$1,957
State:
+$17,321
(% of AGI for various income ranges: -0.4% for AGIs $10k-25k, 1.1% for AGIs $25k-50k, 0.1% for AGIs $50k-75k, 0.9% for AGIs $75k-100k, 1.7% for AGIs over 100k)
Profit/loss from business: +$5,425 (reported on 10.4% of returns)
Here:
+$5,425
State:
+$11,771
(% of AGI for various income ranges: 1.4% for AGIs $10k-25k, 3.6% for AGIs $25k-50k, 1.4% for AGIs $50k-75k, 0.2% for AGIs $75k-100k)
Profit/loss from farming: +$3,458 (reported on 3.4% of returns)
Here:
+$3,458
State:
+$2,327
IRA payment deduction: $2,667 (reported on 2.6% of returns)
62215:
$2,667
Illinois:
$3,087
Total itemized deductions: $14,301 (18% of AGI, reported on 35.5% of returns)
Here:
$14,301
State:
$20,239
Here:
18.5% of AGI
State:
19.5% of AGI
(% of AGI for various income ranges: 8.6% for AGIs $10k-25k, 7.9% for AGIs $25k-50k, 9.5% for AGIs $50k-75k, 11.0% for AGIs $75k-100k, 11.2% for AGIs over 100k)
Charity contributions deductions: $1,556 (2% of AGI, reported on 30.8% of returns)
Here:
$1,556
State:
$3,719
Here:
1.9% of AGI
State:
3.4% of AGI
(% of AGI for various income ranges: 1.1% for AGIs $10k-25k, 0.7% for AGIs $25k-50k, 0.9% for AGIs $50k-75k, 0.9% for AGIs $75k-100k, 1.1% for AGIs over 100k)
Total tax: $6,037 (reported on 85.3% of returns)
62215:
$6,037
State:
$9,882
(% of AGI for various income ranges: 2.3% for AGIs below $10k, 5.1% for AGIs $10k-25k, 7.2% for AGIs $25k-50k, 8.2% for AGIs $50k-75k, 10.2% for AGIs $75k-100k, 14.9% for AGIs over 100k)
Earned income credit: $1,452 (reported on 6.0% of returns)
Here:
$1,452
State:
$1,788
Percentage of individuals using paid preparers for their 2004 taxes: 67.0%
Here:
67%
State:
61%
(% for various income ranges: 57.6% for AGIs below $10k, 65.3% for AGIs $10k-25k, 68.8% for AGIs $25k-50k, 62.9% for AGIs $50k-75k, 72.0% for AGIs $75k-100k, 73.3% for AGIs over 100k)
Likely homosexual households (counted as self-reported same-sex unmarried-partner households)
Lesbian couples: 0.0% of all households
Gay men: 0.2% of all households
Household received Food Stamps/SNAP in the past 12 months: 40 Household did not receive Food Stamps/SNAP in the past 12 months: 769
Women who had a birth in the past 12 months: 7 (7 now married, 0 unmarried) Women who did not have a birth in the past 12 months: 425 (189 now married, 235 unmarried)
Housing units in zip code 62215 with a mortgage: 479 (44 second mortgage, 9 home equity loan, 34 both second mortgage and home equity loan) Houses without a mortgage: 6
Median monthly owner costs for units with a mortgage: $1,562 Median monthly owner costs for units without a mortgage: $714
Residents with income below the poverty level in 2022:
This zip code:
6.0%
Whole state:
11.9%
Residents with income below 50% of the poverty level in 2022:
This zip code:
1.2%
Whole state:
5.7%
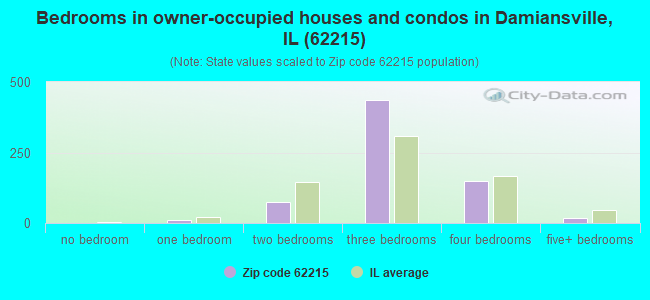
Median number of rooms in houses and condos:
Here:
6.5
State:
6.4
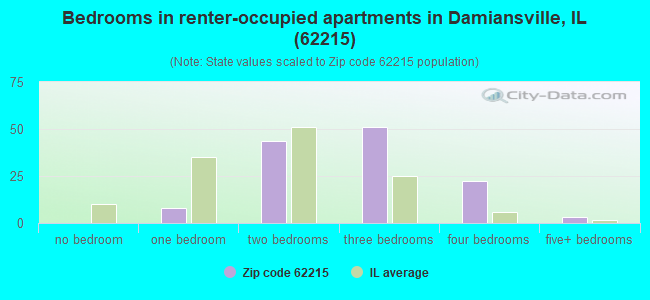
Median number of rooms in apartments:
Here:
5.4
State:
4.1
Notable locations in this zip code not listed on our city pages
In group quarters: 57 (-1 institutionalized population)
Size of family households: 251 2-persons, 152 3-persons, 106 4-persons, 55 5-persons, 18 6-persons
Size of nonfamily households: 182 1-person, 46 2-persons, 1 3-persons
287 married couples with children.
143 single-parent households (59 men, 84 women).
94.1% of residents of 62215 zip code speak English at home.
2.8% of residents speak Spanish at home (38% very well, 27% well, 18% not well, 16% not at all).
1.9% of residents speak other Indo-European language at home (16% very well, 84% not well).
0.6% of residents speak Asian or Pacific Island language at home (91% very well, 9% not at all).
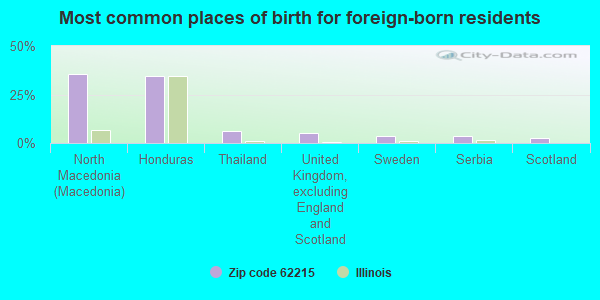
Foreign born population: 81 (4.0%) (66.9% of them are naturalized citizens)
This zip code:
4.0%
Whole state:
14.4%
36%North Macedonia (Macedonia)
35%Honduras
6%Thailand
5%United Kingdom, excluding England and Scotland
4%Sweden
4%Serbia
2%Scotland
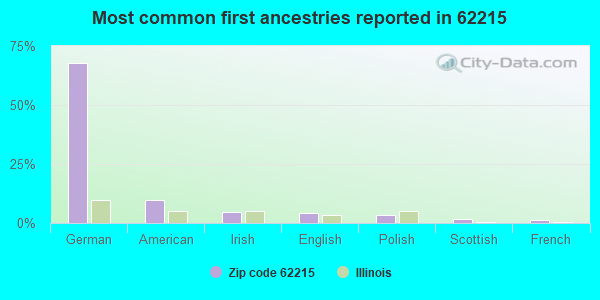
68%German
10%American
5%Irish
4%English
3%Polish
2%Scottish
1%French
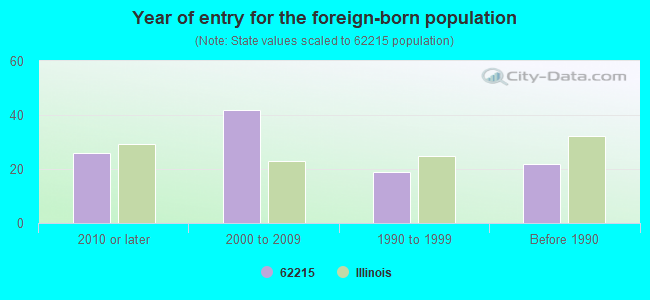
Year of entry for the foreign-born population
262010 or later
422000 to 2009
191990 to 1999
22Before 1990
Facilities with environmental interests located in this zip code:
KEHRER BROTHERS ROOFING (7100 ALBERS ROAD in ALBERS, IL)
STATE MASTER (Illinois EPA Project) - SOLID WASTE PROGRAM, HAZARDOUS WASTE PROGRAM STATE MASTER (Illinois EPA Project) - National Pollutant Discharge Elimination System Permit, COMPLIANCE ACTIVITY (Tracking inspections of insecticide, fungicide, and rodenticide, and toxic substances) National Pollutant Discharge Elimination System NON-MAJOR (Tracking pollutant discharge elimination systems) - permit National Pollutant Discharge Elimination System NON-MAJOR (Tracking pollutant discharge elimination systems) - permit Conditionally Exempt Small Quantity Generators, less than 100 kg/month of hazardous waste (Resource Conservation and Recovery Act (tracking hazardous waste)) - notification USED OIL PROGRAM (Resource Conservation and Recovery Act (tracking hazardous waste)) Business SIC classification: BITUMINOUS COAL UNDERGROUND MINING Organizations: MONTEREY COAL CO (CONTACT/OWNER)
Alternative names: ENSR OPERATIONS, MONTEREY COAL COMPANY 2 MINE, MONTEREY COAL CO MINE 2, MONTEREY COAL COMPANY MINE NUMBER 2, MONTEREY COAL-ALBERS MINE 2, MONTEREY COAL-MONTEREY MINE #2
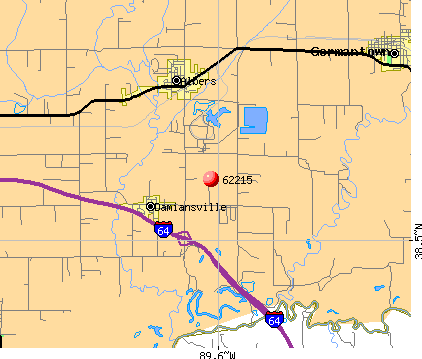
DAMIANSVILLE STP (CLINTON COUNTY HIGHWAY 8 in ALBERS, IL)
STATE MASTER (Illinois EPA Project) - National Pollutant Discharge Elimination System Permit National Pollutant Discharge Elimination System NON-MAJOR (Tracking pollutant discharge elimination systems) - permit National Pollutant Discharge Elimination System NON-MAJOR (Tracking pollutant discharge elimination systems) - permit Business SIC classification: SEWERAGE SYSTEMS Alternative names: DAMIANSVILLE STP, VILLAGE OF
HAAS SEED HOUSE (305 N. BROADWAY in ALBERS, IL)
STATE MASTER (Illinois EPA Project) - AIR PROGRAM AIR MINOR (AIRS/AFS) COMPLIANCE ACTIVITY (Tracking inspections of insecticide, fungicide, and rodenticide, and toxic substances) Business SIC classification: NONCLASSIFIABLE ESTABLISHMENTS
LUCHTEFELD TRUCKING INC (P.O. BOX 255 in ALBERS, IL)
STATE MASTER (Illinois EPA Project) - National Pollutant Discharge Elimination System Permit National Pollutant Discharge Elimination System NON-MAJOR (Tracking pollutant discharge elimination systems) - permit
MONTEREY COAL CO MINE #2 (SE 1 MILE OF ALBERS in ALBERS, IL)
STATE MASTER (Illinois EPA Project) - AIR PROGRAM AIR MINOR (AIRS/AFS) Business SIC classification: BITUMINOUS COAL UNDERGROUND MINING
ALBERS STP (310 E. RAILROAD STREET in ALBERS, IL)
STATE MASTER (Illinois EPA Project) - National Pollutant Discharge Elimination System Permit National Pollutant Discharge Elimination System NON-MAJOR (Tracking pollutant discharge elimination systems) - permit Business SIC classification: SEWERAGE SYSTEMS Alternative names: ALBERS STP, VILLAGE OF
ALBERS ELEM SCHOOL (PO BOX 104 in ALBERS, IL)
(National Center for Education Statistics) - STATE ID-1301406302001 Organizations: ALBERS SCHOOL DISTRICT 63 (SCHOOL DISTRICT)
DAMIANSVILLE ELEM SCHOOL (101 E MAIN in DAMIANSVILLE, IL)
(National Center for Education Statistics) - STATE ID-1301406202001 Organizations: DAMIANSVILLE SCHOOL DISTRICT 62 (SCHOOL DISTRICT)
CLINTON COUNTY SERVICE CO (RAILROAD ST in ALBERS, IL)
(Resource Conservation and Recovery Act (tracking hazardous waste))
KALMER LUMBER & PALLET MFG. (RR1 BOX 186A in DAMIANSVILLE, IL)
National Pollutant Discharge Elimination System NON-MAJOR (Tracking pollutant discharge elimination systems) - permit
IDOT (FAI RTE 64 FROM in ALBERS, IL)
Small Quantity Generators, between 100 kg and 1000 kg of hazardous waste/month (Resource Conservation and Recovery Act (tracking hazardous waste)) - notification
Housing units lacking complete plumbing facilities: 1.4% Housing units lacking complete kitchen facilities: 1.0%
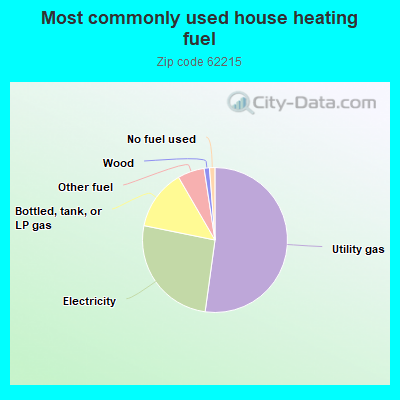
52.4%Utility gas
26.1%Electricity
13.5%Bottled, tank, or LP gas
6.0%Other fuel
1.2%Wood
1.2%No fuel used
Population in 1990: 1,641.
Place of birth for U.S.-born residents:
This state: 1,476
Northeast: 11
Midwest: 323
South: 87
West: 30
67% of the 62215 zip code residents lived in the same house 5 years ago. Out of people who lived in different houses, 41% lived in this county. Out of people who lived in different counties, 50% lived in Illinois.
94% of the 62215 zip code residents lived in the same house 1 year ago. Out of people who lived in different houses, 70% moved from this county. Out of people who lived in different houses, 14% moved from different county within same state. Out of people who lived in different houses, 14% moved from different state.
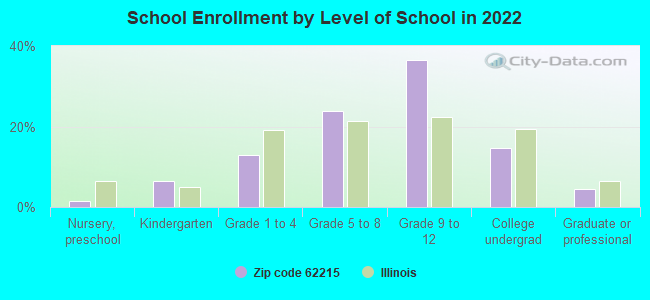
Private vs. public school enrollment:
Students in private schools in grades 1 to 8 (elementary and middle school):
Here:
0.0%
Illinois:
13.3%
Students in private schools in grades 9 to 12 (high school): 40
Here:
21.8%
Illinois:
9.9%
Students in private undergraduate colleges: 1
Here:
2.4%
Illinois:
27.4%
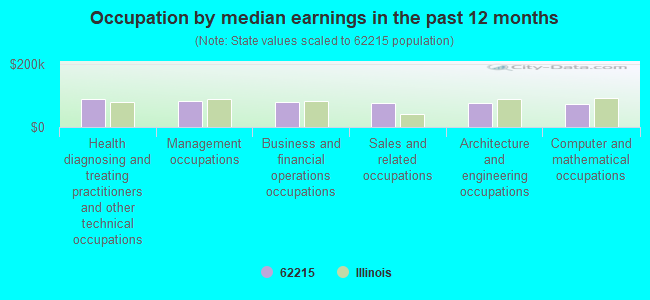
Occupation by median earnings in the past 12 months ($)
89,959Health diagnosing and treating practitioners and other technical occupations
82,747Management occupations
79,576Business and financial operations occupations
75,101Sales and related occupations
74,919Architecture and engineering occupations
73,296Computer and mathematical occupations
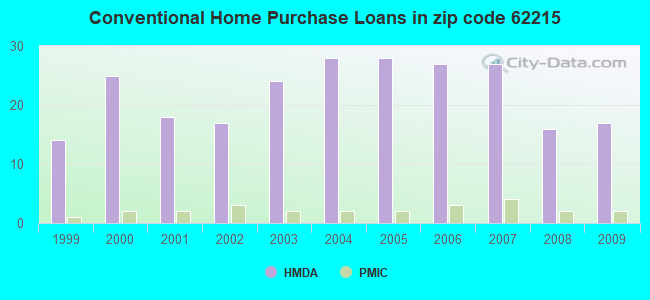
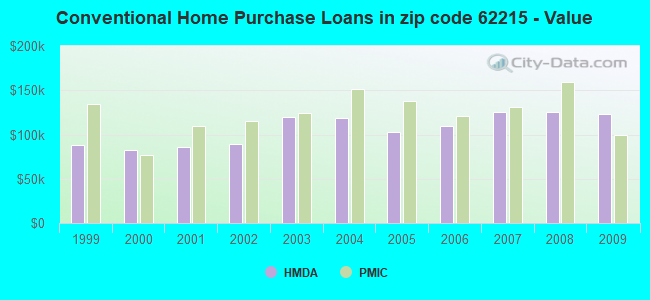
Top industries in this zip code by the number of employees in 2005:
Detailed PMIC statistics for the following Tracts:9006.00
2002 - 2018 National Fire Incident Reporting System (NFIRS) incidents
According to the data from the years 2002 - 2018 the average number of fire incidents per year is 10. The highest number of fire incidents - 21 took place in 2006, and the least - 2 in 2009. The data has a growing trend.
When looking into fire subcategories, the most reports belonged to: Structure Fires (35.8%), and Outside Fires (35.8%).
Fire incident types reported to NFIRS in Zip Code 62215
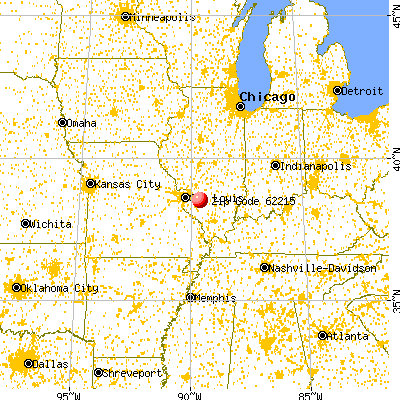


 Nearest zip codes: 62245, 62265, 62266, 62271, 62216, 62214.
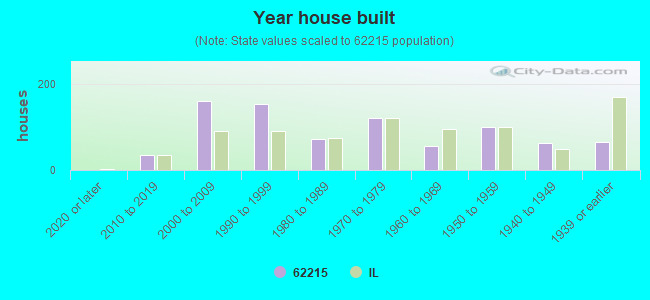


 According to the data from the years 2002 - 2018 the average number of fire incidents per year is 10. The highest number of fire incidents - 21 took place in 2006, and the least - 2 in 2009. The data has a growing trend.
 When looking into fire subcategories, the most reports belonged to: Structure Fires (35.8%), and Outside Fires (35.8%).