Estimated zip code population in 2022: 1,871 Zip code population in 2010: 1,656 Zip code population in 2000: 1,753
Houses and condos: 792 Renter-occupied apartments: 81
% of renters here:
12%
State:
33%
March 2022 cost of living index in zip code 62360: 84.4 (less than average, U.S. average is 100)
Land area: 35.8 sq. mi. Water area: 0.0 sq. mi.
Population density: 52 people per square mile
(very low).
OSM Map
General Map
Google Map
MSN Map
OSM Map
General Map
Google Map
MSN Map
OSM Map
General Map
Google Map
MSN Map
OSM Map
General Map
Google Map
MSN Map
Please wait while loading the map...
Real estate property taxes paid for housing units in 2022:
This zip code:
1.6% ($1,940)
Illinois:
2.0% ($4,912)
Median real estate property taxes paid for housing units with mortgages in 2022: $2,175 (1.5%) Median real estate property taxes paid for housing units with no mortgage in 2022: $1,733 (1.9%)
Business Search- 14 Million verified businesses
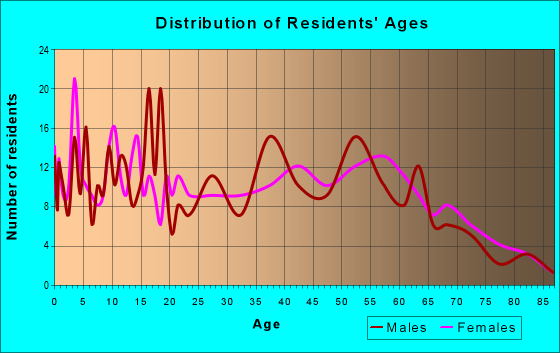
Males: 889
(47.5%)
Females: 982
(52.5%)
For population 25 years and over in 62360:
High school or higher: 95.0%
Bachelor's degree or higher: 31.8%
Graduate or professional degree: 9.4%
Unemployed: 0.4%
Mean travel time to work (commute): 21.7 minutes
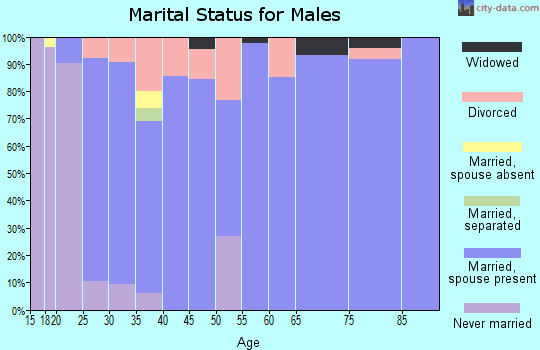
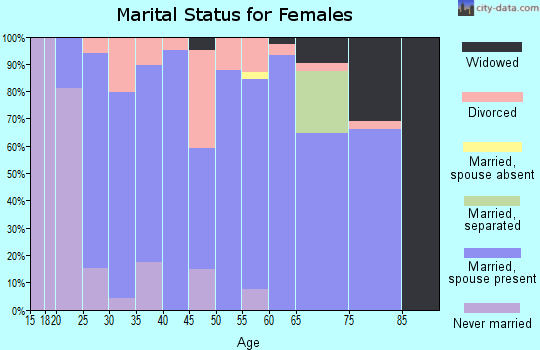
For population 15 years and over in 62360:
Never married: 24.2%
Now married: 56.8%
Separated: 0.5%
Widowed: 12.0%
Divorced: 6.6%
Zip code 62360 compared to state average:
Median house value below state average.
Unemployed percentage significantly below state average.
Black race population percentage significantly below state average.
Hispanic race population percentage significantly below state average.
Median age below state average.
Foreign-born population percentage significantly below state average.
Renting percentage significantly below state average.
Length of stay since moving in significantly above state average.
Estimated median house/condo value in 2022: $122,906
62360:
$122,906
Illinois:
$251,600
According to our research of Illinois and other state lists, there was 1 registered sex offender living in 62360 zip code as of May 08, 2024. The ratio of all residents to sex offenders in zip code 62360 is 1,959 to 1. The ratio of registered sex offenders to all residents in this zip code is much lower than the state average.
Median resident age:
This zip code:
34.6 years
Illinois median age:
39.1 years
Average household size:
This zip code:
2.7 people
Illinois:
2.4 people
Averages for the 2020 tax year for zip code 62360, filed in 2021:
Average Adjusted Gross Income (AGI) in 2020: $60,380 (Individual Income Tax Returns)
Here:
$60,380
State:
$82,626
Salary/wage: $47,947 (reported on 86.1% of returns)
Here:
$47,947
State:
$66,640
(% of AGI for various income ranges: 1227.8% for AGIs below $25k, 3684.4% for AGIs $25k-50k, 6704.4% for AGIs $50k-75k, 9105.7% for AGIs $75k-100k, 15113.7% for AGIs $100k-200k)
Taxable interest for individuals: $693 (reported on 38.0% of returns)
This zip code:
$693
Illinois:
$2,376
(% of AGI for various income ranges: 17.2% for AGIs below $25k, 13.8% for AGIs $25k-50k, 57.8% for AGIs $50k-75k, 80.0% for AGIs $75k-100k, 58.8% for AGIs $100k-200k)
Ordinary dividends: $1,706 (reported on 20.3% of returns)
Here:
$1,706
State:
$9,061
(% of AGI for various income ranges: 25.6% for AGIs below $25k, 9.4% for AGIs $25k-50k, 63.3% for AGIs $50k-75k, 21.4% for AGIs $75k-100k, 175.0% for AGIs $100k-200k)
Net capital gain/loss in AGI: +$4,636 (reported on 17.7% of returns)
Here:
+$4,636
State:
+$31,684
(% of AGI for various income ranges: 21.1% for AGIs below $25k, 16.2% for AGIs $25k-50k, 227.8% for AGIs $50k-75k, 475.0% for AGIs $100k-200k)
Profit/loss from business: +$18,073 (reported on 13.9% of returns)
Here:
+$18,073
State:
+$12,175
(% of AGI for various income ranges: 85.0% for AGIs below $25k, 174.4% for AGIs $25k-50k, 201.4% for AGIs $75k-100k, 1768.8% for AGIs $100k-200k)
Taxable individual retirement arrangement distribution: $11,971 (reported on 8.9% of returns)
62360:
$11,971
Illinois:
$21,613
(% of AGI for various income ranges: 98.9% for AGIs below $25k, 212.5% for AGIs $25k-50k, 457.1% for AGIs $75k-100k)
Earned income credit: $2,308 (reported on 15.2% of returns)
Here:
$2,308
State:
$2,311
(% of AGI for various income ranges: 71.7% for AGIs below $25k, 92.5% for AGIs $25k-50k)
Percentage of individuals using paid preparers for their 2020 taxes: 94.9%
Here:
95%
State:
93%
(% for various income ranges: 96.0% for AGIs below $25k, 94.7% for AGIs $25k-50k, 92.3% for AGIs $50k-75k, 90.0% for AGIs $75k-100k, 120.0% for AGIs $100k-200k, 0.0% for AGIs over 200k)
Averages for the 2012 tax year for zip code 62360, filed in 2013:
Average Adjusted Gross Income (AGI) in 2012: $49,153 (Individual Income Tax Returns)
Here:
$49,153
State:
$68,058
Salary/wage: $36,859 (reported on 86.4% of returns)
Here:
$36,859
State:
$55,396
(% of AGI for various income ranges: 77.6% for AGIs below $25k, 75.9% for AGIs $25k-50k, 79.4% for AGIs $50k-75k, 80.5% for AGIs $75k-100k, 36.9% for AGIs $100k-200k)
Taxable interest for individuals: $738 (reported on 35.8% of returns)
This zip code:
$738
Illinois:
$1,969
(% of AGI for various income ranges: 1.0% for AGIs below $25k, 1.1% for AGIs $25k-50k, 0.2% for AGIs $50k-75k, 0.3% for AGIs $75k-100k, 0.4% for AGIs $100k-200k)
Ordinary dividends: $1,329 (reported on 17.3% of returns)
Here:
$1,329
State:
$7,786
(% of AGI for various income ranges: 0.4% for AGIs below $25k, 0.9% for AGIs $25k-50k, 0.2% for AGIs $50k-75k, 0.5% for AGIs $75k-100k, 0.4% for AGIs $100k-200k)
Net capital gain/loss in AGI: +$2,250 (reported on 12.3% of returns)
Here:
+$2,250
State:
+$22,183
(% of AGI for various income ranges: 0.2% for AGIs $25k-50k, 1.8% for AGIs $50k-75k, 0.5% for AGIs $100k-200k)
Profit/loss from business: +$9,133 (reported on 14.8% of returns)
Here:
+$9,133
State:
+$12,903
(% of AGI for various income ranges: 5.3% for AGIs below $25k, 2.7% for AGIs $25k-50k, 2.2% for AGIs $50k-75k, 6.8% for AGIs $75k-100k)
Taxable individual retirement arrangement distribution: $9,862 (reported on 9.9% of returns)
62360:
$9,862
Illinois:
$17,929
(% of AGI for various income ranges: 2.0% for AGIs below $25k, 4.5% for AGIs $25k-50k, 4.9% for AGIs $75k-100k)
Total itemized deductions: $21,991 (18% of AGI, reported on 13.6% of returns)
Here:
$21,991
State:
$26,433
Here:
18.2% of AGI
State:
19.2% of AGI
(% of AGI for various income ranges: 10.6% for AGIs $25k-50k, 4.9% for AGIs $75k-100k, 9.4% for AGIs $100k-200k)
Charity contributions: $3,300 (reported on 9.9% of returns)
Here:
$3,300
State:
$4,525
(% of AGI for various income ranges: 1.7% for AGIs below $25k, 0.7% for AGIs $50k-75k, 1.1% for AGIs $100k-200k)
Taxes paid: $7,300 (reported on 13.6% of returns)
62360:
$7,300
State:
$11,968
(% of AGI for various income ranges: 2.4% for AGIs $25k-50k, 1.9% for AGIs $75k-100k, 3.6% for AGIs $100k-200k)
Earned income credit: $2,200 (reported on 17.3% of returns)
Here:
$2,200
State:
$2,349
(% of AGI for various income ranges: 5.0% for AGIs below $25k, 1.5% for AGIs $25k-50k)
Percentage of individuals using paid preparers for their 2012 taxes: 67.9%
Here:
68%
State:
57%
(% for various income ranges: 58.1% for AGIs below $25k, 68.2% for AGIs $25k-50k, 76.9% for AGIs $50k-75k, 77.8% for AGIs $75k-100k, 83.3% for AGIs $100k-200k)
Averages for the 2004 tax year for zip code 62360, filed in 2005:
Average Adjusted Gross Income (AGI) in 2004: $36,327 (Individual Income Tax Returns)
Here:
$36,327
State:
$54,625
Salary/wage: $32,841 (reported on 86.8% of returns)
Here:
$32,841
State:
$46,811
(% of AGI for various income ranges: 99.8% for AGIs below $10k, 71.4% for AGIs $10k-25k, 81.6% for AGIs $25k-50k, 84.4% for AGIs $50k-75k, 85.5% for AGIs $75k-100k, 48.0% for AGIs over 100k)
Taxable interest for individuals: $1,258 (reported on 47.2% of returns)
This zip code:
$1,258
Illinois:
$2,101
(% of AGI for various income ranges: 8.3% for AGIs below $10k, 4.2% for AGIs $10k-25k, 1.5% for AGIs $25k-50k, 0.9% for AGIs $50k-75k, 0.6% for AGIs $75k-100k, 1.7% for AGIs over 100k)
Taxable dividends: $1,138 (reported on 22.1% of returns)
Here:
$1,138
State:
$4,306
(% of AGI for various income ranges: 6.8% for AGIs below $10k, 1.4% for AGIs $10k-25k, 0.9% for AGIs $25k-50k, 0.1% for AGIs $50k-75k, 0.2% for AGIs $75k-100k, 0.6% for AGIs over 100k)
Net capital gain/loss: +$1,631 (reported on 15.5% of returns)
Here:
+$1,631
State:
+$17,321
(% of AGI for various income ranges: 1.4% for AGIs below $10k, 0.9% for AGIs $10k-25k, 0.2% for AGIs $25k-50k, 0.8% for AGIs $50k-75k, 1.3% for AGIs $75k-100k, 0.6% for AGIs over 100k)
Profit/loss from business: +$10,113 (reported on 15.7% of returns)
Here:
+$10,113
State:
+$11,771
(% of AGI for various income ranges: 4.5% for AGIs below $10k, 4.5% for AGIs $10k-25k, 4.6% for AGIs $25k-50k, 3.3% for AGIs $50k-75k, 8.9% for AGIs $75k-100k)
Profit/loss from farming: +$1,542 (reported on 6.1% of returns)
Here:
+$1,542
State:
+$2,327
(% of AGI for various income ranges: 1.6% for AGIs below $10k, 0.7% for AGIs $25k-50k, -0.5% for AGIs $50k-75k, 1.2% for AGIs $75k-100k)
IRA payment deduction: $2,846 (reported on 3.3% of returns)
62360:
$2,846
Illinois:
$3,087
Total itemized deductions: $16,000 (26% of AGI, reported on 14.2% of returns)
Here:
$16,000
State:
$20,239
Here:
25.6% of AGI
State:
19.5% of AGI
(% of AGI for various income ranges: 7.5% for AGIs $10k-25k, 5.5% for AGIs $25k-50k, 6.6% for AGIs $50k-75k, 5.0% for AGIs $75k-100k, 8.9% for AGIs over 100k)
Charity contributions deductions: $3,338 (5% of AGI, reported on 10.2% of returns)
Here:
$3,338
State:
$3,719
Here:
5.0% of AGI
State:
3.4% of AGI
(% of AGI for various income ranges: 0.7% for AGIs $25k-50k, 1.0% for AGIs $50k-75k, 0.4% for AGIs $75k-100k, 3.3% for AGIs over 100k)
Total tax: $4,026 (reported on 78.2% of returns)
62360:
$4,026
State:
$9,882
(% of AGI for various income ranges: 3.2% for AGIs below $10k, 4.3% for AGIs $10k-25k, 6.4% for AGIs $25k-50k, 8.2% for AGIs $50k-75k, 10.7% for AGIs $75k-100k, 18.4% for AGIs over 100k)
Earned income credit: $1,645 (reported on 14.0% of returns)
Here:
$1,645
State:
$1,788
Percentage of individuals using paid preparers for their 2004 taxes: 72.2%
Here:
72%
State:
61%
(% for various income ranges: 60.4% for AGIs below $10k, 71.6% for AGIs $10k-25k, 74.2% for AGIs $25k-50k, 81.4% for AGIs $50k-75k, 69.8% for AGIs $75k-100k, 81.8% for AGIs over 100k)
Household received Food Stamps/SNAP in the past 12 months: 77 Household did not receive Food Stamps/SNAP in the past 12 months: 600
Women who had a birth in the past 12 months: 2 (0 now married, 2 unmarried) Women who did not have a birth in the past 12 months: 364 (200 now married, 162 unmarried)
Housing units in zip code 62360 with a mortgage: 301 (3 second mortgage, 3 both second mortgage and home equity loan) Median monthly owner costs for units with a mortgage: $1,064 Median monthly owner costs for units without a mortgage: $512
Residents with income below the poverty level in 2022:
This zip code:
8.0%
Whole state:
11.9%
Residents with income below 50% of the poverty level in 2022:
This zip code:
5.1%
Whole state:
5.7%
Median number of rooms in houses and condos:
Here:
6.8
State:
6.4
Median number of rooms in apartments:
Here:
5.9
State:
4.1
Notable locations in this zip code not listed on our city pages
Cemeteries: Payson Old Cemetery (1), Payson New Cemetery (2), Bluff Hall Cemetery (3), Fall Creek Chapel Cemetery (4), Dunn Cemetery (5), Craigtown Cemetery (6), Thompson Cemetery (7). Display/hide their locations on the map
Size of family households: 206 2-persons, 99 3-persons, 62 4-persons, 37 5-persons, 30 6-persons, 13 7-or-more-persons
Size of nonfamily households: 211 1-person, 18 2-persons
475 married couples with children.
96 single-parent households (41 men, 55 women).
99.2% of residents of 62360 zip code speak English at home.
0.2% of residents speak Spanish at home (100% very well).
Foreign born population: 3 (0.2%) (66.9% of them are naturalized citizens)
This zip code:
0.2%
Whole state:
14.4%
67%Azores Islands
43%German
35%English
8%Italian
7%American
4%European
2%Irish
2%Polish
Year of entry for the foreign-born population
02010 or later
12000 to 2009
01990 to 1999
1Before 1990
Facilities with environmental interests located in this zip code:
ADAMS FS INC (R.R. #1, BOX 333A in PAYSON, IL)
STATE MASTER (Illinois EPA Project) - AIR PROGRAM AIR MINOR (AIRS/AFS) Business SIC classification: FARM SUPPLIES
ADAMS FS INC (ILLINOIS ROUTE 79 in PAYSON, IL)
STATE MASTER (Illinois EPA Project) - AIR PROGRAM AIR MINOR (AIRS/AFS) Business SIC classification: PETROLEUM BULK STATIONS AND TERMINALS Alternative names: ADAMS FS INC - FALL CREEK PLT
P & S AUTO & TRUCK REPAIR (110 S FRANKLIN ST in PAYSON, IL)
STATE MASTER (Illinois EPA Project) - SOLID WASTE PROGRAM, HAZARDOUS WASTE PROGRAM Conditionally Exempt Small Quantity Generators, less than 100 kg/month of hazardous waste (Resource Conservation and Recovery Act (tracking hazardous waste)) Organizations: STEFFEN KEN (CONTACT/OWNER)
PAYSON STP (NORTH 350TH AVE & E 130TH ST in PAYSON, IL)
STATE MASTER (Illinois EPA Project) - National Pollutant Discharge Elimination System Permit National Pollutant Discharge Elimination System NON-MAJOR (Tracking pollutant discharge elimination systems) - permit Business SIC classification: SEWERAGE SYSTEMS Alternative names: PAYSON STP, VILLAGE OF
PAYSON COMMUNITY UNIT SD #1 (420 BRAINARD in PAYSON, IL)
COMPLIANCE ACTIVITY (Tracking inspections of insecticide, fungicide, and rodenticide, and toxic substances)
ADAMS FS, INC. (P.O. BOX 33A in PAYSON, IL)
COMPLIANCE ACTIVITY (Tracking inspections of insecticide, fungicide, and rodenticide, and toxic substances)
Housing units lacking complete plumbing facilities: 1.5% Housing units lacking complete kitchen facilities: 1.7%
53.6%Utility gas
25.7%Electricity
20.8%Bottled, tank, or LP gas
Population in 1990: 1,939.
Place of birth for U.S.-born residents:
This state: 1,629
Northeast: 1
Midwest: 204
South: 19
West: 6
70% of the 62360 zip code residents lived in the same house 5 years ago. Out of people who lived in different houses, 80% lived in this county. Out of people who lived in different counties, 50% lived in Illinois.
95% of the 62360 zip code residents lived in the same house 1 year ago. Out of people who lived in different houses, 78% moved from this county. Out of people who lived in different houses, 8% moved from different county within same state. Out of people who lived in different houses, 10% moved from different state.
Private vs. public school enrollment:
Students in private schools in grades 1 to 8 (elementary and middle school): 23
Here:
9.4%
Illinois:
13.3%
Students in private schools in grades 9 to 12 (high school):
Here:
0.0%
Illinois:
9.9%
Students in private undergraduate colleges: 1
Here:
3.8%
Illinois:
27.4%
Occupation by median earnings in the past 12 months ($)
66,444Construction and extraction occupations
58,475Office and administrative support occupations
51,536Installation, maintenance, and repair occupations
48,569Education, training, and library occupations
41,465Production occupations
40,016Arts, design, entertainment, sports, and media occupations
Top industries in this zip code by the number of employees in 2005:
Administrative and Support and Waste Management and Remediation Services: Janitorial Services (20-49 employees: 1 establishment)
Construction: Other Building Equipment Contractors (10-19: 1)
Other Services (except Public Administration): Funeral Homes and Funeral Services (5-9: 1)
Finance and Insurance: Portfolio Management (5-9: 1)
Construction: Masonry Contractors (5-9: 1)
Finance and Insurance: Commercial Banking (1-4: 2)
Finance and Insurance: Insurance Agencies and Brokerages (1-4: 2)
Wholesale Trade: Other Farm Product Raw Material Merchant Wholesalers (1-4: 1)
Other Services (except Public Administration): Religious Organizations (1-4: 1)
Fatal accident statistics in 2010:
Fatal accident count: 1
Vehicles involved in fatal accidents: 1
Fatal accidents caused by drunken drivers: 0
Fatalities: 1
Persons involved in fatal accidents: 1
Pedestrians involved in fatal accidents: 0
2002 - 2018 National Fire Incident Reporting System (NFIRS) incidents
According to the data from the years 2002 - 2018 the average number of fires per year is 10. The highest number of reported fire incidents - 22 took place in 2018, and the least - 0 in 2007. The data has a growing trend.
When looking into fire subcategories, the most incidents belonged to: Outside Fires (52.4%), and Mobile Property/Vehicle Fires (20.7%).
Fire incident types reported to NFIRS in Zip Code 62360


 Nearest zip codes: 62365, 62343, 62305, 62301, 63467, 62338.


 According to the data from the years 2002 - 2018 the average number of fires per year is 10. The highest number of reported fire incidents - 22 took place in 2018, and the least - 0 in 2007. The data has a growing trend.
 When looking into fire subcategories, the most incidents belonged to: Outside Fires (52.4%), and Mobile Property/Vehicle Fires (20.7%).