Estimated zip code population in 2022: 1,098 Zip code population in 2010: 1,067 Zip code population in 2000: 1,175
Houses and condos: 492 Renter-occupied apartments: 25
% of renters here:
5%
State:
33%
March 2022 cost of living index in zip code 62611: 85.6 (less than average, U.S. average is 100)
Land area: 73.8 sq. mi. Water area: 1.5 sq. mi.
Population density: 15 people per square mile
(very low).
OSM Map
General Map
Google Map
MSN Map
OSM Map
General Map
Google Map
MSN Map
OSM Map
General Map
Google Map
MSN Map
OSM Map
General Map
Google Map
MSN Map
Please wait while loading the map...
Real estate property taxes paid for housing units in 2022:
This zip code:
1.6% ($2,230)
Illinois:
2.0% ($4,912)
Median real estate property taxes paid for housing units with mortgages in 2022: $2,667 (1.6%) Median real estate property taxes paid for housing units with no mortgage in 2022: $2,162 (1.7%)
Business Search- 14 Million verified businesses
Males: 550
(50.1%)
Females: 548
(49.9%)
For population 25 years and over in 62611:
High school or higher: 95.2%
Bachelor's degree or higher: 37.8%
Graduate or professional degree: 2.5%
Unemployed: 0.7%
Mean travel time to work (commute): 23.0 minutes
For population 15 years and over in 62611:
Never married: 13.3%
Now married: 71.7%
Separated: 1.2%
Widowed: 5.7%
Divorced: 8.1%
Zip code 62611 compared to state average:
Median house value below state average.
Unemployed percentage significantly below state average.
Black race population percentage significantly below state average.
Hispanic race population percentage significantly below state average.
Foreign-born population percentage significantly below state average.
Renting percentage significantly below state average.
Number of college students significantly below state average.
Averages for the 2020 tax year for zip code 62611, filed in 2021:
Average Adjusted Gross Income (AGI) in 2020: $68,645 (Individual Income Tax Returns)
Here:
$68,645
State:
$82,626
Salary/wage: $50,300 (reported on 81.8% of returns)
Here:
$50,300
State:
$66,640
(% of AGI for various income ranges: 1138.6% for AGIs below $25k, 3835.7% for AGIs $25k-50k, 5928.3% for AGIs $50k-75k, 8800.0% for AGIs $75k-100k, 21072.5% for AGIs $100k-200k)
Taxable interest for individuals: $1,010 (reported on 45.5% of returns)
This zip code:
$1,010
Illinois:
$2,376
(% of AGI for various income ranges: 30.0% for AGIs below $25k, 8.6% for AGIs $25k-50k, 28.3% for AGIs $50k-75k, 73.3% for AGIs $75k-100k, 340.0% for AGIs $100k-200k)
Ordinary dividends: $3,989 (reported on 20.5% of returns)
Here:
$3,989
State:
$9,061
(% of AGI for various income ranges: 64.3% for AGIs below $25k, 81.7% for AGIs $50k-75k, 662.5% for AGIs $100k-200k)
Net capital gain/loss in AGI: +$4,944 (reported on 20.5% of returns)
Here:
+$4,944
State:
+$31,684
(% of AGI for various income ranges: 55.7% for AGIs below $25k, 50.0% for AGIs $50k-75k, 940.0% for AGIs $100k-200k)
Profit/loss from business: +$5,080 (reported on 11.4% of returns)
Here:
+$5,080
State:
+$12,175
(% of AGI for various income ranges: 47.1% for AGIs below $25k, 736.7% for AGIs $75k-100k)
Taxable individual retirement arrangement distribution: $13,920 (reported on 11.4% of returns)
62611:
$13,920
Illinois:
$21,613
(% of AGI for various income ranges: 452.9% for AGIs $25k-50k, 1263.3% for AGIs $75k-100k)
Earned income credit: $2,000 (reported on 11.4% of returns)
Here:
$2,000
State:
$2,311
(% of AGI for various income ranges: 142.9% for AGIs below $25k)
Percentage of individuals using paid preparers for their 2020 taxes: 100.0%
Here:
100%
State:
93%
(% for various income ranges: 100.0% for AGIs below $25k, 100.0% for AGIs $25k-50k, 100.0% for AGIs $50k-75k, 100.0% for AGIs $75k-100k, 100.0% for AGIs $100k-200k)
Averages for the 2012 tax year for zip code 62611, filed in 2013:
Average Adjusted Gross Income (AGI) in 2012: $66,214 (Individual Income Tax Returns)
Here:
$66,214
State:
$68,058
Salary/wage: $44,602 (reported on 84.0% of returns)
Here:
$44,602
State:
$55,396
(% of AGI for various income ranges: 66.4% for AGIs below $25k, 76.4% for AGIs $25k-50k, 71.2% for AGIs $50k-75k, 69.9% for AGIs $75k-100k, 40.9% for AGIs $100k-200k)
Taxable interest for individuals: $937 (reported on 54.0% of returns)
This zip code:
$937
Illinois:
$1,969
(% of AGI for various income ranges: 1.5% for AGIs below $25k, 0.4% for AGIs $25k-50k, 0.4% for AGIs $50k-75k, 0.7% for AGIs $75k-100k, 0.9% for AGIs $100k-200k)
Ordinary dividends: $3,518 (reported on 22.0% of returns)
Here:
$3,518
State:
$7,786
(% of AGI for various income ranges: 2.2% for AGIs below $25k, 0.9% for AGIs $25k-50k, 0.6% for AGIs $75k-100k, 1.7% for AGIs $100k-200k)
Net capital gain/loss in AGI: +$10,171 (reported on 14.0% of returns)
Here:
+$10,171
State:
+$22,183
Profit/loss from business: +$6,344 (reported on 18.0% of returns)
Here:
+$6,344
State:
+$12,903
Taxable individual retirement arrangement distribution: $5,233 (reported on 12.0% of returns)
62611:
$5,233
Illinois:
$17,929
Total itemized deductions: $19,900 (14% of AGI, reported on 22.0% of returns)
Here:
$19,900
State:
$26,433
Here:
13.7% of AGI
State:
19.2% of AGI
(% of AGI for various income ranges: 7.9% for AGIs $25k-50k, 8.0% for AGIs $50k-75k, 8.6% for AGIs $100k-200k)
Charity contributions: $7,362 (reported on 16.0% of returns)
Here:
$7,362
State:
$4,525
Taxes paid: $9,490 (reported on 20.0% of returns)
62611:
$9,490
State:
$11,968
(% of AGI for various income ranges: 2.0% for AGIs $25k-50k, 2.6% for AGIs $50k-75k, 4.4% for AGIs $100k-200k)
Earned income credit: $1,957 (reported on 14.0% of returns)
Here:
$1,957
State:
$2,349
(% of AGI for various income ranges: 4.6% for AGIs below $25k, 1.2% for AGIs $25k-50k)
Percentage of individuals using paid preparers for their 2012 taxes: 72.0%
Here:
72%
State:
57%
(% for various income ranges: 62.5% for AGIs below $25k, 66.7% for AGIs $25k-50k, 77.8% for AGIs $50k-75k, 83.3% for AGIs $75k-100k, 85.7% for AGIs $100k-200k)
Averages for the 2004 tax year for zip code 62611, filed in 2005:
Average Adjusted Gross Income (AGI) in 2004: $45,553 (Individual Income Tax Returns)
Here:
$45,553
State:
$54,625
Salary/wage: $36,000 (reported on 81.4% of returns)
Here:
$36,000
State:
$46,811
(% of AGI for various income ranges: 85.5% for AGIs below $10k, 65.3% for AGIs $10k-25k, 75.4% for AGIs $25k-50k, 76.3% for AGIs $50k-75k, 72.8% for AGIs $75k-100k, 41.4% for AGIs over 100k)
Taxable interest for individuals: $1,542 (reported on 61.2% of returns)
This zip code:
$1,542
Illinois:
$2,101
(% of AGI for various income ranges: 14.8% for AGIs below $10k, 2.7% for AGIs $10k-25k, 1.0% for AGIs $25k-50k, 1.4% for AGIs $50k-75k, 1.2% for AGIs $75k-100k, 3.0% for AGIs over 100k)
Taxable dividends: $2,514 (reported on 26.9% of returns)
Here:
$2,514
State:
$4,306
(% of AGI for various income ranges: 2.2% for AGIs below $10k, 1.2% for AGIs $10k-25k, 0.8% for AGIs $25k-50k, 0.2% for AGIs $50k-75k, 0.4% for AGIs $75k-100k, 3.7% for AGIs over 100k)
Net capital gain/loss: +$3,096 (reported on 15.7% of returns)
Here:
+$3,096
State:
+$17,321
(% of AGI for various income ranges: 0.0% for AGIs below $10k, 0.2% for AGIs $10k-25k, 0.4% for AGIs $25k-50k, 0.2% for AGIs $50k-75k, 2.7% for AGIs $75k-100k, 1.7% for AGIs over 100k)
Profit/loss from business: +$5,768 (reported on 18.8% of returns)
Here:
+$5,768
State:
+$11,771
(% of AGI for various income ranges: 7.7% for AGIs $10k-25k, 3.7% for AGIs $25k-50k, 3.1% for AGIs $50k-75k, 0.7% for AGIs over 100k)
Profit/loss from farming: +$15,412 (reported on 16.1% of returns)
Here:
+$15,412
State:
+$2,327
(% of AGI for various income ranges: 1.0% for AGIs $10k-25k, 5.8% for AGIs $25k-50k, 6.9% for AGIs $50k-75k, 16.7% for AGIs $75k-100k)
IRA payment deduction: $3,438 (reported on 3.0% of returns)
62611:
$3,438
Illinois:
$3,087
Total itemized deductions: $17,811 (18% of AGI, reported on 20.1% of returns)
Here:
$17,811
State:
$20,239
Here:
17.9% of AGI
State:
19.5% of AGI
(% of AGI for various income ranges: 10.9% for AGIs $10k-25k, 4.4% for AGIs $25k-50k, 6.7% for AGIs $50k-75k, 8.6% for AGIs $75k-100k, 10.4% for AGIs over 100k)
Charity contributions deductions: $4,885 (5% of AGI, reported on 14.8% of returns)
Here:
$4,885
State:
$3,719
Here:
4.8% of AGI
State:
3.4% of AGI
(% of AGI for various income ranges: 1.9% for AGIs $10k-25k, 0.4% for AGIs $25k-50k, 0.5% for AGIs $50k-75k, 0.8% for AGIs $75k-100k, 3.7% for AGIs over 100k)
Total tax: $7,774 (reported on 76.1% of returns)
62611:
$7,774
State:
$9,882
(% of AGI for various income ranges: 3.1% for AGIs below $10k, 4.8% for AGIs $10k-25k, 7.5% for AGIs $25k-50k, 9.9% for AGIs $50k-75k, 9.7% for AGIs $75k-100k, 23.7% for AGIs over 100k)
Earned income credit: $1,696 (reported on 10.6% of returns)
Here:
$1,696
State:
$1,788
Percentage of individuals using paid preparers for their 2004 taxes: 72.9%
Here:
73%
State:
61%
(% for various income ranges: 61.1% for AGIs below $10k, 72.3% for AGIs $10k-25k, 76.9% for AGIs $25k-50k, 79.8% for AGIs $50k-75k, 69.0% for AGIs $75k-100k, 85.7% for AGIs over 100k)
Household received Food Stamps/SNAP in the past 12 months: 3 Household did not receive Food Stamps/SNAP in the past 12 months: 468
Women who had a birth in the past 12 months: 2 (1 now married, 0 unmarried) Women who did not have a birth in the past 12 months: 221 (150 now married, 68 unmarried)
Housing units in zip code 62611 with a mortgage: 233 (11 second mortgage, 5 both second mortgage and home equity loan) Median monthly owner costs for units with a mortgage: $1,390 Median monthly owner costs for units without a mortgage: $486
Residents with income below the poverty level in 2022:
This zip code:
3.8%
Whole state:
11.9%
Residents with income below 50% of the poverty level in 2022:
This zip code:
3.5%
Whole state:
5.7%
Median number of rooms in houses and condos:
Here:
6.5
State:
6.4
Median number of rooms in apartments:
Here:
6.7
State:
4.1
Notable locations in this zip code not listed on our city pages
Churches in zip code 62611 include: Bethel Church (A), Saint Peters Church (B), Trinity Lutheran Church (C), Immanuel Church (D). Display/hide their locations on the map
Cemeteries: Arenzville City East Cemetery (1), Green-Krohe Cemetery (2), Hackman Cemetery (3), Jockisch Methodist Cemetery (4), Krohe Cemetery (5), Arenzville City North Cemetery (6), Trinity Lutheran Cemetery (7). Display/hide their locations on the map
Streams, rivers, and creeks: Mud Creek (A), Mannel Branch (B), Little Indian Creek (C), Lick Branch (D), Prairie Creek (E). Display/hide their locations on the map
Size of family households: 209 2-persons, 33 3-persons, 59 4-persons, 1 5-persons, 42 6-persons
Size of nonfamily households: 115 1-person, 18 2-persons
208 married couples with children.
46 single-parent households (32 men, 14 women).
99.2% of residents of 62611 zip code speak English at home.
0.2% of residents speak Spanish at home (100% very well).
0.5% of residents speak other Indo-European language at home (100% very well).
Foreign born population: 0 (0.0%)
:
0.0%
Whole state:
14.4%
63%German
23%American
10%English
3%Irish
1%Scottish
0%French
0%Portuguese
Facilities with environmental interests located in this zip code:
ARENZVILLE STP (CONCORD-ARENZVILLE ROAD in ARENZVILLE, IL)
STATE MASTER (Illinois EPA Project) - National Pollutant Discharge Elimination System Permit National Pollutant Discharge Elimination System NON-MAJOR (Tracking pollutant discharge elimination systems) - permit Business SIC classification: SEWERAGE SYSTEMS Alternative names: ARENZVILLE STP, VILLAGE OF
HUEY FOREST PRODUCTS (308 S CHARLES ST in ARENZVILLE, IL)
STATE MASTER (Illinois EPA Project) - AIR PROGRAM AIR MINOR (AIRS/AFS) Business SIC classification: SAWMILLS AND PLANING MILLS, GENERAL
AMOCO FERTILIZER PLANT (1MI W ON MEREDOSIA BLACKTOP in ARENZVILLE, IL)
(Resource Conservation and Recovery Act (tracking hazardous waste))
CROPMATE (PO BOX 169 in ARENZVILLE, IL)
COMPLIANCE ACTIVITY (Tracking inspections of insecticide, fungicide, and rodenticide, and toxic substances)
Housing units lacking complete kitchen facilities: 0.7%
40.0%Bottled, tank, or LP gas
27.5%Utility gas
13.0%Wood
11.1%Electricity
7.5%Other fuel
1.5%No fuel used
Population in 1990: 1,008. Population change in the 1990s: +167 (+16.6%).
Place of birth for U.S.-born residents:
This state: 950
Northeast: 1
Midwest: 102
South: 25
West: 14
78% of the 62611 zip code residents lived in the same house 5 years ago. Out of people who lived in different houses, 50% lived in this county. Out of people who lived in different counties, 50% lived in Illinois.
91% of the 62611 zip code residents lived in the same house 1 year ago. Out of people who lived in different houses, 42% moved from this county. Out of people who lived in different houses, 58% moved from different county within same state. Out of people who lived in different houses, 1% moved from different state.
Private vs. public school enrollment:
Students in private schools in grades 1 to 8 (elementary and middle school): 17
Here:
14.2%
Illinois:
13.3%
Students in private schools in grades 9 to 12 (high school):
Here:
0.0%
Illinois:
9.9%
Students in private undergraduate colleges:
Here:
11.4%
Illinois:
27.4%
Occupation by median earnings in the past 12 months ($)
108,214Management occupations
102,322Sales and related occupations
68,377Health diagnosing and treating practitioners and other technical occupations
48,962Farming, fishing, and forestry occupations
45,366Production occupations
42,575Construction and extraction occupations
Top industries in this zip code by the number of employees in 2005:
Wholesale Trade: Farm and Garden Machinery and Equipment Merchant Wholesalers (50-99 employees: 1 establishment)
Finance and Insurance: Commercial Banking (10-19: 1, 5-9: 1)
Construction: Poured Concrete Foundation and Structure Contractors (10-19: 1)
Construction: Commercial and Institutional Building Construction (10-19: 1)
Accommodation and Food Services: Full-Service Restaurants (10-19: 1)
Other Services (except Public Administration): Religious Organizations (5-9: 1, 1-4: 2)
Finance and Insurance: Insurance Agencies and Brokerages (5-9: 1, 1-4: 1)
Construction: New Single-Family Housing Construction (except Operative Builders) (5-9: 1)
Other Services (except Public Administration): Commercial and Industrial Machinery and Equipment (except Automotive and Electronic) Repair and Maintenance (1-4: 1)
2002 - 2018 National Fire Incident Reporting System (NFIRS) incidents
Based on the data from the years 2002 - 2018 the average number of fires per year is 9. The highest number of fires - 15 took place in 2007, and the least - 4 in 2002. The data has a constant trend.
When looking into fire subcategories, the most reports belonged to: Outside Fires (46.0%), and Structure Fires (33.3%).
Fire incident types reported to NFIRS in Zip Code 62611

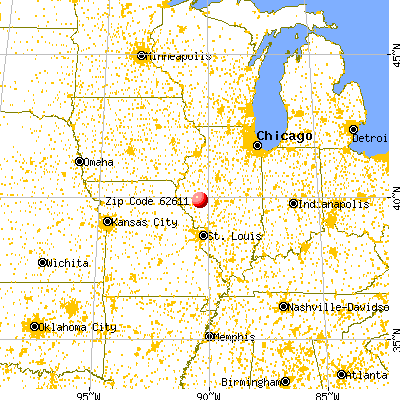


 Nearest zip codes: 62631, 62618, 62622, 62628, 62665, 62639.


 Based on the data from the years 2002 - 2018 the average number of fires per year is 9. The highest number of fires - 15 took place in 2007, and the least - 4 in 2002. The data has a constant trend.
 When looking into fire subcategories, the most reports belonged to: Outside Fires (46.0%), and Structure Fires (33.3%).