Estimated zip code population in 2022: 3,227 Zip code population in 2010: 3,756 Zip code population in 2000: 3,699
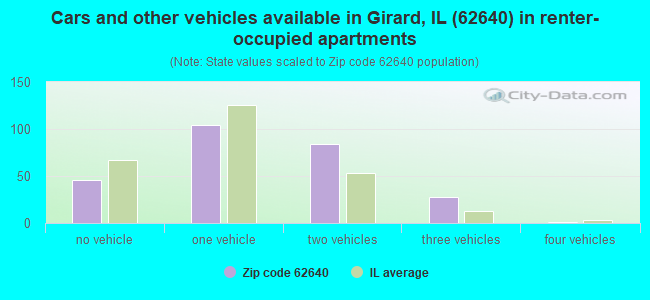
Houses and condos: 1,559 Renter-occupied apartments: 265
% of renters here:
22%
State:
33%
March 2022 cost of living index in zip code 62640: 85.2 (less than average, U.S. average is 100)
Land area: 76.3 sq. mi. Water area: 0.9 sq. mi.
Population density: 42 people per square mile
(very low).
OSM Map
General Map
Google Map
MSN Map
OSM Map
General Map
Google Map
MSN Map
OSM Map
General Map
Google Map
MSN Map
OSM Map
General Map
Google Map
MSN Map
Please wait while loading the map...
Real estate property taxes paid for housing units in 2022:
This zip code:
1.5% ($2,582)
Illinois:
2.0% ($4,912)
Median real estate property taxes paid for housing units with mortgages in 2022: $2,744 (1.6%) Median real estate property taxes paid for housing units with no mortgage in 2022: $2,347 (1.5%)
Business Search- 14 Million verified businesses
Males: 1,592
(49.3%)
Females: 1,635
(50.7%)
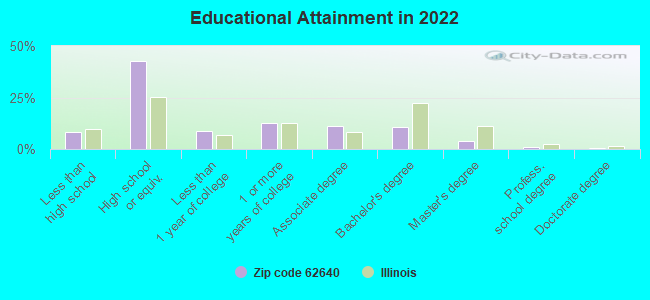
For population 25 years and over in 62640:
High school or higher: 91.0%
Bachelor's degree or higher: 16.2%
Graduate or professional degree: 5.4%
Unemployed: 5.0%
Mean travel time to work (commute): 30.6 minutes
For population 15 years and over in 62640:
Never married: 29.9%
Now married: 52.1%
Separated: 0.8%
Widowed: 4.8%
Divorced: 12.4%
Zip code 62640 compared to state average:
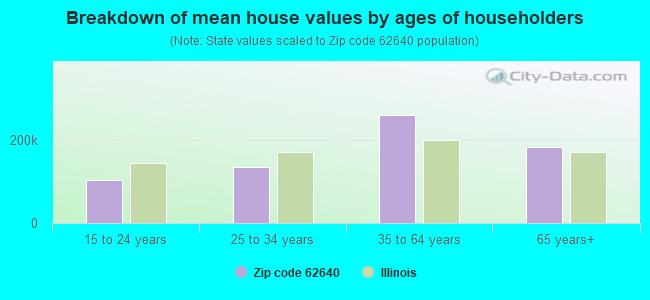
Median house value below state average.
Black race population percentage significantly below state average.
Hispanic race population percentage significantly below state average.
Median age above state average.
Foreign-born population percentage significantly below state average.
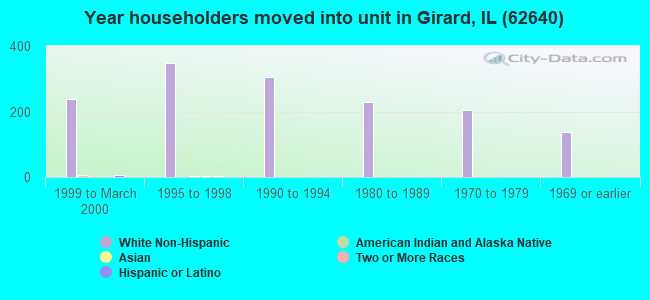
Length of stay since moving in significantly above state average.
Percentage of population with a bachelor's degree or higher below state average.
Averages for the 2020 tax year for zip code 62640, filed in 2021:
Average Adjusted Gross Income (AGI) in 2020: $58,775 (Individual Income Tax Returns)
Here:
$58,775
State:
$82,626
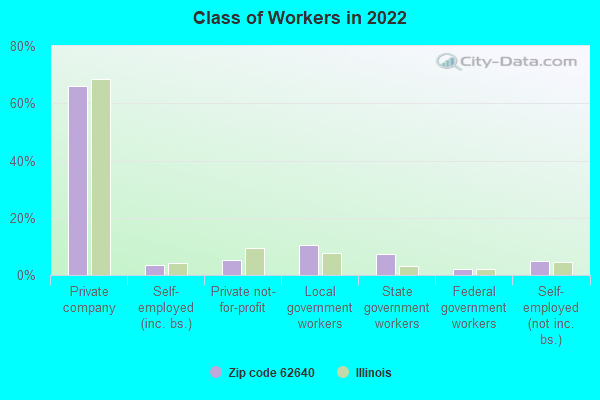
Salary/wage: $49,223 (reported on 74.5% of returns)
Here:
$49,223
State:
$66,640
(% of AGI for various income ranges: 1105.6% for AGIs below $25k, 3091.3% for AGIs $25k-50k, 5223.9% for AGIs $50k-75k, 8060.8% for AGIs $75k-100k, 14266.0% for AGIs $100k-200k)
Taxable interest for individuals: $1,052 (reported on 37.0% of returns)
This zip code:
$1,052
Illinois:
$2,376
(% of AGI for various income ranges: 22.1% for AGIs below $25k, 41.3% for AGIs $25k-50k, 45.6% for AGIs $50k-75k, 49.2% for AGIs $75k-100k, 122.0% for AGIs $100k-200k)
Ordinary dividends: $3,166 (reported on 17.6% of returns)
Here:
$3,166
State:
$9,061
(% of AGI for various income ranges: 22.6% for AGIs below $25k, 29.4% for AGIs $25k-50k, 50.6% for AGIs $50k-75k, 119.2% for AGIs $75k-100k, 201.3% for AGIs $100k-200k)
Net capital gain/loss in AGI: +$6,025 (reported on 14.5% of returns)
Here:
+$6,025
State:
+$31,684
(% of AGI for various income ranges: 5.4% for AGIs below $25k, 23.5% for AGIs $25k-50k, 86.7% for AGIs $50k-75k, 66.7% for AGIs $75k-100k, 416.0% for AGIs $100k-200k)
Profit/loss from business: +$9,205 (reported on 11.5% of returns)
Here:
+$9,205
State:
+$12,175
(% of AGI for various income ranges: 38.5% for AGIs below $25k, 118.4% for AGIs $25k-50k, 67.8% for AGIs $50k-75k, 220.0% for AGIs $75k-100k, 564.0% for AGIs $100k-200k)
Taxable individual retirement arrangement distribution: $16,594 (reported on 10.9% of returns)
62640:
$16,594
Illinois:
$21,613
(% of AGI for various income ranges: 48.5% for AGIs below $25k, 116.8% for AGIs $25k-50k, 241.7% for AGIs $50k-75k, 384.2% for AGIs $75k-100k, 1026.7% for AGIs $100k-200k)
Total itemized deductions: $28,020 (reported on 3.0% of returns)
Here:
$28,020
State:
$34,948
(% of AGI for various income ranges: 1167.5% for AGIs $75k-100k)
Charity contributions: $6,750 (reported on 2.4% of returns)
Here:
$6,750
State:
$13,122
(% of AGI for various income ranges: 225.0% for AGIs $75k-100k)
Taxes paid: $5,900 (reported on 3.0% of returns)
62640:
$5,900
State:
$8,563
(% of AGI for various income ranges: 245.8% for AGIs $75k-100k)
Earned income credit: $2,162 (reported on 15.8% of returns)
Here:
$2,162
State:
$2,311
(% of AGI for various income ranges: 94.1% for AGIs below $25k, 62.9% for AGIs $25k-50k)
Percentage of individuals using paid preparers for their 2020 taxes: 94.5%
Here:
95%
State:
93%
(% for various income ranges: 96.2% for AGIs below $25k, 94.9% for AGIs $25k-50k, 92.0% for AGIs $50k-75k, 94.4% for AGIs $75k-100k, 92.3% for AGIs $100k-200k, 100.0% for AGIs over 200k)
Averages for the 2012 tax year for zip code 62640, filed in 2013:
Average Adjusted Gross Income (AGI) in 2012: $55,640 (Individual Income Tax Returns)
Here:
$55,640
State:
$68,058
Salary/wage: $43,025 (reported on 80.2% of returns)
Here:
$43,025
State:
$55,396
(% of AGI for various income ranges: 68.1% for AGIs below $25k, 72.5% for AGIs $25k-50k, 66.0% for AGIs $50k-75k, 70.2% for AGIs $75k-100k, 64.6% for AGIs $100k-200k, 30.1% for AGIs over 200k)
Taxable interest for individuals: $1,282 (reported on 40.7% of returns)
This zip code:
$1,282
Illinois:
$1,969
(% of AGI for various income ranges: 2.0% for AGIs below $25k, 0.9% for AGIs $25k-50k, 0.5% for AGIs $50k-75k, 0.6% for AGIs $75k-100k, 0.9% for AGIs $100k-200k, 1.4% for AGIs over 200k)
Ordinary dividends: $2,593 (reported on 18.5% of returns)
Here:
$2,593
State:
$7,786
(% of AGI for various income ranges: 1.4% for AGIs below $25k, 0.7% for AGIs $25k-50k, 1.0% for AGIs $50k-75k, 1.1% for AGIs $75k-100k, 0.8% for AGIs $100k-200k, 0.5% for AGIs over 200k)
Net capital gain/loss in AGI: +$7,958 (reported on 11.7% of returns)
Here:
+$7,958
State:
+$22,183
(% of AGI for various income ranges: 0.7% for AGIs $25k-50k, 1.2% for AGIs $50k-75k, 0.9% for AGIs $75k-100k, 4.4% for AGIs $100k-200k)
Profit/loss from business: +$12,025 (reported on 12.3% of returns)
Here:
+$12,025
State:
+$12,903
(% of AGI for various income ranges: 4.7% for AGIs below $25k, 2.2% for AGIs $25k-50k, 2.3% for AGIs $50k-75k, 2.1% for AGIs $75k-100k, 4.4% for AGIs $100k-200k)
Taxable individual retirement arrangement distribution: $8,147 (reported on 11.7% of returns)
62640:
$8,147
Illinois:
$17,929
(% of AGI for various income ranges: 3.8% for AGIs below $25k, 1.4% for AGIs $25k-50k, 1.4% for AGIs $50k-75k, 2.4% for AGIs $75k-100k, 2.0% for AGIs $100k-200k)
Total itemized deductions: $19,218 (17% of AGI, reported on 23.5% of returns)
Here:
$19,218
State:
$26,433
Here:
17.3% of AGI
State:
19.2% of AGI
(% of AGI for various income ranges: 7.4% for AGIs $25k-50k, 8.4% for AGIs $50k-75k, 7.1% for AGIs $75k-100k, 11.2% for AGIs $100k-200k, 8.5% for AGIs over 200k)
Charity contributions: $3,708 (reported on 16.0% of returns)
Here:
$3,708
State:
$4,525
(% of AGI for various income ranges: 0.5% for AGIs $25k-50k, 0.9% for AGIs $50k-75k, 0.9% for AGIs $75k-100k, 1.5% for AGIs $100k-200k, 1.8% for AGIs over 200k)
Taxes paid: $7,418 (reported on 23.5% of returns)
62640:
$7,418
State:
$11,968
(% of AGI for various income ranges: 1.8% for AGIs $25k-50k, 2.5% for AGIs $50k-75k, 2.7% for AGIs $75k-100k, 4.6% for AGIs $100k-200k, 4.7% for AGIs over 200k)
Earned income credit: $2,337 (reported on 16.7% of returns)
Here:
$2,337
State:
$2,349
(% of AGI for various income ranges: 6.4% for AGIs below $25k, 1.1% for AGIs $25k-50k)
Percentage of individuals using paid preparers for their 2012 taxes: 59.9%
Here:
60%
State:
57%
(% for various income ranges: 55.9% for AGIs below $25k, 57.9% for AGIs $25k-50k, 64.0% for AGIs $50k-75k, 58.8% for AGIs $75k-100k, 65.0% for AGIs $100k-200k, 100.0% for AGIs over 200k)
Averages for the 2004 tax year for zip code 62640, filed in 2005:
Average Adjusted Gross Income (AGI) in 2004: $38,699 (Individual Income Tax Returns)
Here:
$38,699
State:
$54,625
Salary/wage: $33,771 (reported on 83.2% of returns)
Here:
$33,771
State:
$46,811
(% of AGI for various income ranges: 117.1% for AGIs below $10k, 73.1% for AGIs $10k-25k, 78.1% for AGIs $25k-50k, 76.1% for AGIs $50k-75k, 75.1% for AGIs $75k-100k, 51.8% for AGIs over 100k)
Taxable interest for individuals: $1,688 (reported on 46.6% of returns)
This zip code:
$1,688
Illinois:
$2,101
(% of AGI for various income ranges: 8.3% for AGIs below $10k, 2.9% for AGIs $10k-25k, 1.6% for AGIs $25k-50k, 1.6% for AGIs $50k-75k, 2.5% for AGIs $75k-100k, 1.6% for AGIs over 100k)
Taxable dividends: $1,788 (reported on 22.8% of returns)
Here:
$1,788
State:
$4,306
(% of AGI for various income ranges: 3.8% for AGIs below $10k, 1.5% for AGIs $10k-25k, 1.2% for AGIs $25k-50k, 0.9% for AGIs $50k-75k, 0.7% for AGIs $75k-100k, 0.8% for AGIs over 100k)
Net capital gain/loss: +$2,750 (reported on 14.8% of returns)
Here:
+$2,750
State:
+$17,321
(% of AGI for various income ranges: -2.3% for AGIs below $10k, -0.3% for AGIs $10k-25k, 0.5% for AGIs $25k-50k, 0.9% for AGIs $50k-75k, 0.3% for AGIs $75k-100k, 4.0% for AGIs over 100k)
Profit/loss from business: +$6,768 (reported on 13.5% of returns)
Here:
+$6,768
State:
+$11,771
(% of AGI for various income ranges: -4.8% for AGIs below $10k, 1.7% for AGIs $10k-25k, 2.2% for AGIs $25k-50k, 1.5% for AGIs $50k-75k, 1.7% for AGIs $75k-100k, 5.9% for AGIs over 100k)
Profit/loss from farming: +$4,467 (reported on 4.3% of returns)
Here:
+$4,467
State:
+$2,327
(% of AGI for various income ranges: -1.3% for AGIs below $10k, 0.4% for AGIs $10k-25k, -0.8% for AGIs $25k-50k, 0.4% for AGIs $50k-75k, 3.3% for AGIs over 100k)
IRA payment deduction: $3,000 (reported on 2.3% of returns)
62640:
$3,000
Illinois:
$3,087
Total itemized deductions: $13,835 (20% of AGI, reported on 20.1% of returns)
Here:
$13,835
State:
$20,239
Here:
19.6% of AGI
State:
19.5% of AGI
(% of AGI for various income ranges: 15.7% for AGIs below $10k, 5.6% for AGIs $10k-25k, 6.3% for AGIs $25k-50k, 6.7% for AGIs $50k-75k, 9.6% for AGIs $75k-100k, 7.0% for AGIs over 100k)
Charity contributions deductions: $2,687 (4% of AGI, reported on 15.7% of returns)
Here:
$2,687
State:
$3,719
Here:
3.6% of AGI
State:
3.4% of AGI
(% of AGI for various income ranges: 1.4% for AGIs below $10k, 0.4% for AGIs $10k-25k, 0.8% for AGIs $25k-50k, 1.0% for AGIs $50k-75k, 1.6% for AGIs $75k-100k, 1.6% for AGIs over 100k)
Total tax: $5,159 (reported on 74.8% of returns)
62640:
$5,159
State:
$9,882
(% of AGI for various income ranges: 2.2% for AGIs below $10k, 3.9% for AGIs $10k-25k, 6.6% for AGIs $25k-50k, 8.7% for AGIs $50k-75k, 11.5% for AGIs $75k-100k, 20.0% for AGIs over 100k)
Earned income credit: $1,750 (reported on 14.1% of returns)
Here:
$1,750
State:
$1,788
Percentage of individuals using paid preparers for their 2004 taxes: 64.8%
Here:
65%
State:
61%
(% for various income ranges: 54.8% for AGIs below $10k, 65.6% for AGIs $10k-25k, 65.9% for AGIs $25k-50k, 67.5% for AGIs $50k-75k, 73.1% for AGIs $75k-100k, 74.0% for AGIs over 100k)
Household received Food Stamps/SNAP in the past 12 months: 223 Household did not receive Food Stamps/SNAP in the past 12 months: 991
Women who had a birth in the past 12 months: 87 (54 now married, 33 unmarried) Women who did not have a birth in the past 12 months: 526 (171 now married, 356 unmarried)
Housing units in zip code 62640 with a mortgage: 552 (43 second mortgage, 28 both second mortgage and home equity loan) Houses without a mortgage: 12
Median monthly owner costs for units with a mortgage: $1,297 Median monthly owner costs for units without a mortgage: $581
Residents with income below the poverty level in 2022:
This zip code:
14.8%
Whole state:
11.9%
Residents with income below 50% of the poverty level in 2022:
This zip code:
5.4%
Whole state:
5.7%
Median number of rooms in houses and condos:
Here:
6.7
State:
6.4
Median number of rooms in apartments:
Here:
4.6
State:
4.1
Notable locations in this zip code not listed on our city pages
Notable locations in zip code 62640: Oak Leaf Country Club (A), South Otter Townhall (B), Girard Fire Protection District (C). Display/hide their locations on the map
Churches in zip code 62640 include: Pleasant Dale Church (A), Boston Chapel Christian Church (B), First Baptist Church (C), United Methodist Church of Girard (D), Trinity Lutheran Church (E), Union Chapel (F), New House of Prayer Church (G). Display/hide their locations on the map
Cemeteries: Girard City Cemetery (1), Union Chapel Cemetery (2), Girard Cemetery (3), Ross Cemetery (4), Cherry Cemetery (5). Display/hide their locations on the map
Reservoirs: Otter Lake (A), Schoper Lake (B), Sunset Lake (C), Standard City Lake (D), Girard Sunset Lake (E), Whites Pond (F). Display/hide their locations on the map
In group quarters: 12 (-1 institutionalized population)
Size of family households: 546 2-persons, 137 3-persons, 139 4-persons, 91 5-persons, 3 6-persons, 14 7-or-more-persons
Size of nonfamily households: 215 1-person, 36 2-persons, 18 4-persons
398 married couples with children.
139 single-parent households (55 men, 84 women).
98.7% of residents of 62640 zip code speak English at home.
0.3% of residents speak Spanish at home (56% very well, 44% well).
0.8% of residents speak other Indo-European language at home (83% very well, 9% well, 9% not at all).
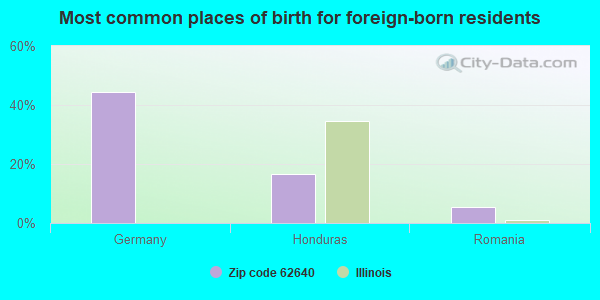
Foreign born population: 18 (0.6%) (66.9% of them are naturalized citizens)
This zip code:
0.6%
Whole state:
14.4%
44%Germany
17%Honduras
6%Romania
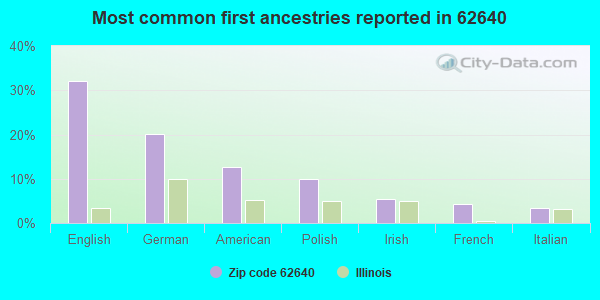
32%English
20%German
13%American
10%Polish
6%Irish
4%French
3%Italian
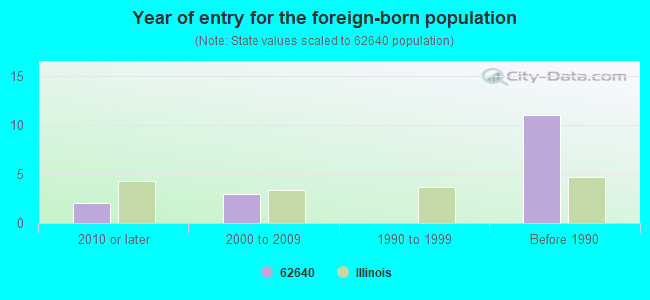
Year of entry for the foreign-born population
22010 or later
32000 to 2009
01990 to 1999
11Before 1990
Facilities with environmental interests located in this zip code:
M & M SERVICE CO (122 E CENTER in GIRARD, IL)
STATE MASTER (Illinois EPA Project) - AIR PROGRAM AIR MINOR (AIRS/AFS) COMPLIANCE ACTIVITY (Tracking inspections of insecticide, fungicide, and rodenticide, and toxic substances) CRITERIA AND HAZARDOUS AIR POLLUTANT INVENTORY (Inventory of air pollution sources) Business SIC classification: GRAIN AND FIELD BEANS Alternative names: MACOUPIN SVC CO
COWDEN AUTO BODY INC (1008 W CENTER in GIRARD, IL)
STATE MASTER (Illinois EPA Project) - AIR PROGRAM AIR MINOR (AIRS/AFS) Conditionally Exempt Small Quantity Generators, less than 100 kg/month of hazardous waste (Resource Conservation and Recovery Act (tracking hazardous waste)) - notification Business SIC classification: NONCLASSIFIABLE ESTABLISHMENTS Organizations: COWDEN MICHAEL (CONTACT/OWNER)
Alternative names: COWDENS AUTO BODY INC
CHERRY S FOODS (ROUTE 4 in GIRARD, IL)
STATE MASTER (Illinois EPA Project) - AIR PROGRAM AIR MINOR (AIRS/AFS) CRITERIA AND HAZARDOUS AIR POLLUTANT INVENTORY (Inventory of air pollution sources) Business SIC classification: GROCERY STORES Alternative names: CHERRY'S FOODS
JOHN AND DEBORAH TALBERT (238 LIBERTY COURT in GIRARD, IL)
STATE MASTER (Illinois EPA Project) - AIR PROGRAM AIR MINOR (AIRS/AFS) Business SIC classification: NONCLASSIFIABLE ESTABLISHMENTS
OTTER LAKE WTR COMMISSION WTP (13722 EMMERSON AIRLINE ROAD in GIRARD, IL)
STATE MASTER (Illinois EPA Project) - National Pollutant Discharge Elimination System Permit National Pollutant Discharge Elimination System NON-MAJOR (Tracking pollutant discharge elimination systems) - permit Business SIC classification: WATER SUPPLY
R&R BINDERY (499 RACHEL RD in GIRARD, IL)
STATE MASTER (Illinois EPA Project) - HAZARDOUS WASTE PROGRAM Conditionally Exempt Small Quantity Generators, less than 100 kg/month of hazardous waste (Resource Conservation and Recovery Act (tracking hazardous waste)) Organizations: ROBERT A MCINTIRE (CONTACT/OPERATOR)
Alternative names: R&R BINDERY SERVICE
COGA INDUSTRIES LLC - PLANT 2 (COUNTY HIGHWAY 12 in GIRARD, IL)
STATE MASTER (Illinois EPA Project) - AIR PROGRAM AIR MINOR (AIRS/AFS) Business SIC classification: NONCLASSIFIABLE ESTABLISHMENTS
D AND L TIRE AND SERVICE CENTER INC (224 W CENTER in GIRARD, IL)
(Resource Conservation and Recovery Act (tracking hazardous waste)) Organizations: LANCASTER ERIC (CONTACT/OWNER)
Housing units lacking complete plumbing facilities: 6.8% Housing units lacking complete kitchen facilities: 7.7%
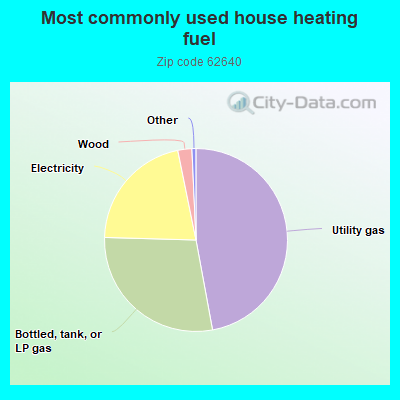
47.2%Utility gas
28.4%Bottled, tank, or LP gas
21.4%Electricity
2.5%Wood
Population in 1990: 2,454. Population change in the 1990s: +1,245 (+50.7%).
Place of birth for U.S.-born residents:
This state: 2,765
Northeast: 30
Midwest: 194
South: 150
West: 52
60% of the 62640 zip code residents lived in the same house 5 years ago. Out of people who lived in different houses, 58% lived in this county. Out of people who lived in different counties, 50% lived in Illinois.
93% of the 62640 zip code residents lived in the same house 1 year ago. Out of people who lived in different houses, 49% moved from this county. Out of people who lived in different houses, 51% moved from different county within same state.
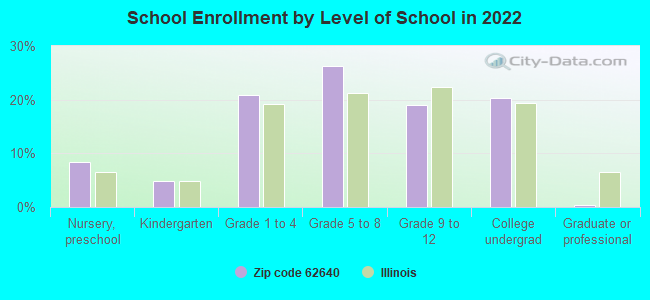
Private vs. public school enrollment:
Students in private schools in grades 1 to 8 (elementary and middle school): 86
Here:
30.6%
Illinois:
13.3%
Students in private schools in grades 9 to 12 (high school): 9
Here:
8.4%
Illinois:
9.9%
Students in private undergraduate colleges: 49
Here:
42.4%
Illinois:
27.4%
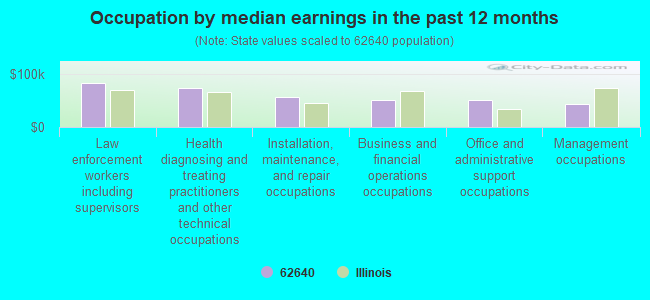
Occupation by median earnings in the past 12 months ($)
83,238Law enforcement workers including supervisors
73,151Health diagnosing and treating practitioners and other technical occupations
57,657Installation, maintenance, and repair occupations
51,350Business and financial operations occupations
51,197Office and administrative support occupations
42,963Management occupations
Top industries in this zip code by the number of employees in 2005:
Detailed PMIC statistics for the following Tracts:9561.00
, 9563.00
2002 - 2018 National Fire Incident Reporting System (NFIRS) incidents
Based on the data from the years 2002 - 2018 the average number of fires per year is 19. The highest number of fires - 34 took place in 2007, and the least - 3 in 2005. The data has a growing trend.
When looking into fire subcategories, the most reports belonged to: Outside Fires (38.5%), and Structure Fires (28.7%).
Fire incident types reported to NFIRS in Zip Code 62640


 Nearest zip codes: 62672, 62690, 62689, 62572, 62615, 62626.
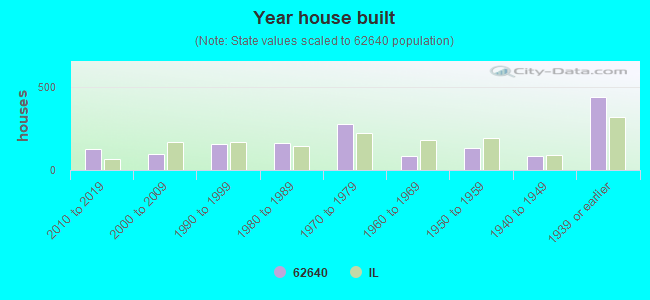


 Based on the data from the years 2002 - 2018 the average number of fires per year is 19. The highest number of fires - 34 took place in 2007, and the least - 3 in 2005. The data has a growing trend.
 When looking into fire subcategories, the most reports belonged to: Outside Fires (38.5%), and Structure Fires (28.7%).