Estimated zip code population in 2022: 1,378 Zip code population in 2010: 1,454 Zip code population in 2000: 1,541
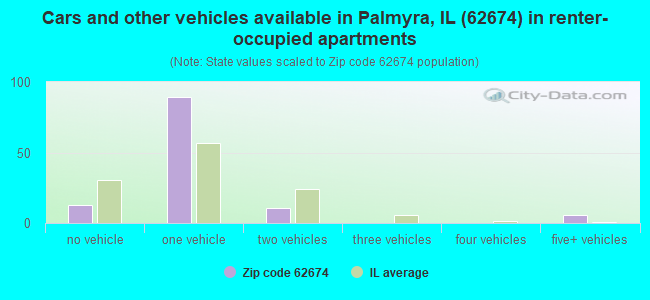
Houses and condos: 696 Renter-occupied apartments: 118
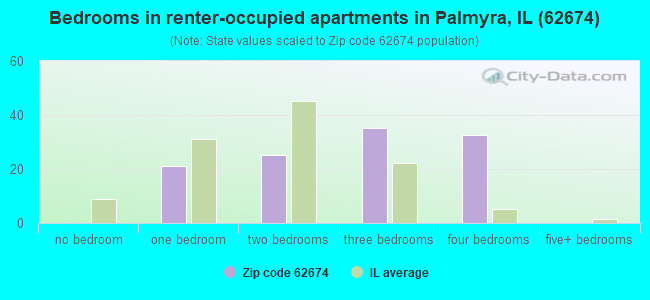
% of renters here:
22%
State:
33%
March 2022 cost of living index in zip code 62674: 84.5 (less than average, U.S. average is 100)
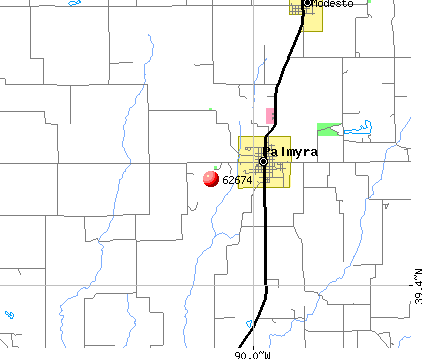
Land area: 74.5 sq. mi. Water area: 0.5 sq. mi.
Population density: 18 people per square mile
(very low).
OSM Map
General Map
Google Map
MSN Map
OSM Map
General Map
Google Map
MSN Map
OSM Map
General Map
Google Map
MSN Map
OSM Map
General Map
Google Map
MSN Map
Please wait while loading the map...
Real estate property taxes paid for housing units in 2022:
This zip code:
1.3% ($1,344)
Illinois:
2.0% ($4,912)
Median real estate property taxes paid for housing units with mortgages in 2022: $1,634 (1.2%) Median real estate property taxes paid for housing units with no mortgage in 2022: $1,278 (1.5%)
Business Search- 14 Million verified businesses
Males: 673
(48.9%)
Females: 704
(51.1%)
For population 25 years and over in 62674:
High school or higher: 87.1%
Bachelor's degree or higher: 16.7%
Graduate or professional degree: 5.6%
Unemployed: 8.1%
Mean travel time to work (commute): 36.0 minutes
For population 15 years and over in 62674:
Never married: 29.8%
Now married: 51.4%
Separated: 1.2%
Widowed: 5.4%
Divorced: 12.2%
Zip code 62674 compared to state average:
Median household income below state average.
Median house value significantly below state average.
Unemployed percentage above state average.
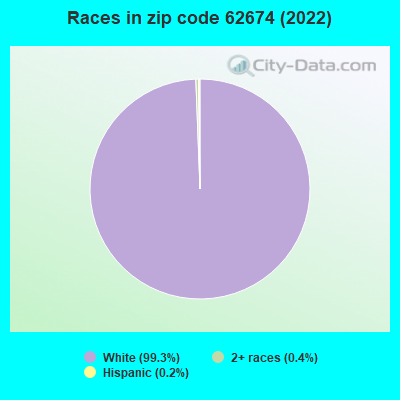
Black race population percentage significantly below state average.
Hispanic race population percentage significantly below state average.
Median age above state average.
Foreign-born population percentage significantly below state average.
Length of stay since moving in significantly above state average.
Percentage of population with a bachelor's degree or higher significantly below state average.
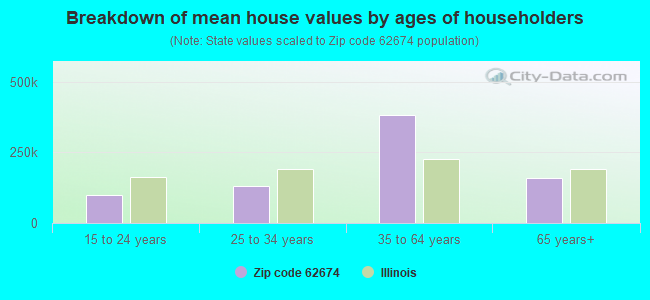
Estimated median house/condo value in 2022: $106,280
62674:
$106,280
Illinois:
$251,600
According to our research of Illinois and other state lists, there was 1 registered sex offender living in 62674 zip code as of June 20, 2024. The ratio of all residents to sex offenders in zip code 62674 is 1,397 to 1. The ratio of registered sex offenders to all residents in this zip code is lower than the state average.
Median resident age:
This zip code:
46.7 years
Illinois median age:
39.1 years
Average household size:
This zip code:
2.6 people
Illinois:
2.4 people
Averages for the 2020 tax year for zip code 62674, filed in 2021:
Average Adjusted Gross Income (AGI) in 2020: $54,536 (Individual Income Tax Returns)
Here:
$54,536
State:
$82,626
Salary/wage: $46,772 (reported on 77.0% of returns)
Here:
$46,772
State:
$66,640
(% of AGI for various income ranges: 1162.3% for AGIs below $25k, 3528.3% for AGIs $25k-50k, 5938.6% for AGIs $50k-75k, 7850.0% for AGIs $75k-100k, 20390.0% for AGIs $100k-200k)
Taxable interest for individuals: $1,014 (reported on 36.1% of returns)
This zip code:
$1,014
Illinois:
$2,376
(% of AGI for various income ranges: 14.6% for AGIs below $25k, 28.3% for AGIs $25k-50k, 82.9% for AGIs $50k-75k, 16.0% for AGIs $75k-100k, 260.0% for AGIs $100k-200k)
Ordinary dividends: $2,000 (reported on 16.4% of returns)
Here:
$2,000
State:
$9,061
(% of AGI for various income ranges: 42.5% for AGIs $25k-50k, 100.0% for AGIs $50k-75k, 197.5% for AGIs $100k-200k)
Net capital gain/loss in AGI: +$4,240 (reported on 16.4% of returns)
Here:
+$4,240
State:
+$31,684
(% of AGI for various income ranges: 59.2% for AGIs $25k-50k, 162.9% for AGIs $50k-75k, 597.5% for AGIs $100k-200k)
Profit/loss from business: +$7,643 (reported on 11.5% of returns)
Here:
+$7,643
State:
+$12,175
(% of AGI for various income ranges: 223.3% for AGIs $25k-50k, 534.0% for AGIs $75k-100k)
Taxable individual retirement arrangement distribution: $10,380 (reported on 8.2% of returns)
62674:
$10,380
Illinois:
$21,613
(% of AGI for various income ranges: 173.8% for AGIs below $25k, 418.6% for AGIs $50k-75k)
Earned income credit: $2,330 (reported on 16.4% of returns)
Here:
$2,330
State:
$2,311
(% of AGI for various income ranges: 99.2% for AGIs below $25k, 86.7% for AGIs $25k-50k)
Percentage of individuals using paid preparers for their 2020 taxes: 96.7%
Here:
97%
State:
93%
(% for various income ranges: 94.7% for AGIs below $25k, 100.0% for AGIs $25k-50k, 90.9% for AGIs $50k-75k, 100.0% for AGIs $75k-100k, 100.0% for AGIs $100k-200k)
Averages for the 2012 tax year for zip code 62674, filed in 2013:
Average Adjusted Gross Income (AGI) in 2012: $46,339 (Individual Income Tax Returns)
Here:
$46,339
State:
$68,058
Salary/wage: $34,439 (reported on 78.0% of returns)
Here:
$34,439
State:
$55,396
(% of AGI for various income ranges: 63.8% for AGIs below $25k, 77.1% for AGIs $25k-50k, 62.5% for AGIs $50k-75k, 64.1% for AGIs $75k-100k, 35.1% for AGIs $100k-200k)
Taxable interest for individuals: $1,111 (reported on 47.5% of returns)
This zip code:
$1,111
Illinois:
$1,969
(% of AGI for various income ranges: 2.4% for AGIs below $25k, 0.4% for AGIs $25k-50k, 1.1% for AGIs $50k-75k, 1.3% for AGIs $75k-100k, 1.1% for AGIs $100k-200k)
Ordinary dividends: $1,375 (reported on 13.6% of returns)
Here:
$1,375
State:
$7,786
(% of AGI for various income ranges: 0.6% for AGIs below $25k, 0.3% for AGIs $25k-50k, 1.4% for AGIs $75k-100k)
Net capital gain/loss in AGI: +$5,033 (reported on 10.2% of returns)
Here:
+$5,033
State:
+$22,183
Profit/loss from business: +$4,800 (reported on 16.9% of returns)
Here:
+$4,800
State:
+$12,903
(% of AGI for various income ranges: 7.2% for AGIs below $25k, 1.7% for AGIs $25k-50k, 3.4% for AGIs $75k-100k)
Taxable individual retirement arrangement distribution: $6,767 (reported on 10.2% of returns)
62674:
$6,767
Illinois:
$17,929
Total itemized deductions: $20,133 (20% of AGI, reported on 15.3% of returns)
Here:
$20,133
State:
$26,433
Here:
20.4% of AGI
State:
19.2% of AGI
(% of AGI for various income ranges: 11.4% for AGIs below $25k, 6.6% for AGIs $50k-75k, 7.7% for AGIs $75k-100k, 8.8% for AGIs $100k-200k)
Charity contributions: $3,900 (reported on 11.9% of returns)
Here:
$3,900
State:
$4,525
Taxes paid: $6,222 (reported on 15.3% of returns)
62674:
$6,222
State:
$11,968
(% of AGI for various income ranges: 2.0% for AGIs below $25k, 1.7% for AGIs $50k-75k, 2.5% for AGIs $75k-100k, 3.4% for AGIs $100k-200k)
Earned income credit: $2,727 (reported on 18.6% of returns)
Here:
$2,727
State:
$2,349
(% of AGI for various income ranges: 7.9% for AGIs below $25k, 1.2% for AGIs $25k-50k)
Percentage of individuals using paid preparers for their 2012 taxes: 64.4%
Here:
64%
State:
57%
(% for various income ranges: 62.5% for AGIs below $25k, 60.0% for AGIs $25k-50k, 66.7% for AGIs $50k-75k, 66.7% for AGIs $75k-100k, 80.0% for AGIs $100k-200k)
Averages for the 2004 tax year for zip code 62674, filed in 2005:
Average Adjusted Gross Income (AGI) in 2004: $35,000 (Individual Income Tax Returns)
Here:
$35,000
State:
$54,625
Salary/wage: $29,646 (reported on 80.7% of returns)
Here:
$29,646
State:
$46,811
(% of AGI for various income ranges: 98.1% for AGIs below $10k, 71.5% for AGIs $10k-25k, 74.8% for AGIs $25k-50k, 69.5% for AGIs $50k-75k, 65.4% for AGIs $75k-100k, 48.1% for AGIs over 100k)
Taxable interest for individuals: $1,689 (reported on 51.5% of returns)
This zip code:
$1,689
Illinois:
$2,101
(% of AGI for various income ranges: 11.2% for AGIs below $10k, 3.2% for AGIs $10k-25k, 2.0% for AGIs $25k-50k, 2.7% for AGIs $50k-75k, 0.8% for AGIs $75k-100k, 2.2% for AGIs over 100k)
Taxable dividends: $1,357 (reported on 18.8% of returns)
Here:
$1,357
State:
$4,306
(% of AGI for various income ranges: 1.0% for AGIs $10k-25k, 0.3% for AGIs $25k-50k, 1.1% for AGIs $50k-75k, 1.1% for AGIs over 100k)
Net capital gain/loss: +$1,388 (reported on 13.1% of returns)
Here:
+$1,388
State:
+$17,321
(% of AGI for various income ranges: 0.1% for AGIs $10k-25k, -0.0% for AGIs $25k-50k, 0.8% for AGIs $50k-75k, 2.8% for AGIs $75k-100k)
Profit/loss from business: +$5,790 (reported on 17.2% of returns)
Here:
+$5,790
State:
+$11,771
(% of AGI for various income ranges: 6.1% for AGIs below $10k, 6.2% for AGIs $10k-25k, 1.5% for AGIs $25k-50k, 4.7% for AGIs $50k-75k)
Profit/loss from farming: +$5,424 (reported on 9.6% of returns)
Here:
+$5,424
State:
+$2,327
IRA payment deduction: $2,118 (reported on 2.8% of returns)
62674:
$2,118
Illinois:
$3,087
Total itemized deductions: $15,805 (25% of AGI, reported on 13.4% of returns)
Here:
$15,805
State:
$20,239
Here:
25.2% of AGI
State:
19.5% of AGI
(% of AGI for various income ranges: 3.6% for AGIs $10k-25k, 6.1% for AGIs $25k-50k, 7.1% for AGIs $50k-75k, 10.7% for AGIs over 100k)
Charity contributions deductions: $2,966 (4% of AGI, reported on 9.6% of returns)
Here:
$2,966
State:
$3,719
Here:
4.2% of AGI
State:
3.4% of AGI
Total tax: $4,521 (reported on 74.0% of returns)
62674:
$4,521
State:
$9,882
(% of AGI for various income ranges: 4.2% for AGIs below $10k, 4.6% for AGIs $10k-25k, 7.2% for AGIs $25k-50k, 9.8% for AGIs $50k-75k, 10.3% for AGIs $75k-100k, 18.7% for AGIs over 100k)
Earned income credit: $1,895 (reported on 17.2% of returns)
Here:
$1,895
State:
$1,788
Percentage of individuals using paid preparers for their 2004 taxes: 68.1%
Here:
68%
State:
61%
(% for various income ranges: 68.1% for AGIs below $10k, 68.8% for AGIs $10k-25k, 66.1% for AGIs $25k-50k, 65.1% for AGIs $50k-75k, 79.2% for AGIs $75k-100k, 81.8% for AGIs over 100k)
Household received Food Stamps/SNAP in the past 12 months: 105 Household did not receive Food Stamps/SNAP in the past 12 months: 424
Women who had a birth in the past 12 months: 32 (32 now married, 0 unmarried) Women who did not have a birth in the past 12 months: 279 (88 now married, 191 unmarried)
Housing units in zip code 62674 with a mortgage: 153 (12 second mortgage, 4 both second mortgage and home equity loan) Median monthly owner costs for units with a mortgage: $853 Median monthly owner costs for units without a mortgage: $499
Residents with income below the poverty level in 2022:
This zip code:
22.9%
Whole state:
11.9%
Residents with income below 50% of the poverty level in 2022:
This zip code:
3.1%
Whole state:
5.7%
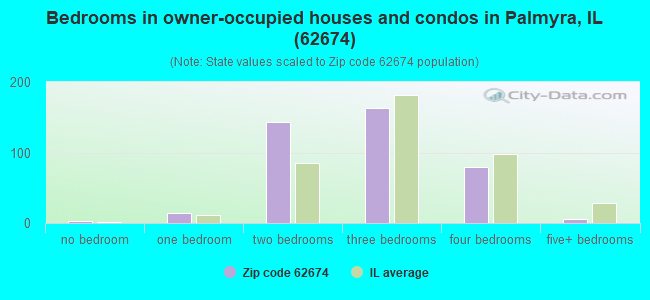
Median number of rooms in houses and condos:
Here:
6.0
State:
6.4
Median number of rooms in apartments:
Here:
5.5
State:
4.1
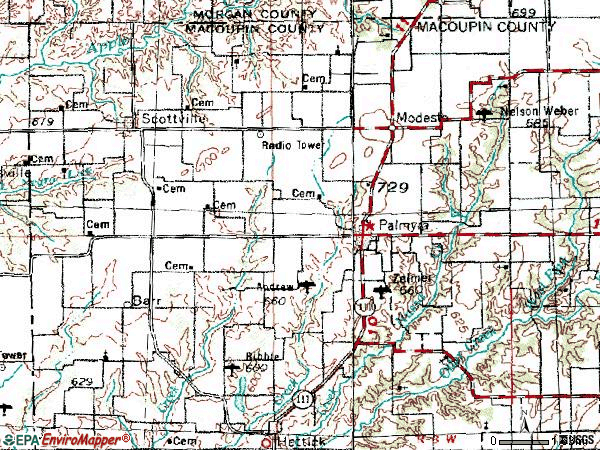
Notable locations in this zip code not listed on our city pages
Notable locations in zip code 62674: Northwestern Area Ambulance and Rescue Service (A), Scottville - Modesto Rural Fire Protection District (B), Palmyra Volunteer Fire Department (C). Display/hide their locations on the map
Churches in zip code 62674 include: Blooming Grove Christian Church (A), Pleasant View Church (B), Concord Church (C), Palmyra Christian Church (D), Holy Rosary Church (E). Display/hide their locations on the map
Cemeteries: Bacon Cemetery (1), Weller Cemetery (2), Scottville West Cemetery (3), Hollingsworth Cemetery (4), Doss Grave (5), Miller Cemetery (6), O'Neal Cemetery (7). Display/hide their locations on the map
Streams, rivers, and creeks: East Fork Otter Creek (A), West Fork Otter Creek (B), Little Negro Lick (C), Hicks Creek (D), Wolf Branch (E), Panther Creek (F). Display/hide their locations on the map
Size of family households: 190 2-persons, 69 3-persons, 44 4-persons, 15 5-persons, 28 6-persons, 13 7-or-more-persons
Size of nonfamily households: 139 1-person, 21 2-persons, 3 4-persons
134 married couples with children.
155 single-parent households (5 men, 150 women).
99.7% of residents of 62674 zip code speak English at home.
0.2% of residents speak Spanish at home (100% well).
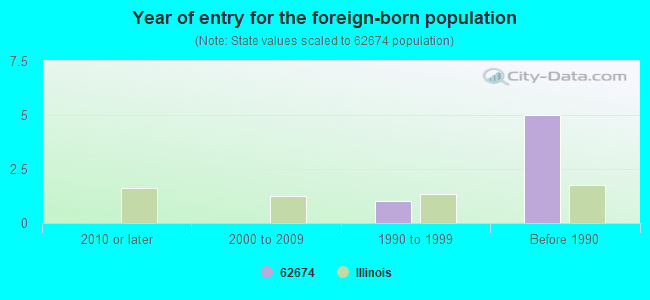
Foreign born population: 3 (0.2%) (100.0% of them are naturalized citizens)
This zip code:
0.2%
Whole state:
14.4%
100%France
44%German
26%English
9%American
7%Irish
4%Italian
2%Scottish
1%Polish
Year of entry for the foreign-born population
02010 or later
02000 to 2009
11990 to 1999
5Before 1990
Major facilities with environmental interests located in this zip code:
MACOUPIN SERVICE CO (E STATE ST in PALMYRA, IL)
STATE MASTER (Illinois EPA Project) - SOLID WASTE PROGRAM (Resource Conservation and Recovery Act (tracking hazardous waste))
ROBERT JOHNSON GRAIN CO INC (ROUTE 111 N in PALMYRA, IL)
STATE MASTER (Illinois EPA Project) - AIR PROGRAM AIR MINOR (AIRS/AFS) CRITERIA AND HAZARDOUS AIR POLLUTANT INVENTORY (Inventory of air pollution sources) Business SIC classification: GRAIN AND FIELD BEANS
ILLINI FEEDERS (RURAL ROUTE 1, BOX 256 in PALMYRA, IL)
STATE MASTER (Illinois EPA Project) - National Pollutant Discharge Elimination System Permit National Pollutant Discharge Elimination System NON-MAJOR (Tracking pollutant discharge elimination systems) - permit Business SIC classification: MEAT PACKING PLANTS
ILLINI GRAIN CO (PO BOX 277 in PALMYRA, IL)
STATE MASTER (Illinois EPA Project) - AIR PROGRAM AIR MINOR (AIRS/AFS) Business SIC classification: GRAIN AND FIELD BEANS
MACOUPIN SERVICE CO (PALMYRA-GIRARD ROAD in PALMYRA, IL)
STATE MASTER (Illinois EPA Project) - AIR PROGRAM AIR MINOR (AIRS/AFS) Business SIC classification: GRAIN AND FIELD BEANS
NIFONG FUEL & SUPPLY CO (EAST STATE STREET in PALMYRA, IL)
STATE MASTER (Illinois EPA Project) - SOLID WASTE PROGRAM, AIR PROGRAM AIR MINOR (AIRS/AFS) Business SIC classification: PETROLEUM BULK STATIONS AND TERMINALS
PALMYRA STP (114 EAST STATE STREET in PALMYRA, IL)
STATE MASTER (Illinois EPA Project) - National Pollutant Discharge Elimination System Permit National Pollutant Discharge Elimination System NON-MAJOR (Tracking pollutant discharge elimination systems) - permit Business SIC classification: SEWERAGE SYSTEMS Alternative names: PALMYRA STP, VILLAGE OF
NORTHWESTERN ELEM SCHOOL (30953 ROUTE 111 in PALMYRA, IL)
(National Center for Education Statistics) - STATE ID-4005600202005 Organizations: NORTHWESTERN C U SCH DIST 2 (SCHOOL DISTRICT)
NORTHWESTERN HIGH SCHOOL (30889 ROUTE 111 in PALMYRA, IL)
(National Center for Education Statistics) - STATE ID-4005600200004 Organizations: NORTHWESTERN C U SCH DIST 2 (SCHOOL DISTRICT)
NORTHWESTERN JR HIGH SCHOOL (30889 ROUTE 111 in PALMYRA, IL)
(National Center for Education Statistics) - STATE ID-4005600201001 Organizations: NORTHWESTERN C U SCH DIST 2 (SCHOOL DISTRICT)
M&M SERVICE CO (EAST MAIN STREET in PALMYRA, IL)
AIR MINOR (AIRS/AFS) CRITERIA AND HAZARDOUS AIR POLLUTANT INVENTORY (Inventory of air pollution sources) Business SIC classification: GRAIN AND FIELD BEANS Alternative names: M&M SERVICE COMPANY -PALMYRA ELEV.
PASSALACQUA & POWELL (CORNER OF STATE & UNION in PALMYRA, IL)
National Pollutant Discharge Elimination System NON-MAJOR (Tracking pollutant discharge elimination systems) - permit
LIGHTHOUSE CHRISTIAN ACADEMY (PO BOX 356 in PALMYRA, IL)
COMPLIANCE ACTIVITY (Tracking inspections of insecticide, fungicide, and rodenticide, and toxic substances)
Housing units lacking complete plumbing facilities: 4.9% Housing units lacking complete kitchen facilities: 8.7%
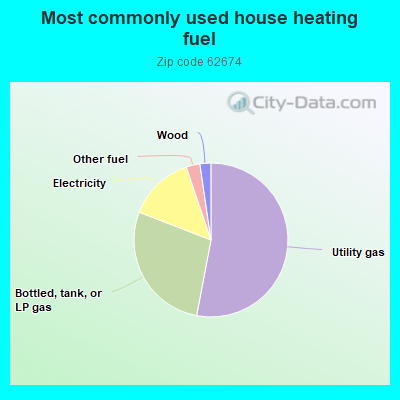
53.2%Utility gas
28.0%Bottled, tank, or LP gas
14.0%Electricity
2.9%Other fuel
2.3%Wood
Population in 1990: 1,490. Population change in the 1990s: +51 (+3.4%).
Place of birth for U.S.-born residents:
This state: 1,136
Midwest: 200
South: 24
West: 4
68% of the 62674 zip code residents lived in the same house 5 years ago. Out of people who lived in different houses, 54% lived in this county. Out of people who lived in different counties, 50% lived in Illinois.
93% of the 62674 zip code residents lived in the same house 1 year ago. Out of people who lived in different houses, 59% moved from this county. Out of people who lived in different houses, 28% moved from different county within same state. Out of people who lived in different houses, 10% moved from different state.
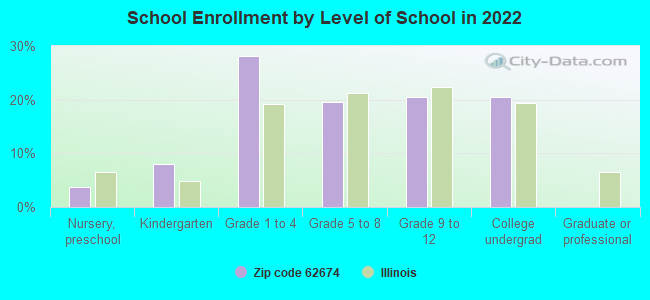
Private vs. public school enrollment:
Students in private schools in grades 1 to 8 (elementary and middle school): 14
Here:
9.3%
Illinois:
13.3%
Students in private schools in grades 9 to 12 (high school): 11
Here:
16.9%
Illinois:
9.9%
Students in private undergraduate colleges: 39
Here:
60.7%
Illinois:
27.4%
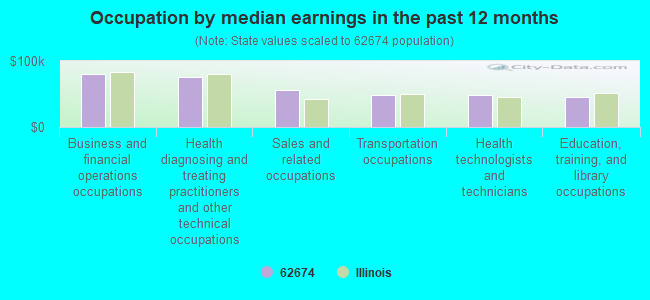
Occupation by median earnings in the past 12 months ($)
80,752Business and financial operations occupations
75,113Health diagnosing and treating practitioners and other technical occupations
55,812Sales and related occupations
48,677Transportation occupations
47,952Health technologists and technicians
44,896Education, training, and library occupations
Top industries in this zip code by the number of employees in 2005:
Wholesale Trade: Grain and Field Bean Merchant Wholesalers (10-19 employees: 1 establishment, 1-4 employees: 1 establishment)
Construction: Site Preparation Contractors (10-19: 1, 1-4: 1)
Construction: New Multifamily Housing Construction (except Operative Builders) (5-9: 1)
Finance and Insurance: Commercial Banking (5-9: 1)
Other Services (except Public Administration): Voluntary Health Organizations (5-9: 1)
Accommodation and Food Services: Full-Service Restaurants (1-4: 2)
Finance and Insurance: Insurance Agencies and Brokerages (1-4: 1)
Fatal accident statistics in 2012:
Fatal accident count: 1
Vehicles involved in fatal accidents: 1
Fatal accidents caused by drunken drivers: 1
Fatalities: 1
Persons involved in fatal accidents: 4
Pedestrians involved in fatal accidents: 0
Fatal accident statistics in 2010:
Fatal accident count: 1
Vehicles involved in fatal accidents: 2
Fatal accidents caused by drunken drivers: 0
Fatalities: 1
Persons involved in fatal accidents: 2
Pedestrians involved in fatal accidents: 0
Home Mortgage Disclosure Act Aggregated Statistics For Year 2009 (Based on 2 partial tracts)
A) FHA, FSA/RHS & VA Home Purchase Loans
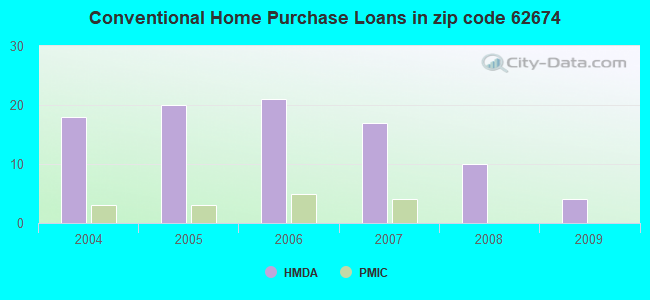
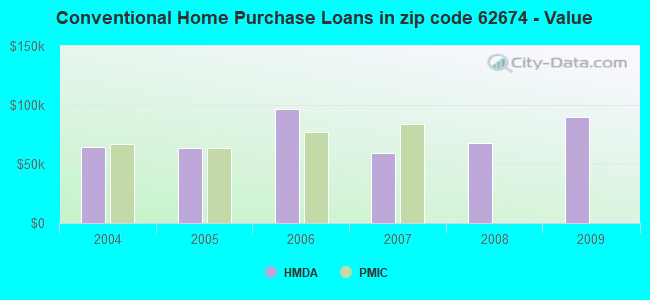
B) Conventional Home Purchase Loans
C) Refinancings
D) Home Improvement Loans
F) Non-occupant Loans on < 5 Family Dwellings (A B C & D)
G) Loans On Manufactured Home Dwelling (A B C & D)
Number
Average Value
Number
Average Value
Number
Average Value
Number
Average Value
Number
Average Value
Number
Average Value
LOANS ORIGINATED
3
$47,083
4
$89,410
79
$108,156
7
$35,206
7
$114,206
2
$30,555
APPLICATIONS APPROVED, NOT ACCEPTED
0
$0
0
$0
7
$146,120
0
$0
0
$0
0
$0
APPLICATIONS DENIED
0
$0
5
$48,688
8
$99,930
1
$25,050
2
$59,605
0
$0
APPLICATIONS WITHDRAWN
1
$46,080
0
$0
3
$51,427
0
$0
0
$0
0
$0
FILES CLOSED FOR INCOMPLETENESS
1
$59,110
0
$0
1
$69,120
1
$15,030
0
$0
0
$0
Aggregated Statistics For Year 2008 (Based on 2 partial tracts)
A) FHA, FSA/RHS & VA Home Purchase Loans
B) Conventional Home Purchase Loans
C) Refinancings
D) Home Improvement Loans
F) Non-occupant Loans on < 5 Family Dwellings (A B C & D)
G) Loans On Manufactured Home Dwelling (A B C & D)
Number
Average Value
Number
Average Value
Number
Average Value
Number
Average Value
Number
Average Value
Number
Average Value
LOANS ORIGINATED
5
$72,932
10
$67,722
42
$87,586
4
$65,618
1
$16,030
5
$57,704
APPLICATIONS APPROVED, NOT ACCEPTED
0
$0
3
$72,463
5
$88,158
0
$0
0
$0
2
$64,115
APPLICATIONS DENIED
3
$60,777
7
$44,366
8
$92,791
6
$37,400
0
$0
3
$62,780
APPLICATIONS WITHDRAWN
0
$0
1
$90,160
3
$119,213
0
$0
0
$0
1
$90,160
FILES CLOSED FOR INCOMPLETENESS
0
$0
0
$0
0
$0
0
$0
0
$0
0
$0
Aggregated Statistics For Year 2007 (Based on 2 partial tracts)
A) FHA, FSA/RHS & VA Home Purchase Loans
B) Conventional Home Purchase Loans
C) Refinancings
D) Home Improvement Loans
F) Non-occupant Loans on < 5 Family Dwellings (A B C & D)
G) Loans On Manufactured Home Dwelling (A B C & D)
Number
Average Value
Number
Average Value
Number
Average Value
Number
Average Value
Number
Average Value
Number
Average Value
LOANS ORIGINATED
1
$86,150
17
$59,519
35
$77,940
13
$29,745
6
$38,235
6
$43,245
APPLICATIONS APPROVED, NOT ACCEPTED
0
$0
0
$0
0
$0
2
$35,065
0
$0
1
$60,110
APPLICATIONS DENIED
0
$0
7
$45,081
15
$67,455
4
$35,815
0
$0
1
$30,050
APPLICATIONS WITHDRAWN
0
$0
2
$119,215
4
$39,070
0
$0
0
$0
0
$0
FILES CLOSED FOR INCOMPLETENESS
0
$0
0
$0
1
$70,130
0
$0
0
$0
0
$0
Aggregated Statistics For Year 2006 (Based on 2 partial tracts)
A) FHA, FSA/RHS & VA Home Purchase Loans
B) Conventional Home Purchase Loans
C) Refinancings
D) Home Improvement Loans
F) Non-occupant Loans on < 5 Family Dwellings (A B C & D)
G) Loans On Manufactured Home Dwelling (A B C & D)
Number
Average Value
Number
Average Value
Number
Average Value
Number
Average Value
Number
Average Value
Number
Average Value
LOANS ORIGINATED
2
$51,595
21
$96,984
30
$81,947
5
$19,234
2
$55,600
3
$67,453
APPLICATIONS APPROVED, NOT ACCEPTED
0
$0
4
$98,178
7
$116,066
0
$0
0
$0
1
$28,050
APPLICATIONS DENIED
1
$60,110
5
$65,318
18
$92,444
4
$37,568
0
$0
4
$65,118
APPLICATIONS WITHDRAWN
0
$0
3
$100,847
14
$152,489
0
$0
0
$0
0
$0
FILES CLOSED FOR INCOMPLETENESS
0
$0
0
$0
3
$100,180
0
$0
0
$0
0
$0
Aggregated Statistics For Year 2005 (Based on 2 partial tracts)
A) FHA, FSA/RHS & VA Home Purchase Loans
B) Conventional Home Purchase Loans
C) Refinancings
D) Home Improvement Loans
F) Non-occupant Loans on < 5 Family Dwellings (A B C & D)
G) Loans On Manufactured Home Dwelling (A B C & D)
Number
Average Value
Number
Average Value
Number
Average Value
Number
Average Value
Number
Average Value
Number
Average Value
LOANS ORIGINATED
2
$40,575
20
$63,664
18
$100,180
8
$7,012
6
$41,575
0
$0
APPLICATIONS APPROVED, NOT ACCEPTED
1
$29,050
3
$45,750
3
$71,797
0
$0
1
$67,120
2
$48,085
APPLICATIONS DENIED
1
$50,090
7
$36,780
13
$202,672
3
$15,027
1
$64,120
5
$42,076
APPLICATIONS WITHDRAWN
0
$0
4
$82,398
10
$142,556
4
$58,855
0
$0
0
$0
FILES CLOSED FOR INCOMPLETENESS
0
$0
1
$27,050
0
$0
0
$0
1
$27,050
0
$0
Aggregated Statistics For Year 2004 (Based on 2 partial tracts)
B) Conventional Home Purchase Loans
C) Refinancings
D) Home Improvement Loans
F) Non-occupant Loans on < 5 Family Dwellings (A B C & D)
G) Loans On Manufactured Home Dwelling (A B C & D)


 Nearest zip codes: 62667, 62649, 62692, 62638, 62630, 62626.