Estimated zip code population in 2022: 1,668 Zip code population in 2010: 2,097 Zip code population in 2000: 2,213
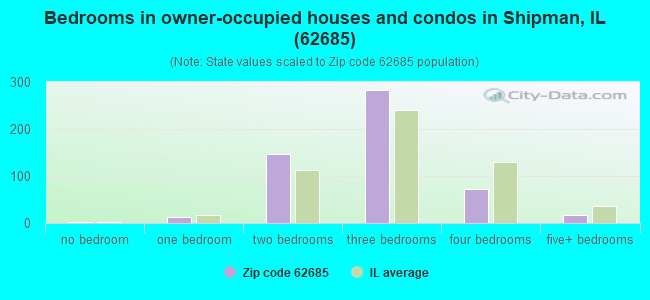
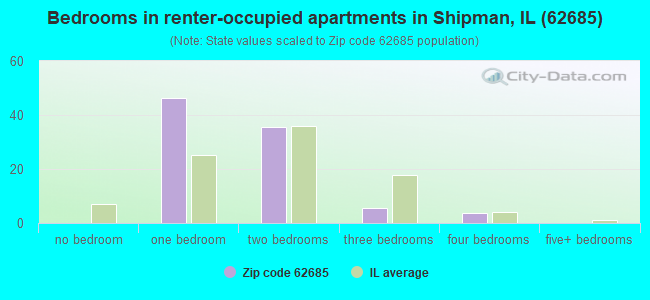
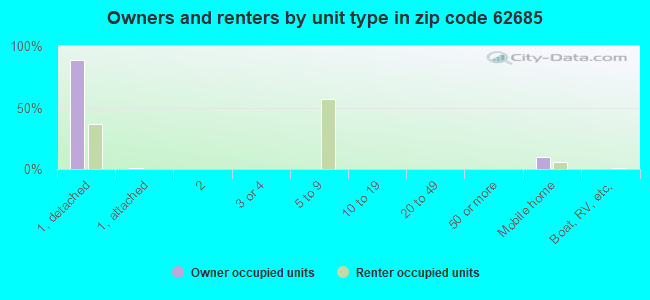
Houses and condos: 785 Renter-occupied apartments: 91
% of renters here:
14%
State:
33%
March 2022 cost of living index in zip code 62685: 82.8 (low, U.S. average is 100)
Land area: 84.3 sq. mi. Water area: 0.4 sq. mi.
Population density: 20 people per square mile
(very low).
OSM Map
General Map
Google Map
MSN Map
OSM Map
General Map
Google Map
MSN Map
OSM Map
General Map
Google Map
MSN Map
OSM Map
General Map
Google Map
MSN Map
Please wait while loading the map...
Real estate property taxes paid for housing units in 2022:
This zip code:
1.4% ($1,768)
Illinois:
2.0% ($4,912)
Median real estate property taxes paid for housing units with mortgages in 2022: $1,777 (1.5%) Median real estate property taxes paid for housing units with no mortgage in 2022: $1,740 (1.3%)
Business Search- 14 Million verified businesses
Males: 766
(45.9%)
Females: 901
(54.1%)
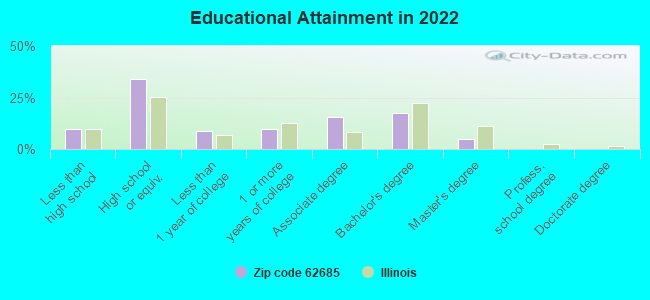
For population 25 years and over in 62685:
High school or higher: 89.0%
Bachelor's degree or higher: 22.2%
Graduate or professional degree: 5.0%
Unemployed: 5.6%
Mean travel time to work (commute): 30.2 minutes
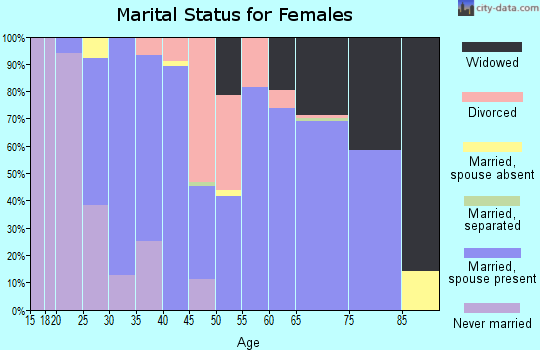
For population 15 years and over in 62685:
Never married: 20.4%
Now married: 62.1%
Separated: 0.7%
Widowed: 3.4%
Divorced: 13.4%
Zip code 62685 compared to state average:
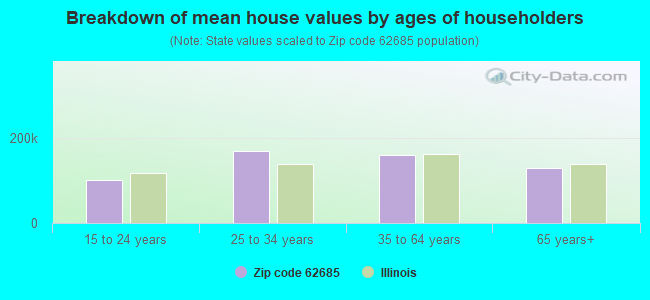
Median house value below state average.
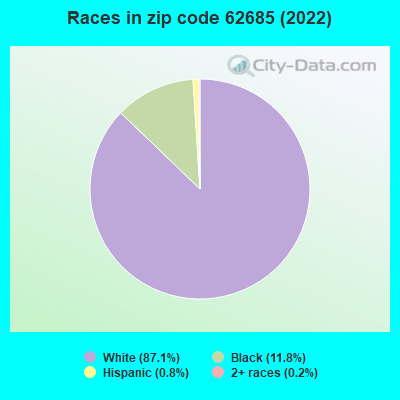
Hispanic race population percentage significantly below state average.
Median age above state average.
Foreign-born population percentage significantly below state average.
Renting percentage significantly below state average.
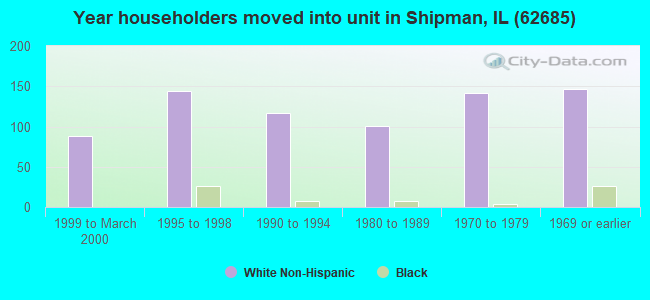
Length of stay since moving in significantly above state average.
Number of college students significantly below state average.
Percentage of population with a bachelor's degree or higher below state average.
Averages for the 2020 tax year for zip code 62685, filed in 2021:
Average Adjusted Gross Income (AGI) in 2020: $59,516 (Individual Income Tax Returns)
Here:
$59,516
State:
$82,626
Salary/wage: $51,178 (reported on 75.3% of returns)
Here:
$51,178
State:
$66,640
(% of AGI for various income ranges: 1078.9% for AGIs below $25k, 3000.0% for AGIs $25k-50k, 6591.2% for AGIs $50k-75k, 9371.4% for AGIs $75k-100k, 15906.0% for AGIs $100k-200k)
Taxable interest for individuals: $871 (reported on 42.7% of returns)
This zip code:
$871
Illinois:
$2,376
(% of AGI for various income ranges: 16.8% for AGIs below $25k, 70.7% for AGIs $25k-50k, 55.0% for AGIs $50k-75k, 47.1% for AGIs $75k-100k, 116.0% for AGIs $100k-200k)
Ordinary dividends: $3,182 (reported on 19.1% of returns)
Here:
$3,182
State:
$9,061
(% of AGI for various income ranges: 5.8% for AGIs below $25k, 80.7% for AGIs $25k-50k, 137.5% for AGIs $50k-75k, 67.1% for AGIs $75k-100k, 252.0% for AGIs $100k-200k)
Net capital gain/loss in AGI: +$5,800 (reported on 13.5% of returns)
Here:
+$5,800
State:
+$31,684
(% of AGI for various income ranges: 56.7% for AGIs $25k-50k, 156.2% for AGIs $50k-75k, 486.0% for AGIs $100k-200k)
Profit/loss from business: +$7,590 (reported on 11.2% of returns)
Here:
+$7,590
State:
+$12,175
(% of AGI for various income ranges: 76.3% for AGIs below $25k, 66.7% for AGIs $25k-50k, 315.0% for AGIs $50k-75k, 262.0% for AGIs $100k-200k)
Taxable individual retirement arrangement distribution: $13,722 (reported on 10.1% of returns)
62685:
$13,722
Illinois:
$21,613
(% of AGI for various income ranges: 88.4% for AGIs below $25k, 120.7% for AGIs $25k-50k, 436.2% for AGIs $50k-75k, 537.0% for AGIs $100k-200k)
Total itemized deductions: $28,450 (reported on 2.2% of returns)
Here:
$28,450
State:
$34,948
(% of AGI for various income ranges: 379.3% for AGIs $25k-50k)
Taxes paid: $7,200 (reported on 2.2% of returns)
62685:
$7,200
State:
$8,563
(% of AGI for various income ranges: 96.0% for AGIs $25k-50k)
Earned income credit: $1,975 (reported on 13.5% of returns)
Here:
$1,975
State:
$2,311
(% of AGI for various income ranges: 72.1% for AGIs below $25k, 66.7% for AGIs $25k-50k)
Percentage of individuals using paid preparers for their 2020 taxes: 96.6%
Here:
97%
State:
93%
(% for various income ranges: 96.4% for AGIs below $25k, 100.0% for AGIs $25k-50k, 100.0% for AGIs $50k-75k, 90.9% for AGIs $75k-100k, 94.1% for AGIs $100k-200k)
Averages for the 2012 tax year for zip code 62685, filed in 2013:
Average Adjusted Gross Income (AGI) in 2012: $49,280 (Individual Income Tax Returns)
Here:
$49,280
State:
$68,058
Salary/wage: $42,360 (reported on 80.2% of returns)
Here:
$42,360
State:
$55,396
(% of AGI for various income ranges: 64.8% for AGIs below $25k, 71.2% for AGIs $25k-50k, 73.4% for AGIs $50k-75k, 71.7% for AGIs $75k-100k, 65.1% for AGIs $100k-200k)
Taxable interest for individuals: $867 (reported on 39.6% of returns)
This zip code:
$867
Illinois:
$1,969
(% of AGI for various income ranges: 1.6% for AGIs below $25k, 1.0% for AGIs $25k-50k, 0.3% for AGIs $50k-75k, 0.6% for AGIs $75k-100k, 0.6% for AGIs $100k-200k)
Ordinary dividends: $2,016 (reported on 20.9% of returns)
Here:
$2,016
State:
$7,786
(% of AGI for various income ranges: 1.7% for AGIs below $25k, 1.2% for AGIs $25k-50k, 0.4% for AGIs $50k-75k, 1.3% for AGIs $75k-100k, 0.5% for AGIs $100k-200k)
Net capital gain/loss in AGI: +$2,300 (reported on 11.0% of returns)
Here:
+$2,300
State:
+$22,183
(% of AGI for various income ranges: 0.5% for AGIs $25k-50k, 1.3% for AGIs $75k-100k, 0.5% for AGIs $100k-200k)
Profit/loss from business: +$11,625 (reported on 13.2% of returns)
Here:
+$11,625
State:
+$12,903
(% of AGI for various income ranges: 13.3% for AGIs below $25k, 2.2% for AGIs $50k-75k, 3.9% for AGIs $100k-200k)
Taxable individual retirement arrangement distribution: $12,089 (reported on 9.9% of returns)
62685:
$12,089
Illinois:
$17,929
(% of AGI for various income ranges: 2.5% for AGIs below $25k, 5.8% for AGIs $25k-50k, 6.9% for AGIs $75k-100k)
Total itemized deductions: $16,278 (19% of AGI, reported on 19.8% of returns)
Here:
$16,278
State:
$26,433
Here:
19.3% of AGI
State:
19.2% of AGI
(% of AGI for various income ranges: 9.6% for AGIs $25k-50k, 4.9% for AGIs $50k-75k, 6.4% for AGIs $75k-100k, 7.9% for AGIs $100k-200k)
Charity contributions: $2,780 (reported on 11.0% of returns)
Here:
$2,780
State:
$4,525
(% of AGI for various income ranges: 0.9% for AGIs $25k-50k, 0.7% for AGIs $75k-100k, 0.9% for AGIs $100k-200k)
Taxes paid: $5,911 (reported on 19.8% of returns)
62685:
$5,911
State:
$11,968
(% of AGI for various income ranges: 1.8% for AGIs $25k-50k, 1.5% for AGIs $50k-75k, 2.6% for AGIs $75k-100k, 3.7% for AGIs $100k-200k)
Earned income credit: $2,185 (reported on 14.3% of returns)
Here:
$2,185
State:
$2,349
(% of AGI for various income ranges: 5.4% for AGIs below $25k, 0.7% for AGIs $25k-50k)
Percentage of individuals using paid preparers for their 2012 taxes: 71.4%
Here:
71%
State:
57%
(% for various income ranges: 62.9% for AGIs below $25k, 70.0% for AGIs $25k-50k, 73.3% for AGIs $50k-75k, 88.9% for AGIs $75k-100k, 83.3% for AGIs $100k-200k)
Averages for the 2004 tax year for zip code 62685, filed in 2005:
Average Adjusted Gross Income (AGI) in 2004: $36,844 (Individual Income Tax Returns)
Here:
$36,844
State:
$54,625
Salary/wage: $34,621 (reported on 83.4% of returns)
Here:
$34,621
State:
$46,811
(% of AGI for various income ranges: 132.9% for AGIs below $10k, 70.2% for AGIs $10k-25k, 76.6% for AGIs $25k-50k, 79.5% for AGIs $50k-75k, 82.3% for AGIs $75k-100k, 74.7% for AGIs over 100k)
Taxable interest for individuals: $979 (reported on 49.8% of returns)
This zip code:
$979
Illinois:
$2,101
(% of AGI for various income ranges: 6.9% for AGIs below $10k, 1.8% for AGIs $10k-25k, 1.6% for AGIs $25k-50k, 1.3% for AGIs $50k-75k, 0.7% for AGIs $75k-100k, 0.5% for AGIs over 100k)
Taxable dividends: $1,236 (reported on 24.4% of returns)
Here:
$1,236
State:
$4,306
(% of AGI for various income ranges: 4.0% for AGIs below $10k, 0.8% for AGIs $10k-25k, 1.1% for AGIs $25k-50k, 0.7% for AGIs $50k-75k, 0.3% for AGIs $75k-100k, 0.8% for AGIs over 100k)
Net capital gain/loss: +$1,257 (reported on 15.7% of returns)
Here:
+$1,257
State:
+$17,321
(% of AGI for various income ranges: 2.9% for AGIs below $10k, 1.1% for AGIs $10k-25k, 0.1% for AGIs $25k-50k, 0.7% for AGIs $50k-75k, 0.2% for AGIs $75k-100k, 0.5% for AGIs over 100k)
Profit/loss from business: +$2,957 (reported on 14.9% of returns)
Here:
+$2,957
State:
+$11,771
(% of AGI for various income ranges: -3.8% for AGIs below $10k, 4.8% for AGIs $10k-25k, 1.4% for AGIs $25k-50k, 0.8% for AGIs $50k-75k, 1.5% for AGIs $75k-100k, -0.9% for AGIs over 100k)
IRA payment deduction: $2,478 (reported on 2.4% of returns)
62685:
$2,478
Illinois:
$3,087
Total itemized deductions: $14,850 (23% of AGI, reported on 16.3% of returns)
Here:
$14,850
State:
$20,239
Here:
22.9% of AGI
State:
19.5% of AGI
(% of AGI for various income ranges: 6.7% for AGIs $10k-25k, 6.5% for AGIs $25k-50k, 6.1% for AGIs $50k-75k, 7.7% for AGIs $75k-100k, 7.2% for AGIs over 100k)
Charity contributions deductions: $2,523 (4% of AGI, reported on 11.6% of returns)
Here:
$2,523
State:
$3,719
Here:
3.7% of AGI
State:
3.4% of AGI
(% of AGI for various income ranges: 0.8% for AGIs $25k-50k, 0.6% for AGIs $50k-75k, 1.2% for AGIs $75k-100k, 1.5% for AGIs over 100k)
Total tax: $4,350 (reported on 77.8% of returns)
62685:
$4,350
State:
$9,882
(% of AGI for various income ranges: 3.6% for AGIs below $10k, 4.5% for AGIs $10k-25k, 7.1% for AGIs $25k-50k, 8.4% for AGIs $50k-75k, 11.5% for AGIs $75k-100k, 17.0% for AGIs over 100k)
Earned income credit: $1,512 (reported on 12.9% of returns)
Here:
$1,512
State:
$1,788
Percentage of individuals using paid preparers for their 2004 taxes: 70.2%
Here:
70%
State:
61%
(% for various income ranges: 63.6% for AGIs below $10k, 69.6% for AGIs $10k-25k, 70.7% for AGIs $25k-50k, 75.3% for AGIs $50k-75k, 74.6% for AGIs $75k-100k, 72.7% for AGIs over 100k)
Likely homosexual households (counted as self-reported same-sex unmarried-partner households)
Lesbian couples: 0.0% of all households
Gay men: 0.5% of all households
Household received Food Stamps/SNAP in the past 12 months: 101 Household did not receive Food Stamps/SNAP in the past 12 months: 528
Women who had a birth in the past 12 months: 26 (22 now married, 4 unmarried) Women who did not have a birth in the past 12 months: 281 (142 now married, 138 unmarried)
Housing units in zip code 62685 with a mortgage: 259 (11 second mortgage, 3 both second mortgage and home equity loan) Median monthly owner costs for units with a mortgage: $1,115 Median monthly owner costs for units without a mortgage: $573
Residents with income below the poverty level in 2022:
This zip code:
16.0%
Whole state:
11.9%
Residents with income below 50% of the poverty level in 2022:
This zip code:
12.2%
Whole state:
5.7%
Median number of rooms in houses and condos:
Here:
5.8
State:
6.4
Median number of rooms in apartments:
Here:
3.1
State:
4.1
Notable locations in this zip code not listed on our city pages
Cemeteries: Waggoner Cemetery (1), Brayford Cemetery (2), Shipman Cemetery (3), Armour Cemetery (4), Hillyard Cemetery (5), Morrison Cemetery (6), Miles Station Cemetery (7). Display/hide their locations on the map
Reservoirs: Beaver Dam Lake (A), Mowens Lake (B), Lake Catatoga (C), Shad Lake (D), Royal Lake (E), Meshach Lake (F), Shadrach (G), Shipman Reservoir (H). Display/hide their locations on the map
Size of family households: 290 2-persons, 77 3-persons, 59 4-persons, 48 5-persons, 4 6-persons, 9 7-or-more-persons
Size of nonfamily households: 128 1-person, 4 2-persons, 2 4-persons
245 married couples with children.
88 single-parent households (58 men, 30 women).
99.2% of residents of 62685 zip code speak English at home.
0.1% of residents speak Spanish at home (100% very well).
0.1% of residents speak Asian or Pacific Island language at home (100% well).
Foreign born population: 5 (0.3%) (100.0% of them are naturalized citizens)
This zip code:
0.3%
Whole state:
14.4%
40%Haiti
20%Thailand
34%German
12%English
8%African
8%American
4%Irish
3%Dutch
1%Italian
Year of entry for the foreign-born population
02010 or later
02000 to 2009
01990 to 1999
4Before 1990
Facilities with environmental interests located in this zip code:
GROTHAUS TRUCKING COMPANY (1 MI. S OF CARLINVILLE/SHIPMAN in PLAINVIEW, IL)
STATE MASTER (Illinois EPA Project) - National Pollutant Discharge Elimination System Permit National Pollutant Discharge Elimination System NON-MAJOR (Tracking pollutant discharge elimination systems) - permit
IL DNR-BEAVER DAM ST PK SHOWER (BEAVER DAM STATE PARK in PLAINVIEW, IL)
STATE MASTER (Illinois EPA Project) - National Pollutant Discharge Elimination System Permit National Pollutant Discharge Elimination System NON-MAJOR (Tracking pollutant discharge elimination systems) - permit Business SIC classification: RECREATIONAL VEHICLE PARKS AND CAMPSITES Alternative names: BEAVER DAM STATE PK SHOWER BLD
MOORES OIL & FERTILIZER INC (CITY OF in SHIPMAN, IL)
STATE MASTER (Illinois EPA Project) - AIR PROGRAM AIR MINOR (AIRS/AFS) Business SIC classification: FARM SUPPLIES
ROYAL LAKES STP (SOUTH OF WEST SYCAMORE STREET in ROYAL LAKES, IL)
STATE MASTER (Illinois EPA Project) - National Pollutant Discharge Elimination System Permit National Pollutant Discharge Elimination System NON-MAJOR (Tracking pollutant discharge elimination systems) - permit Business SIC classification: SEWERAGE SYSTEMS Alternative names: ROYAL LAKES STP, VILLAGE OF
M & M SERVICE COMPANY (HGWY RT #16 in SHIPMAN, IL)
AIR MINOR (AIRS/AFS) Business SIC classification: PETROLEUM BULK STATIONS AND TERMINALS
LUMMA BOB AUTO BODY (1154 W RAILROAD ST in SHIPMAN, IL)
Small Quantity Generators, between 100 kg and 1000 kg of hazardous waste/month (Resource Conservation and Recovery Act (tracking hazardous waste)) - notification
Housing units lacking complete plumbing facilities: 5.5% Housing units lacking complete kitchen facilities: 9.0%
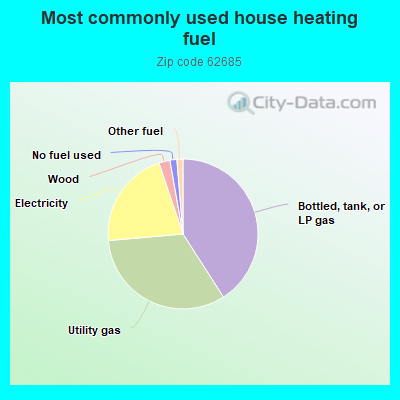
41.1%Bottled, tank, or LP gas
32.8%Utility gas
21.3%Electricity
2.4%Wood
1.5%No fuel used
1.3%Other fuel
Population in 1990: 844. Population change in the 1990s: +1,369 (+162.2%).
Place of birth for U.S.-born residents:
This state: 1,417
Northeast: 8
Midwest: 104
South: 90
West: 34
67% of the 62685 zip code residents lived in the same house 5 years ago. Out of people who lived in different houses, 54% lived in this county. Out of people who lived in different counties, 50% lived in Illinois.
91% of the 62685 zip code residents lived in the same house 1 year ago. Out of people who lived in different houses, 42% moved from this county. Out of people who lived in different houses, 24% moved from different county within same state. Out of people who lived in different houses, 26% moved from different state. Out of people who lived in different houses, 10% moved from abroad.
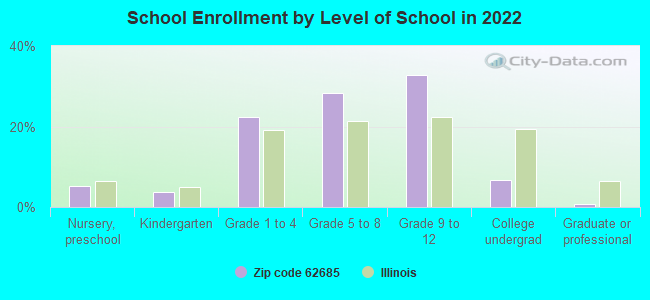
Private vs. public school enrollment:
Students in private schools in grades 1 to 8 (elementary and middle school): 17
Here:
13.1%
Illinois:
13.3%
Students in private schools in grades 9 to 12 (high school): 27
Here:
32.0%
Illinois:
9.9%
Students in private undergraduate colleges: 2
Here:
14.3%
Illinois:
27.4%
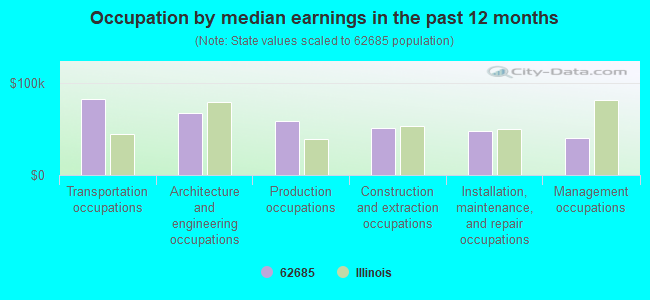
Occupation by median earnings in the past 12 months ($)
82,356Transportation occupations
67,100Architecture and engineering occupations
58,514Production occupations
50,747Construction and extraction occupations
47,605Installation, maintenance, and repair occupations
40,505Management occupations
Top industries in this zip code by the number of employees in 2005:
Wholesale Trade: Grain and Field Bean Merchant Wholesalers (20-49 employees: 1 establishment)
Accommodation and Food Services: Full-Service Restaurants (10-19: 1)
Finance and Insurance: Commercial Banking (10-19: 1)
Construction: Site Preparation Contractors (10-19: 1)
Construction: Poured Concrete Foundation and Structure Contractors (10-19: 1)
Fatal accident statistics in 2010:
Fatal accident count: 1
Vehicles involved in fatal accidents: 1
Fatal accidents caused by drunken drivers: 1
Fatalities: 1
Persons involved in fatal accidents: 1
Pedestrians involved in fatal accidents: 0
Home Mortgage Disclosure Act Aggregated Statistics For Year 2009 (Based on 6 partial tracts)
A) FHA, FSA/RHS & VA Home Purchase Loans
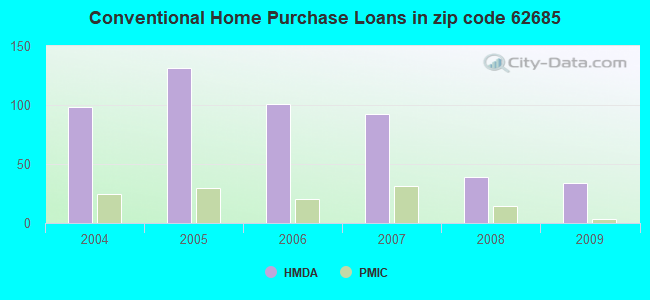
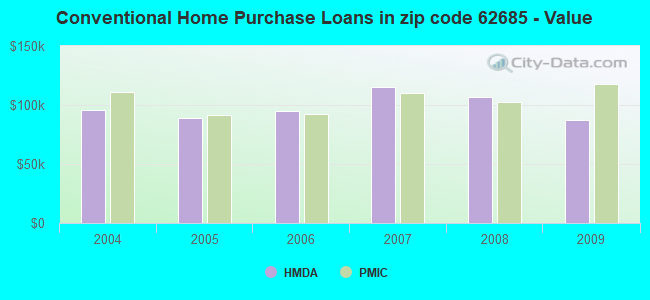
B) Conventional Home Purchase Loans
C) Refinancings
D) Home Improvement Loans
E) Loans on Dwellings For 5+ Families
F) Non-occupant Loans on < 5 Family Dwellings (A B C & D)
G) Loans On Manufactured Home Dwelling (A B C & D)
Number
Average Value
Number
Average Value
Number
Average Value
Number
Average Value
Number
Average Value
Number
Average Value
Number
Average Value
LOANS ORIGINATED
29
$103,195
34
$86,903
290
$118,738
33
$55,804
1
$230,570
30
$69,406
17
$67,788
APPLICATIONS APPROVED, NOT ACCEPTED
3
$176,520
2
$89,285
9
$145,748
0
$0
0
$0
0
$0
1
$95,860
APPLICATIONS DENIED
10
$119,472
11
$74,558
55
$109,447
8
$47,186
0
$0
2
$221,700
6
$77,530
APPLICATIONS WITHDRAWN
2
$97,820
4
$100,548
29
$132,016
3
$30,603
0
$0
2
$44,865
1
$39,060
FILES CLOSED FOR INCOMPLETENESS
2
$128,960
0
$0
2
$157,135
0
$0
0
$0
0
$0
0
$0
Aggregated Statistics For Year 2008 (Based on 6 partial tracts)
A) FHA, FSA/RHS & VA Home Purchase Loans
B) Conventional Home Purchase Loans
C) Refinancings
D) Home Improvement Loans
F) Non-occupant Loans on < 5 Family Dwellings (A B C & D)
G) Loans On Manufactured Home Dwelling (A B C & D)
Number
Average Value
Number
Average Value
Number
Average Value
Number
Average Value
Number
Average Value
Number
Average Value
LOANS ORIGINATED
21
$92,774
39
$107,182
188
$123,542
19
$45,285
14
$56,529
15
$68,332
APPLICATIONS APPROVED, NOT ACCEPTED
2
$54,980
4
$123,952
7
$115,110
1
$11,090
0
$0
0
$0
APPLICATIONS DENIED
3
$70,230
6
$85,943
61
$114,687
22
$68,408
4
$42,005
3
$59,580
APPLICATIONS WITHDRAWN
0
$0
7
$97,154
34
$120,781
2
$71,035
3
$69,070
1
$50,730
FILES CLOSED FOR INCOMPLETENESS
0
$0
1
$146,320
6
$129,435
1
$188,450
1
$25,130
1
$25,130
Aggregated Statistics For Year 2007 (Based on 6 partial tracts)
A) FHA, FSA/RHS & VA Home Purchase Loans
B) Conventional Home Purchase Loans
C) Refinancings
D) Home Improvement Loans
F) Non-occupant Loans on < 5 Family Dwellings (A B C & D)
G) Loans On Manufactured Home Dwelling (A B C & D)
Number
Average Value
Number
Average Value
Number
Average Value
Number
Average Value
Number
Average Value
Number
Average Value
LOANS ORIGINATED
11
$100,783
92
$115,453
159
$102,183
39
$32,747
20
$83,088
19
$64,077
APPLICATIONS APPROVED, NOT ACCEPTED
1
$39,180
19
$91,989
32
$92,601
2
$68,415
1
$53,980
2
$77,975
APPLICATIONS DENIED
2
$85,210
20
$96,196
115
$94,855
28
$55,125
9
$84,863
4
$49,600
APPLICATIONS WITHDRAWN
3
$100,360
5
$134,012
53
$98,299
6
$76,758
2
$71,590
0
$0
FILES CLOSED FOR INCOMPLETENESS
0
$0
0
$0
16
$110,354
0
$0
0
$0
0
$0
Aggregated Statistics For Year 2006 (Based on 6 partial tracts)
A) FHA, FSA/RHS & VA Home Purchase Loans
B) Conventional Home Purchase Loans
C) Refinancings
D) Home Improvement Loans
F) Non-occupant Loans on < 5 Family Dwellings (A B C & D)
G) Loans On Manufactured Home Dwelling (A B C & D)
Number
Average Value
Number
Average Value
Number
Average Value
Number
Average Value
Number
Average Value
Number
Average Value
LOANS ORIGINATED
13
$109,762
101
$94,888
180
$103,529
27
$34,931
34
$84,372
18
$77,258
APPLICATIONS APPROVED, NOT ACCEPTED
3
$54,490
19
$82,526
36
$92,374
4
$66,950
5
$90,894
6
$77,468
APPLICATIONS DENIED
4
$103,202
28
$83,398
110
$93,551
28
$64,327
6
$86,652
13
$77,112
APPLICATIONS WITHDRAWN
1
$152,760
20
$98,889
66
$115,986
5
$62,756
11
$96,140
6
$75,363
FILES CLOSED FOR INCOMPLETENESS
0
$0
5
$83,144
17
$138,758
1
$21,770
1
$76,860
0
$0
Aggregated Statistics For Year 2005 (Based on 6 partial tracts)
A) FHA, FSA/RHS & VA Home Purchase Loans
B) Conventional Home Purchase Loans
C) Refinancings
D) Home Improvement Loans
F) Non-occupant Loans on < 5 Family Dwellings (A B C & D)
G) Loans On Manufactured Home Dwelling (A B C & D)
Number
Average Value
Number
Average Value
Number
Average Value
Number
Average Value
Number
Average Value
Number
Average Value
LOANS ORIGINATED
14
$99,549
131
$88,834
212
$93,816
35
$29,935
21
$60,299
25
$69,277
APPLICATIONS APPROVED, NOT ACCEPTED
3
$74,290
13
$70,209
35
$102,784
5
$40,314
2
$47,110
4
$55,335
APPLICATIONS DENIED
7
$91,313
38
$77,753
119
$93,550
19
$30,909
6
$59,535
21
$69,220
APPLICATIONS WITHDRAWN
0
$0
14
$85,802
71
$106,197
12
$142,089
3
$61,270
4
$100,758
FILES CLOSED FOR INCOMPLETENESS
0
$0
8
$67,631
13
$114,797
2
$109,975
3
$51,657
1
$89,420
Aggregated Statistics For Year 2004 (Based on 6 partial tracts)
A) FHA, FSA/RHS & VA Home Purchase Loans
B) Conventional Home Purchase Loans
C) Refinancings
D) Home Improvement Loans
F) Non-occupant Loans on < 5 Family Dwellings (A B C & D)
G) Loans On Manufactured Home Dwelling (A B C & D)
2002 - 2018 National Fire Incident Reporting System (NFIRS) incidents
Based on the data from the years 2002 - 2018 the average number of fires per year is 8. The highest number of fire incidents - 25 took place in 2014, and the least - 1 in 2002. The data has an increasing trend.
When looking into fire subcategories, the most incidents belonged to: Structure Fires (55.6%), and Outside Fires (31.7%).
Fire incident types reported to NFIRS in Zip Code 62685


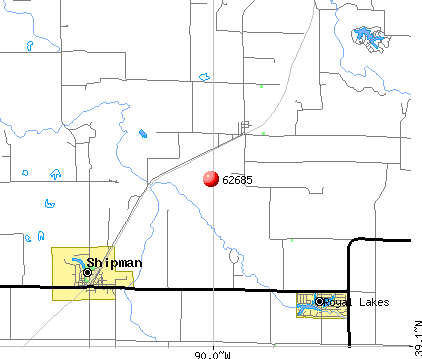 Nearest zip codes: 62014, 62079, 62630, 62021, 62063, 62030.


 Based on the data from the years 2002 - 2018 the average number of fires per year is 8. The highest number of fire incidents - 25 took place in 2014, and the least - 1 in 2002. The data has an increasing trend.
 When looking into fire subcategories, the most incidents belonged to: Structure Fires (55.6%), and Outside Fires (31.7%).