Estimated zip code population in 2022: 1,220 Zip code population in 2010: 1,592 Zip code population in 2000: 1,715
Houses and condos: 623 Renter-occupied apartments: 193
% of renters here:
37%
State:
33%
March 2022 cost of living index in zip code 62932: 83.9 (less than average, U.S. average is 100)
Land area: 38.5 sq. mi. Water area: 1.7 sq. mi.
Population density: 32 people per square mile
(very low).
OSM Map
General Map
Google Map
MSN Map
OSM Map
General Map
Google Map
MSN Map
OSM Map
General Map
Google Map
MSN Map
OSM Map
General Map
Google Map
MSN Map
Please wait while loading the map...
Real estate property taxes paid for housing units in 2022:
This zip code:
0.9% ($725)
Illinois:
2.0% ($4,912)
Median real estate property taxes paid for housing units with mortgages in 2022: $945 (1.2%) Median real estate property taxes paid for housing units with no mortgage in 2022: $667 (0.8%)
Business Search- 14 Million verified businesses
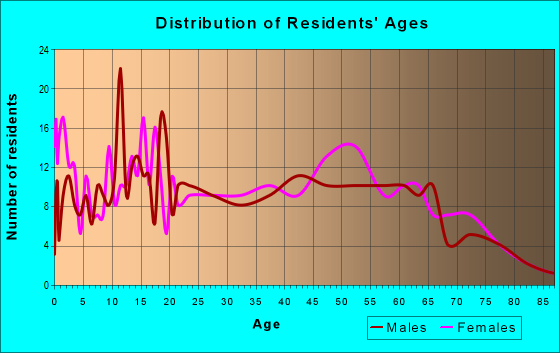
Males: 660
(54.1%)
Females: 560
(45.9%)
For population 25 years and over in 62932:
High school or higher: 81.6%
Bachelor's degree or higher: 12.1%
Graduate or professional degree: 4.9%
Unemployed: 2.6%
Mean travel time to work (commute): 25.4 minutes
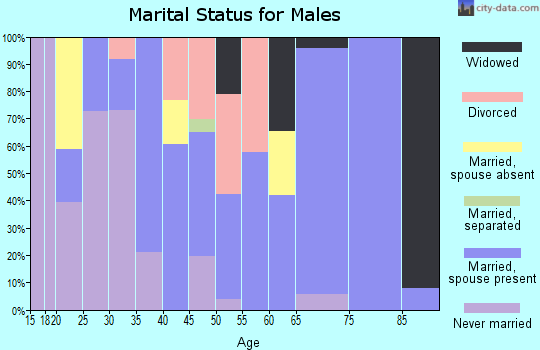
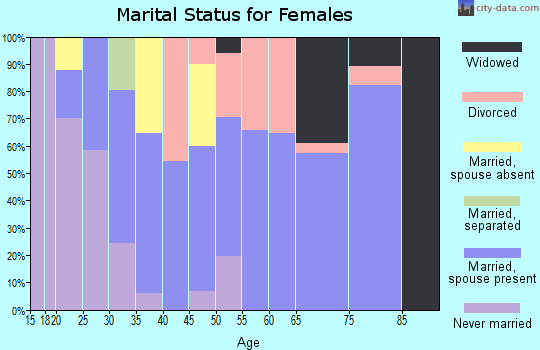
For population 15 years and over in 62932:
Never married: 17.9%
Now married: 56.5%
Separated: 5.6%
Widowed: 6.2%
Divorced: 13.9%
Zip code 62932 compared to state average:
Median household income below state average.
Median house value significantly below state average.
Unemployed percentage below state average.
Black race population percentage significantly below state average.
Hispanic race population percentage below state average.
Foreign-born population percentage significantly below state average.
Length of stay since moving in significantly above state average.
Number of college students below state average.
Percentage of population with a bachelor's degree or higher significantly below state average.
Estimated median house/condo value in 2022: $80,605
62932:
$80,605
Illinois:
$251,600
According to our research of Illinois and other state lists, there was 1 registered sex offender living in 62932 zip code as of April 27, 2024. The ratio of all residents to sex offenders in zip code 62932 is 1,875 to 1. The ratio of registered sex offenders to all residents in this zip code is lower than the state average.
Median resident age:
This zip code:
42.0 years
Illinois median age:
39.1 years
Average household size:
This zip code:
2.3 people
Illinois:
2.4 people
Averages for the 2020 tax year for zip code 62932, filed in 2021:
Average Adjusted Gross Income (AGI) in 2020: $48,278 (Individual Income Tax Returns)
Here:
$48,278
State:
$82,626
Salary/wage: $37,113 (reported on 81.2% of returns)
Here:
$37,113
State:
$66,640
(% of AGI for various income ranges: 1056.8% for AGIs below $25k, 3378.0% for AGIs $25k-50k, 6320.0% for AGIs $50k-75k, 6120.0% for AGIs $75k-100k, 14910.0% for AGIs $100k-200k)
Taxable interest for individuals: $661 (reported on 28.1% of returns)
This zip code:
$661
Illinois:
$2,376
(% of AGI for various income ranges: 2.1% for AGIs below $25k, 29.3% for AGIs $25k-50k, 25.7% for AGIs $50k-75k, 132.5% for AGIs $100k-200k)
Ordinary dividends: $2,178 (reported on 14.1% of returns)
Here:
$2,178
State:
$9,061
(% of AGI for various income ranges: 30.5% for AGIs below $25k, 100.0% for AGIs $50k-75k, 170.0% for AGIs $100k-200k)
Net capital gain/loss in AGI: +$3,467 (reported on 9.4% of returns)
Here:
+$3,467
State:
+$31,684
(% of AGI for various income ranges: 64.3% for AGIs $50k-75k, 445.0% for AGIs $100k-200k)
Profit/loss from business: +$5,133 (reported on 9.4% of returns)
Here:
+$5,133
State:
+$12,175
(% of AGI for various income ranges: 124.7% for AGIs below $25k, 101.4% for AGIs $50k-75k)
Taxable individual retirement arrangement distribution: $16,786 (reported on 10.9% of returns)
62932:
$16,786
Illinois:
$21,613
(% of AGI for various income ranges: 320.0% for AGIs $25k-50k, 2316.7% for AGIs $75k-100k)
Earned income credit: $2,627 (reported on 23.4% of returns)
Here:
$2,627
State:
$2,311
(% of AGI for various income ranges: 143.2% for AGIs below $25k, 81.3% for AGIs $25k-50k)
Percentage of individuals using paid preparers for their 2020 taxes: 95.3%
Here:
95%
State:
93%
(% for various income ranges: 95.7% for AGIs below $25k, 94.7% for AGIs $25k-50k, 100.0% for AGIs $50k-75k, 100.0% for AGIs $75k-100k, 87.5% for AGIs $100k-200k)
Averages for the 2012 tax year for zip code 62932, filed in 2013:
Average Adjusted Gross Income (AGI) in 2012: $42,361 (Individual Income Tax Returns)
Here:
$42,361
State:
$68,058
Salary/wage: $35,130 (reported on 84.8% of returns)
Here:
$35,130
State:
$55,396
(% of AGI for various income ranges: 71.5% for AGIs below $25k, 74.4% for AGIs $25k-50k, 82.4% for AGIs $50k-75k, 65.4% for AGIs $75k-100k, 59.2% for AGIs $100k-200k)
Taxable interest for individuals: $1,017 (reported on 27.3% of returns)
This zip code:
$1,017
Illinois:
$1,969
(% of AGI for various income ranges: 0.8% for AGIs below $25k, 1.2% for AGIs $25k-50k, 0.4% for AGIs $50k-75k, 0.7% for AGIs $100k-200k)
Ordinary dividends: $1,558 (reported on 18.2% of returns)
Here:
$1,558
State:
$7,786
(% of AGI for various income ranges: 1.0% for AGIs below $25k, 0.4% for AGIs $25k-50k, 0.9% for AGIs $50k-75k, 1.0% for AGIs $100k-200k)
Profit/loss from business: +$9,243 (reported on 10.6% of returns)
Here:
+$9,243
State:
+$12,903
Taxable individual retirement arrangement distribution: $7,400 (reported on 9.1% of returns)
62932:
$7,400
Illinois:
$17,929
Total itemized deductions: $21,000 (23% of AGI, reported on 13.6% of returns)
Here:
$21,000
State:
$26,433
Here:
23.1% of AGI
State:
19.2% of AGI
(% of AGI for various income ranges: 9.1% for AGIs below $25k, 11.4% for AGIs $50k-75k, 11.0% for AGIs $100k-200k)
Charity contributions: $3,850 (reported on 9.1% of returns)
Here:
$3,850
State:
$4,525
Taxes paid: $8,378 (reported on 13.6% of returns)
62932:
$8,378
State:
$11,968
(% of AGI for various income ranges: 1.4% for AGIs below $25k, 3.5% for AGIs $50k-75k, 6.3% for AGIs $100k-200k)
Earned income credit: $2,200 (reported on 25.8% of returns)
Here:
$2,200
State:
$2,349
(% of AGI for various income ranges: 7.1% for AGIs below $25k, 1.8% for AGIs $25k-50k)
Percentage of individuals using paid preparers for their 2012 taxes: 60.6%
Here:
61%
State:
57%
(% for various income ranges: 57.1% for AGIs below $25k, 61.1% for AGIs $25k-50k, 60.0% for AGIs $50k-75k, 60.0% for AGIs $75k-100k, 80.0% for AGIs $100k-200k)
Averages for the 2004 tax year for zip code 62932, filed in 2005:
Average Adjusted Gross Income (AGI) in 2004: $31,481 (Individual Income Tax Returns)
Here:
$31,481
State:
$54,625
Salary/wage: $27,434 (reported on 85.2% of returns)
Here:
$27,434
State:
$46,811
(% of AGI for various income ranges: 104.0% for AGIs below $10k, 75.7% for AGIs $10k-25k, 79.1% for AGIs $25k-50k, 80.5% for AGIs $50k-75k, 75.2% for AGIs $75k-100k, 40.7% for AGIs over 100k)
Taxable interest for individuals: $1,229 (reported on 36.4% of returns)
This zip code:
$1,229
Illinois:
$2,101
(% of AGI for various income ranges: 5.0% for AGIs below $10k, 2.5% for AGIs $10k-25k, 1.4% for AGIs $25k-50k, 0.4% for AGIs $50k-75k, 1.0% for AGIs $75k-100k, 1.5% for AGIs over 100k)
Taxable dividends: $1,024 (reported on 18.1% of returns)
Here:
$1,024
State:
$4,306
(% of AGI for various income ranges: 0.8% for AGIs below $10k, 0.7% for AGIs $10k-25k, 1.0% for AGIs $25k-50k, 0.2% for AGIs $50k-75k, 0.5% for AGIs $75k-100k)
Profit/loss from business: +$1,904 (reported on 10.5% of returns)
Here:
+$1,904
State:
+$11,771
Profit/loss from farming: +$2,667 (reported on 1.7% of returns)
Here:
+$2,667
State:
+$2,327
IRA payment deduction: $2,100 (reported on 1.4% of returns)
62932:
$2,100
Illinois:
$3,087
Total itemized deductions: $14,506 (25% of AGI, reported on 12.5% of returns)
Here:
$14,506
State:
$20,239
Here:
24.8% of AGI
State:
19.5% of AGI
(% of AGI for various income ranges: 4.2% for AGIs $10k-25k, 6.0% for AGIs $25k-50k, 6.3% for AGIs $50k-75k, 4.7% for AGIs $75k-100k, 8.9% for AGIs over 100k)
Charity contributions deductions: $2,119 (4% of AGI, reported on 9.6% of returns)
Here:
$2,119
State:
$3,719
Here:
3.7% of AGI
State:
3.4% of AGI
Total tax: $3,756 (reported on 68.9% of returns)
62932:
$3,756
State:
$9,882
(% of AGI for various income ranges: 2.1% for AGIs below $10k, 3.4% for AGIs $10k-25k, 6.1% for AGIs $25k-50k, 9.0% for AGIs $50k-75k, 11.1% for AGIs $75k-100k, 17.1% for AGIs over 100k)
Earned income credit: $2,026 (reported on 21.7% of returns)
Here:
$2,026
State:
$1,788
Percentage of individuals using paid preparers for their 2004 taxes: 65.9%
Here:
66%
State:
61%
(% for various income ranges: 61.2% for AGIs below $10k, 65.4% for AGIs $10k-25k, 66.2% for AGIs $25k-50k, 62.3% for AGIs $50k-75k, 80.6% for AGIs $75k-100k, 90.0% for AGIs over 100k)
Likely homosexual households (counted as self-reported same-sex unmarried-partner households)
Lesbian couples: 0.0% of all households
Gay men: 0.2% of all households
Household received Food Stamps/SNAP in the past 12 months: 113 Household did not receive Food Stamps/SNAP in the past 12 months: 419
Women who had a birth in the past 12 months: 22 (15 now married, 6 unmarried) Women who did not have a birth in the past 12 months: 218 (129 now married, 87 unmarried)
Housing units in zip code 62932 with a mortgage: 141 (15 second mortgage, 12 both second mortgage and home equity loan) Median monthly owner costs for units with a mortgage: $1,092 Median monthly owner costs for units without a mortgage: $440
Residents with income below the poverty level in 2022:
This zip code:
18.1%
Whole state:
11.9%
Residents with income below 50% of the poverty level in 2022:
This zip code:
9.1%
Whole state:
5.7%
Median number of rooms in houses and condos:
Here:
5.8
State:
6.4
Median number of rooms in apartments:
Here:
4.6
State:
4.1
Notable locations in this zip code not listed on our city pages
Cemeteries: Greer Cemetery (1), Elkville Cemetery (2), Rees Cemetery (3), Davis Cemetery (4), Russian Orthodox Cemetery (5), Gill Cemetery (6), Dutch Hill Cemetery (7). Display/hide their locations on the map
Lakes and reservoirs: Fox Lake (A), Snider Lake (B), Campbell Lake (C), Elkville Reservoir (D), Elkville Country Club Reservoir (E). Display/hide their locations on the map
Size of family households: 188 2-persons, 46 3-persons, 45 4-persons, 34 5-persons, 11 7-or-more-persons
Size of nonfamily households: 143 1-person, 56 2-persons, 3 4-persons
186 married couples with children.
69 single-parent households (35 men, 34 women).
92.1% of residents of 62932 zip code speak English at home.
6.5% of residents speak Spanish at home (59% very well, 8% well, 21% not well, 12% not at all).
1.2% of residents speak other Indo-European language at home (100% very well).
Foreign born population: 35 (2.9%) (48.8% of them are naturalized citizens)
This zip code:
2.9%
Whole state:
14.4%
83%Honduras
14%Greece
26%American
9%Italian
7%German
6%English
6%European
3%French
1%Irish
Year of entry for the foreign-born population
02010 or later
82000 to 2009
221990 to 1999
13Before 1990
Facilities with environmental interests located in this zip code:
ILLINI ENERGY-BURNING STAR 1 (2329 TRAUX TRAER ROAD in ELKVILLE, IL)
STATE MASTER (Illinois EPA Project) - National Pollutant Discharge Elimination System Permit National Pollutant Discharge Elimination System NON-MAJOR (Tracking pollutant discharge elimination systems) - permit Business SIC classification: BITUMINOUS COAL AND LIGNITE SURFACE MINING Alternative names: ILLINI ENERGY RESOURCES, LLC
CO-REC INC (R R in ELKVILLE, IL)
STATE MASTER (Illinois EPA Project) - AIR PROGRAM AIR MINOR (AIRS/AFS) Business SIC classification: NONCLASSIFIABLE ESTABLISHMENTS
S COAL COMPANY-ELKVILLE MINE 1 (SOUTHWEST OF in ELKVILLE, IL)
National Pollutant Discharge Elimination System NON-MAJOR (Tracking pollutant discharge elimination systems) - permit Business SIC classification: BITUMINOUS COAL AND LIGNITE SURFACE MINING Alternative names: S COAL-ELKVILLE MINE 1
GOSPEL ASSEMBLY SCHOOL (6TH AND KIMMEL in ELKVILLE, IL)
COMPLIANCE ACTIVITY (Tracking inspections of insecticide, fungicide, and rodenticide, and toxic substances)
Housing units lacking complete plumbing facilities: 10.8% Housing units lacking complete kitchen facilities: 6.2%
46.6%Electricity
42.9%Utility gas
9.5%Bottled, tank, or LP gas
1.4%Wood
Population in 1990: 2,091.
Place of birth for U.S.-born residents:
This state: 978
Northeast: 7
Midwest: 121
South: 51
West: 12
65% of the 62932 zip code residents lived in the same house 5 years ago. Out of people who lived in different houses, 57% lived in this county. Out of people who lived in different counties, 50% lived in Illinois.
87% of the 62932 zip code residents lived in the same house 1 year ago. Out of people who lived in different houses, 33% moved from this county. Out of people who lived in different houses, 67% moved from different county within same state. Out of people who lived in different houses, 2% moved from different state.
Private vs. public school enrollment:
Students in private schools in grades 1 to 8 (elementary and middle school): 15
Here:
12.7%
Illinois:
13.3%
Students in private schools in grades 9 to 12 (high school): 7
Here:
12.6%
Illinois:
9.9%
Students in private undergraduate colleges:
Here:
0.0%
Illinois:
27.4%
Occupation by median earnings in the past 12 months ($)
75,695Law enforcement workers including supervisors
56,554Production occupations
40,976Building and grounds cleaning and maintenance occupations
40,406Education, training, and library occupations
37,623Healthcare support occupations
37,149Installation, maintenance, and repair occupations
Top industries in this zip code by the number of employees in 2005:
Educational Services: All Other Miscellaneous Schools and Instruction (10-19 employees: 1 establishment)
Other Services (except Public Administration): Religious Organizations (5-9: 1, 1-4: 1)
Finance and Insurance: Commercial Banking (5-9: 1)
Other Services (except Public Administration): Reupholstery and Furniture Repair (1-4: 1)
Real Estate and Rental and Leasing: Lessors of Residential Buildings and Dwellings (1-4: 1)
Construction: Residential Remodelers (1-4: 1)
People in group quarters in 2000:
13 people in college dormitories (includes college quarters off campus)
2002 - 2018 National Fire Incident Reporting System (NFIRS) incidents
Based on the data from the years 2002 - 2018 the average number of fires per year is 7. The highest number of fire incidents - 21 took place in 2010, and the least - 0 in 2016. The data has a growing trend.
When looking into fire subcategories, the most incidents belonged to: Structure Fires (37.1%), and Outside Fires (35.5%).
Fire incident types reported to NFIRS in Zip Code 62932


 Nearest zip codes: 62927, 62924, 62983, 62949, 62832, 62994.


 Based on the data from the years 2002 - 2018 the average number of fires per year is 7. The highest number of fire incidents - 21 took place in 2010, and the least - 0 in 2016. The data has a growing trend.
 When looking into fire subcategories, the most incidents belonged to: Structure Fires (37.1%), and Outside Fires (35.5%).