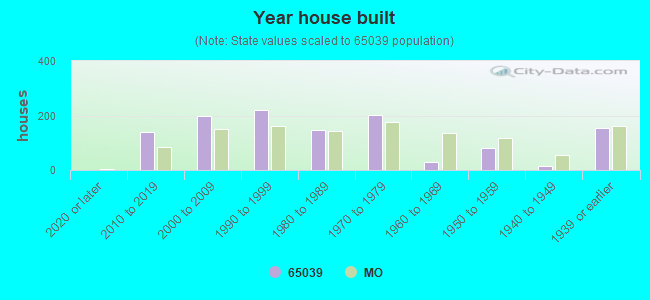
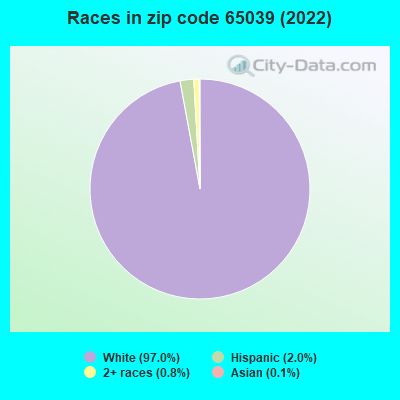
Estimated zip code population in 2022: 2,877 Zip code population in 2010: 2,328 Zip code population in 2000: 2,156
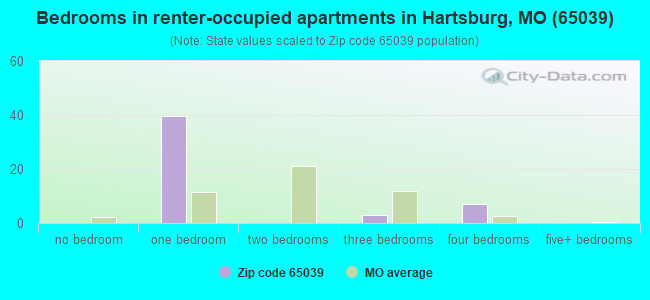
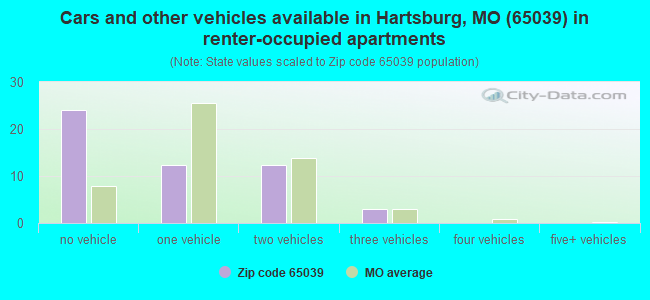
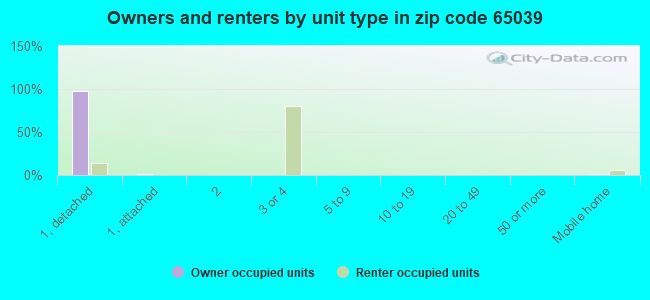
Houses and condos: 1,193 Renter-occupied apartments: 51
% of renters here:
5%
State:
32%
March 2022 cost of living index in zip code 65039: 75.6 (low, U.S. average is 100)
Land area: 59.0 sq. mi. Water area: 1.6 sq. mi.
Population density: 49 people per square mile
(very low).
OSM Map
General Map
Google Map
MSN Map
OSM Map
General Map
Google Map
MSN Map
OSM Map
General Map
Google Map
MSN Map
OSM Map
General Map
Google Map
MSN Map
Please wait while loading the map...
Real estate property taxes paid for housing units in 2022:
This zip code:
0.5% ($2,077)
Missouri:
0.8% ($1,810)
Median real estate property taxes paid for housing units with mortgages in 2022: $1,879 (0.5%) Median real estate property taxes paid for housing units with no mortgage in 2022: $2,469 (0.6%)
Business Search- 14 Million verified businesses
Males: 1,563
(54.3%)
Females: 1,313
(45.7%)
For population 25 years and over in 65039:
High school or higher: 96.5%
Bachelor's degree or higher: 54.9%
Graduate or professional degree: 27.2%
Unemployed: 3.1%
Mean travel time to work (commute): 25.0 minutes
For population 15 years and over in 65039:
Never married: 16.5%
Now married: 76.8%
Separated: 0.0%
Widowed: 1.5%
Divorced: 5.3%
Zip code 65039 compared to state average:
Median household income above state average.
Median house value above state average.
Black race population percentage significantly below state average.
Hispanic race population percentage below state average.
Foreign-born population percentage significantly below state average.
Renting percentage significantly below state average.
Length of stay since moving in significantly above state average.
Number of rooms per house above state average.
Number of college students significantly below state average.
Percentage of population with a bachelor's degree or higher above state average.
Estimated median house/condo value in 2022: $419,659
65039:
$419,659
Missouri:
$221,200
According to our research of Missouri and other state lists, there were 5 registered sex offenders living in 65039 zip code as of May 15, 2024. The ratio of all residents to sex offenders in zip code 65039 is 497 to 1. The ratio of registered sex offenders to all residents in this zip code is lower than the state average.
Median resident age:
This zip code:
41.5 years
Missouri median age:
39.1 years
Average household size:
This zip code:
2.5 people
Missouri:
2.4 people
Averages for the 2020 tax year for zip code 65039, filed in 2021:
Average Adjusted Gross Income (AGI) in 2020: $87,229 (Individual Income Tax Returns)
Here:
$87,229
State:
$68,151
Salary/wage: $73,930 (reported on 78.8% of returns)
Here:
$73,930
State:
$56,131
(% of AGI for various income ranges: 1150.5% for AGIs below $25k, 3453.3% for AGIs $25k-50k, 6539.0% for AGIs $50k-75k, 8948.9% for AGIs $75k-100k, 18053.8% for AGIs $100k-200k, 59316.7% for AGIs over 200k)
Taxable interest for individuals: $1,204 (reported on 39.8% of returns)
This zip code:
$1,204
Missouri:
$1,586
(% of AGI for various income ranges: 13.0% for AGIs below $25k, 28.7% for AGIs $25k-50k, 96.0% for AGIs $50k-75k, 70.0% for AGIs $75k-100k, 135.6% for AGIs $100k-200k, 403.3% for AGIs over 200k)
Ordinary dividends: $3,706 (reported on 30.5% of returns)
Here:
$3,706
State:
$10,947
(% of AGI for various income ranges: 19.0% for AGIs below $25k, 71.3% for AGIs $25k-50k, 207.0% for AGIs $50k-75k, 163.3% for AGIs $75k-100k, 263.1% for AGIs $100k-200k, 1380.0% for AGIs over 200k)
Net capital gain/loss in AGI: +$13,842 (reported on 26.3% of returns)
Here:
+$13,842
State:
+$18,453
(% of AGI for various income ranges: 4.0% for AGIs below $25k, 58.7% for AGIs $25k-50k, 60.0% for AGIs $50k-75k, 234.4% for AGIs $75k-100k, 590.6% for AGIs $100k-200k, 9930.0% for AGIs over 200k)
Profit/loss from business: +$10,610 (reported on 17.8% of returns)
Here:
+$10,610
State:
+$12,260
(% of AGI for various income ranges: 159.5% for AGIs below $25k, 94.7% for AGIs $25k-50k, 267.0% for AGIs $50k-75k, 112.2% for AGIs $75k-100k, 265.6% for AGIs $100k-200k, 3246.7% for AGIs over 200k)
Taxable individual retirement arrangement distribution: $16,527 (reported on 12.7% of returns)
65039:
$16,527
Missouri:
$19,719
(% of AGI for various income ranges: 63.0% for AGIs below $25k, 222.7% for AGIs $25k-50k, 296.0% for AGIs $50k-75k, 438.9% for AGIs $75k-100k, 830.0% for AGIs $100k-200k)
Total itemized deductions: $33,378 (reported on 7.6% of returns)
Here:
$33,378
State:
$36,651
(% of AGI for various income ranges: 786.0% for AGIs $50k-75k, 590.6% for AGIs $100k-200k, 4243.3% for AGIs over 200k)
Charity contributions: $10,675 (reported on 6.8% of returns)
Here:
$10,675
State:
$15,671
(% of AGI for various income ranges: 39.5% for AGIs below $25k, 141.2% for AGIs $100k-200k, 1830.0% for AGIs over 200k)
Taxes paid: $8,356 (reported on 7.6% of returns)
65039:
$8,356
State:
$7,608
(% of AGI for various income ranges: 174.0% for AGIs $50k-75k, 173.1% for AGIs $100k-200k, 1003.3% for AGIs over 200k)
Earned income credit: $1,773 (reported on 9.3% of returns)
Here:
$1,773
State:
$2,315
(% of AGI for various income ranges: 58.0% for AGIs below $25k, 52.7% for AGIs $25k-50k)
Percentage of individuals using paid preparers for their 2020 taxes: 93.2%
Here:
93%
State:
93%
(% for various income ranges: 90.3% for AGIs below $25k, 90.5% for AGIs $25k-50k, 93.3% for AGIs $50k-75k, 93.3% for AGIs $75k-100k, 96.4% for AGIs $100k-200k, 100.0% for AGIs over 200k)
Averages for the 2012 tax year for zip code 65039, filed in 2013:
Average Adjusted Gross Income (AGI) in 2012: $70,425 (Individual Income Tax Returns)
Here:
$70,425
State:
$55,896
Salary/wage: $57,185 (reported on 83.7% of returns)
Here:
$57,185
State:
$46,205
(% of AGI for various income ranges: 72.3% for AGIs below $25k, 75.2% for AGIs $25k-50k, 76.3% for AGIs $50k-75k, 74.7% for AGIs $75k-100k, 71.0% for AGIs $100k-200k, 50.0% for AGIs over 200k)
Taxable interest for individuals: $756 (reported on 50.0% of returns)
This zip code:
$756
Missouri:
$1,559
(% of AGI for various income ranges: 1.3% for AGIs below $25k, 0.5% for AGIs $25k-50k, 0.4% for AGIs $50k-75k, 0.7% for AGIs $75k-100k, 0.7% for AGIs $100k-200k, 0.1% for AGIs over 200k)
Ordinary dividends: $2,559 (reported on 27.9% of returns)
Here:
$2,559
State:
$7,410
(% of AGI for various income ranges: 1.4% for AGIs below $25k, 0.5% for AGIs $25k-50k, 1.3% for AGIs $50k-75k, 0.9% for AGIs $75k-100k, 1.3% for AGIs $100k-200k, 0.6% for AGIs over 200k)
Net capital gain/loss in AGI: +$6,117 (reported on 22.1% of returns)
Here:
+$6,117
State:
+$11,579
(% of AGI for various income ranges: 0.5% for AGIs below $25k, 0.2% for AGIs $50k-75k, 0.7% for AGIs $75k-100k, 2.1% for AGIs $100k-200k, 4.8% for AGIs over 200k)
Profit/loss from business: +$9,361 (reported on 17.3% of returns)
Here:
+$9,361
State:
+$11,688
(% of AGI for various income ranges: 7.5% for AGIs below $25k, 4.1% for AGIs $25k-50k, 0.9% for AGIs $50k-75k, 3.3% for AGIs $75k-100k, 2.7% for AGIs $100k-200k)
Taxable individual retirement arrangement distribution: $9,058 (reported on 11.5% of returns)
65039:
$9,058
Missouri:
$14,773
(% of AGI for various income ranges: 3.4% for AGIs $25k-50k, 2.2% for AGIs $50k-75k, 2.2% for AGIs $75k-100k, 1.6% for AGIs $100k-200k)
Total itemized deductions: $22,016 (18% of AGI, reported on 36.5% of returns)
Here:
$22,016
State:
$22,730
Here:
17.6% of AGI
State:
19.2% of AGI
(% of AGI for various income ranges: 7.2% for AGIs below $25k, 9.6% for AGIs $25k-50k, 10.3% for AGIs $50k-75k, 12.1% for AGIs $75k-100k, 14.5% for AGIs $100k-200k, 9.3% for AGIs over 200k)
Charity contributions: $3,948 (reported on 29.8% of returns)
Here:
$3,948
State:
$4,745
(% of AGI for various income ranges: 1.2% for AGIs $25k-50k, 1.6% for AGIs $50k-75k, 1.8% for AGIs $75k-100k, 2.6% for AGIs $100k-200k, 1.0% for AGIs over 200k)
Taxes paid: $8,376 (reported on 36.5% of returns)
65039:
$8,376
State:
$8,399
(% of AGI for various income ranges: 2.6% for AGIs $25k-50k, 2.9% for AGIs $50k-75k, 3.7% for AGIs $75k-100k, 5.3% for AGIs $100k-200k, 6.2% for AGIs over 200k)
Earned income credit: $1,736 (reported on 10.6% of returns)
Here:
$1,736
State:
$2,288
(% of AGI for various income ranges: 4.0% for AGIs below $25k, 0.4% for AGIs $25k-50k)
Percentage of individuals using paid preparers for their 2012 taxes: 52.9%
Here:
53%
State:
55%
(% for various income ranges: 41.2% for AGIs below $25k, 52.6% for AGIs $25k-50k, 58.8% for AGIs $50k-75k, 53.8% for AGIs $75k-100k, 64.7% for AGIs $100k-200k, 75.0% for AGIs over 200k)
Averages for the 2004 tax year for zip code 65039, filed in 2005:
Average Adjusted Gross Income (AGI) in 2004: $51,915 (Individual Income Tax Returns)
Here:
$51,915
State:
$44,591
Salary/wage: $46,813 (reported on 85.9% of returns)
Here:
$46,813
State:
$38,941
(% of AGI for various income ranges: 96.4% for AGIs below $10k, 76.1% for AGIs $10k-25k, 79.4% for AGIs $25k-50k, 82.4% for AGIs $50k-75k, 85.0% for AGIs $75k-100k, 67.7% for AGIs over 100k)
Taxable interest for individuals: $924 (reported on 59.2% of returns)
This zip code:
$924
Missouri:
$1,801
(% of AGI for various income ranges: 5.5% for AGIs below $10k, 2.7% for AGIs $10k-25k, 1.6% for AGIs $25k-50k, 0.9% for AGIs $50k-75k, 0.8% for AGIs $75k-100k, 0.6% for AGIs over 100k)
Taxable dividends: $1,245 (reported on 29.3% of returns)
Here:
$1,245
State:
$3,677
(% of AGI for various income ranges: 4.1% for AGIs below $10k, 1.5% for AGIs $10k-25k, 0.5% for AGIs $25k-50k, 0.7% for AGIs $50k-75k, 0.6% for AGIs $75k-100k, 0.6% for AGIs over 100k)
Net capital gain/loss: +$3,449 (reported on 19.7% of returns)
Here:
+$3,449
State:
+$8,915
(% of AGI for various income ranges: 2.9% for AGIs below $10k, -0.2% for AGIs $10k-25k, 0.2% for AGIs $25k-50k, 0.1% for AGIs $50k-75k, 0.7% for AGIs $75k-100k, 3.2% for AGIs over 100k)
Profit/loss from business: +$9,330 (reported on 19.0% of returns)
Here:
+$9,330
State:
+$9,793
(% of AGI for various income ranges: -4.1% for AGIs below $10k, 3.5% for AGIs $10k-25k, 5.6% for AGIs $25k-50k, 0.8% for AGIs $50k-75k, -0.1% for AGIs $75k-100k, 6.8% for AGIs over 100k)
IRA payment deduction: $2,913 (reported on 2.3% of returns)
65039:
$2,913
Missouri:
$2,972
Self-employed pension: $19,400 (reported on 1.0% of returns)
Here:
$19,400
Missouri:
$14,365
Total itemized deductions: $16,721 (19% of AGI, reported on 35.7% of returns)
Here:
$16,721
State:
$18,261
Here:
18.9% of AGI
State:
20.5% of AGI
(% of AGI for various income ranges: 9.4% for AGIs $10k-25k, 10.3% for AGIs $25k-50k, 11.8% for AGIs $50k-75k, 13.1% for AGIs $75k-100k, 11.7% for AGIs over 100k)
Charity contributions deductions: $2,875 (3% of AGI, reported on 30.3% of returns)
Here:
$2,875
State:
$3,665
Here:
3.1% of AGI
State:
3.9% of AGI
(% of AGI for various income ranges: 1.2% for AGIs $10k-25k, 1.5% for AGIs $25k-50k, 1.4% for AGIs $50k-75k, 2.0% for AGIs $75k-100k, 1.9% for AGIs over 100k)
Total tax: $7,460 (reported on 81.8% of returns)
65039:
$7,460
State:
$6,999
(% of AGI for various income ranges: 3.1% for AGIs below $10k, 4.3% for AGIs $10k-25k, 7.4% for AGIs $25k-50k, 7.8% for AGIs $50k-75k, 10.2% for AGIs $75k-100k, 19.1% for AGIs over 100k)
Earned income credit: $1,359 (reported on 7.8% of returns)
Here:
$1,359
State:
$1,728
Percentage of individuals using paid preparers for their 2004 taxes: 54.7%
Here:
55%
State:
62%
(% for various income ranges: 47.0% for AGIs below $10k, 51.2% for AGIs $10k-25k, 53.9% for AGIs $25k-50k, 56.6% for AGIs $50k-75k, 59.8% for AGIs $75k-100k, 67.0% for AGIs over 100k)
Household received Food Stamps/SNAP in the past 12 months: 28 Household did not receive Food Stamps/SNAP in the past 12 months: 1,101
Women who did not have a birth in the past 12 months: 731 (519 now married, 205 unmarried)
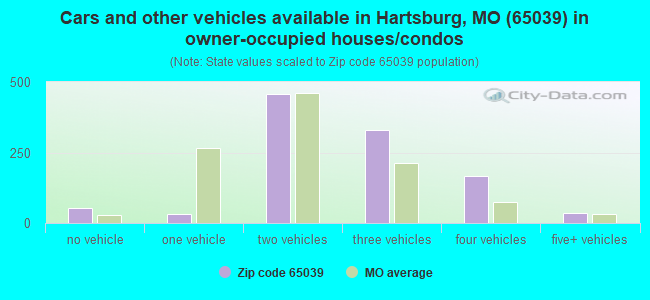
Housing units in zip code 65039 with a mortgage: 713 (127 second mortgage, 126 both second mortgage and home equity loan) Houses without a mortgage: 63
Median monthly owner costs for units with a mortgage: $1,803 Median monthly owner costs for units without a mortgage: $671
Residents with income below the poverty level in 2022:
This zip code:
4.3%
Whole state:
13.2%
Residents with income below 50% of the poverty level in 2022:
This zip code:
1.2%
Whole state:
6.8%
Median number of rooms in houses and condos:
Here:
7.5
State:
6.4
Median number of rooms in apartments:
Here:
3.4
State:
4.4
Notable locations in this zip code not listed on our city pages
Notable locations in zip code 65039: Southern Boone County Fire Protection District Station 18 (A), Southern Boone County Fire Protection District Station 20 (B). Display/hide their locations on the map
Churches in zip code 65039 include: Bonds Chapel (A), Mount Pleasant Church (B), Peace United Church of Christ (C), Hartsburg Baptist Church (D), New Liberty Church (E). Display/hide their locations on the map
Streams, rivers, and creeks: Glascock Branch (A), Hart Creek (B), Jemerson Creek (C), Slate Creek (D), Winterbows Branch (E), Bonne Femme Creek (F), Clifton Creek (G), Fox Hollow Branch (H). Display/hide their locations on the map
Size of family households: 539 2-persons, 66 3-persons, 197 4-persons, 104 5-persons
Size of nonfamily households: 168 1-person, 46 2-persons
622 married couples with children.
12 single-parent households (12 women).
97.6% of residents of 65039 zip code speak English at home.
1.6% of residents speak Spanish at home (100% very well).
0.5% of residents speak other Indo-European language at home (100% very well).
Foreign born population: 6 (0.2%) (43.1% of them are naturalized citizens)
This zip code:
0.2%
Whole state:
4.1%
67%Malaysia
50%France
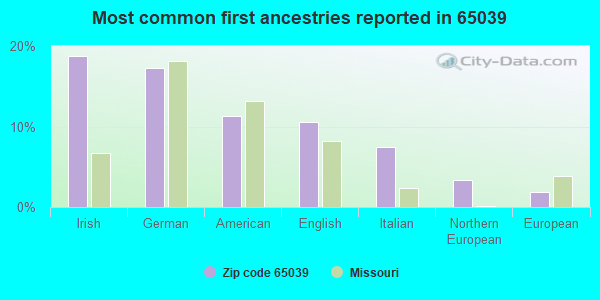
19%Irish
17%German
11%American
11%English
7%Italian
3%Northern European
2%European
Year of entry for the foreign-born population
42010 or later
02000 to 2009
01990 to 1999
5Before 1990
Facilities with environmental interests located in this zip code:
BCSD HARTSBURG WW SYSTEM (HARTSBURG in HARTSBURG, MO)
STATE MASTER (Missouri monitoring and compilance) - PCS-MO0108995, NPDES NON-MAJOR National Pollutant Discharge Elimination System NON-MAJOR (Tracking pollutant discharge elimination systems) - permit Business SIC classification: SEWERAGE SYSTEMS Organizations: BOONE CO REG SEWER DIST (CONTACT/OWNER)
, VILLAGE OF HARTSBURG (CONTACT/OWNER)
Alternative names: HARTSBURG, VILLAGE
BOONE CO REG SEW DIST (21445 MT PLEASANT RD in HARTSBURG, MO)
STATE MASTER (Missouri monitoring and compilance) - PCS-MO0117935, NPDES NON-MAJOR National Pollutant Discharge Elimination System NON-MAJOR (Tracking pollutant discharge elimination systems) - permit Business SIC classification: SEWERAGE SYSTEMS Alternative names: BCSD, EAGLE KNOLL
Housing units lacking complete plumbing facilities: 5.0% Housing units lacking complete kitchen facilities: 4.9%
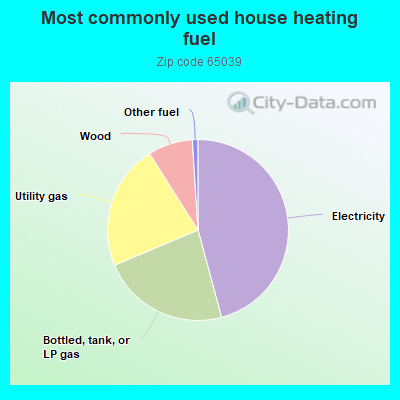
45.9%Electricity
22.9%Bottled, tank, or LP gas
22.4%Utility gas
8.0%Wood
1.0%Other fuel
Population in 1990: 1,945. Population change in the 1990s: +211 (+10.8%).
Place of birth for U.S.-born residents:
This state: 2,119
Northeast: 6
Midwest: 380
South: 166
West: 197
65% of the 65039 zip code residents lived in the same house 5 years ago. Out of people who lived in different houses, 62% lived in this county. Out of people who lived in different counties, 50% lived in Missouri.
98% of the 65039 zip code residents lived in the same house 1 year ago. Out of people who lived in different houses, 76% moved from this county. Out of people who lived in different houses, 35% moved from different county within same state. Out of people who lived in different houses, 11% moved from different state.
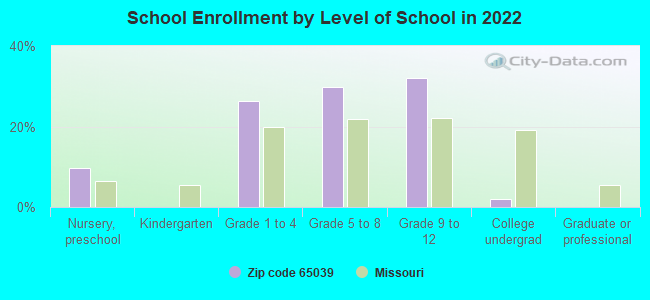
Private vs. public school enrollment:
Students in private schools in grades 1 to 8 (elementary and middle school): 33
Here:
8.8%
Missouri:
15.4%
Students in private schools in grades 9 to 12 (high school): 29
Here:
13.7%
Missouri:
13.9%
Students in private undergraduate colleges: 1
Here:
12.3%
Missouri:
22.6%
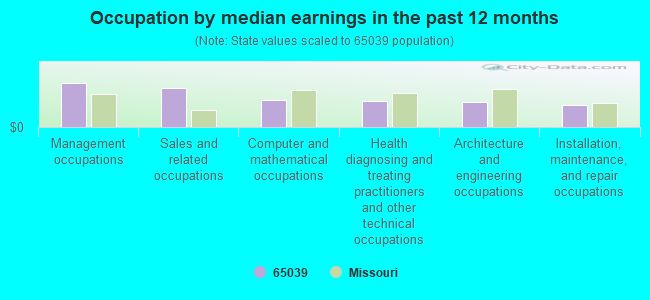
Occupation by median earnings in the past 12 months ($)
158,024Management occupations
138,461Sales and related occupations
96,435Computer and mathematical occupations
93,946Health diagnosing and treating practitioners and other technical occupations
90,065Architecture and engineering occupations
77,916Installation, maintenance, and repair occupations
Top industries in this zip code by the number of employees in 2005:
Construction: New Single-Family Housing Construction (except Operative Builders) (10-19 employees: 1 establishment, 5-9 employees: 2 establishments, 1-4 employees: 3 establishments)
Construction: Site Preparation Contractors (10-19: 1, 1-4: 2)
Construction: Painting and Wall Covering Contractors (10-19: 1, 1-4: 1)
Arts, Entertainment, and Recreation: Golf Courses and Country Clubs (10-19: 1)
Construction: Drywall and Insulation Contractors (5-9: 1, 1-4: 2)
Other Services (except Public Administration): Religious Organizations (5-9: 1, 1-4: 2)
Administrative and Support and Waste Management and Remediation Services: Carpet and Upholstery Cleaning Services (5-9: 1)
Health Care and Social Assistance: Offices of Physicians (except Mental Health Specialists) (5-9: 1)
Fatal accident statistics in 2014:
Fatal accident count: 1
Vehicles involved in fatal accidents: 2
Fatal accidents caused by drunken drivers: 0
Fatalities: 1
Persons involved in fatal accidents: 3
Pedestrians involved in fatal accidents: 0
Fatal accident statistics in 2012:
Fatal accident count: 1
Vehicles involved in fatal accidents: 1
Fatal accidents caused by drunken drivers: 0
Fatalities: 1
Persons involved in fatal accidents: 1
Pedestrians involved in fatal accidents: 0
Home Mortgage Disclosure Act Aggregated Statistics For Year 2009 (Based on 6 partial tracts)
A) FHA, FSA/RHS & VA Home Purchase Loans
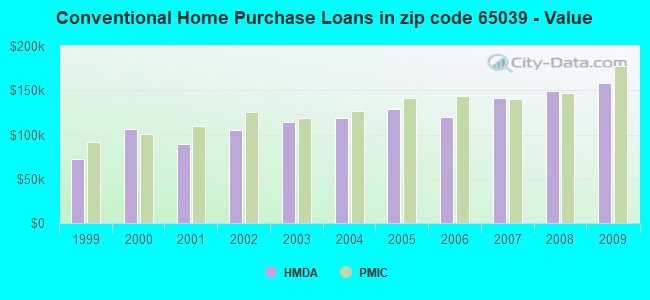
B) Conventional Home Purchase Loans
C) Refinancings
D) Home Improvement Loans
E) Loans on Dwellings For 5+ Families
F) Non-occupant Loans on < 5 Family Dwellings (A B C & D)
G) Loans On Manufactured Home Dwelling (A B C & D)
Number
Average Value
Number
Average Value
Number
Average Value
Number
Average Value
Number
Average Value
Number
Average Value
Number
Average Value
LOANS ORIGINATED
64
$145,705
73
$158,004
397
$151,868
23
$94,339
3
$136,120
24
$132,328
8
$65,808
APPLICATIONS APPROVED, NOT ACCEPTED
4
$119,602
7
$140,021
44
$158,068
2
$12,265
0
$0
3
$158,597
1
$10,820
APPLICATIONS DENIED
3
$158,573
10
$149,549
76
$176,689
8
$45,765
0
$0
3
$141,807
5
$28,678
APPLICATIONS WITHDRAWN
6
$143,513
10
$280,613
80
$159,020
4
$52,152
0
$0
3
$245,843
1
$38,780
FILES CLOSED FOR INCOMPLETENESS
1
$203,810
0
$0
13
$121,739
0
$0
0
$0
0
$0
1
$110,920
Aggregated Statistics For Year 2008 (Based on 6 partial tracts)
A) FHA, FSA/RHS & VA Home Purchase Loans
B) Conventional Home Purchase Loans
C) Refinancings
D) Home Improvement Loans
F) Non-occupant Loans on < 5 Family Dwellings (A B C & D)
G) Loans On Manufactured Home Dwelling (A B C & D)
Number
Average Value
Number
Average Value
Number
Average Value
Number
Average Value
Number
Average Value
Number
Average Value
LOANS ORIGINATED
44
$144,141
119
$149,044
180
$135,800
41
$56,335
36
$126,992
8
$46,712
APPLICATIONS APPROVED, NOT ACCEPTED
1
$153,170
10
$125,294
24
$122,088
0
$0
3
$80,260
2
$79,200
APPLICATIONS DENIED
5
$141,940
16
$113,235
53
$137,860
11
$75,125
6
$89,917
9
$86,102
APPLICATIONS WITHDRAWN
1
$191,920
17
$145,422
57
$169,145
2
$136,545
3
$135,870
1
$127,480
FILES CLOSED FOR INCOMPLETENESS
1
$126,240
1
$146,110
9
$179,984
1
$120,840
1
$120,840
0
$0
Aggregated Statistics For Year 2007 (Based on 6 partial tracts)
A) FHA, FSA/RHS & VA Home Purchase Loans
B) Conventional Home Purchase Loans
C) Refinancings
D) Home Improvement Loans
E) Loans on Dwellings For 5+ Families
F) Non-occupant Loans on < 5 Family Dwellings (A B C & D)
G) Loans On Manufactured Home Dwelling (A B C & D)
Number
Average Value
Number
Average Value
Number
Average Value
Number
Average Value
Number
Average Value
Number
Average Value
Number
Average Value
LOANS ORIGINATED
13
$136,008
154
$141,206
157
$140,953
33
$49,961
1
$223,090
33
$151,328
5
$52,576
APPLICATIONS APPROVED, NOT ACCEPTED
0
$0
18
$123,122
20
$147,572
1
$51,800
0
$0
1
$107,400
2
$35,325
APPLICATIONS DENIED
1
$150,410
22
$108,205
63
$123,392
10
$71,881
0
$0
7
$98,443
7
$74,854
APPLICATIONS WITHDRAWN
3
$159,920
11
$111,088
46
$157,674
0
$0
0
$0
4
$117,165
0
$0
FILES CLOSED FOR INCOMPLETENESS
0
$0
2
$172,680
12
$124,315
0
$0
0
$0
2
$121,970
0
$0
Aggregated Statistics For Year 2006 (Based on 6 partial tracts)
A) FHA, FSA/RHS & VA Home Purchase Loans
B) Conventional Home Purchase Loans
C) Refinancings
D) Home Improvement Loans
F) Non-occupant Loans on < 5 Family Dwellings (A B C & D)
G) Loans On Manufactured Home Dwelling (A B C & D)
Number
Average Value
Number
Average Value
Number
Average Value
Number
Average Value
Number
Average Value
Number
Average Value
LOANS ORIGINATED
24
$128,510
183
$119,390
170
$116,922
23
$40,404
43
$119,631
12
$58,276
APPLICATIONS APPROVED, NOT ACCEPTED
2
$153,105
19
$112,374
24
$127,825
1
$8,290
3
$108,053
1
$18,020
APPLICATIONS DENIED
3
$138,417
30
$85,719
86
$122,855
9
$53,508
4
$95,865
11
$52,115
APPLICATIONS WITHDRAWN
4
$123,290
28
$121,962
74
$136,909
6
$66,943
3
$173,860
3
$42,773
FILES CLOSED FOR INCOMPLETENESS
0
$0
3
$123,473
15
$125,752
0
$0
0
$0
0
$0
Aggregated Statistics For Year 2005 (Based on 6 partial tracts)
A) FHA, FSA/RHS & VA Home Purchase Loans
B) Conventional Home Purchase Loans
C) Refinancings
D) Home Improvement Loans
F) Non-occupant Loans on < 5 Family Dwellings (A B C & D)
G) Loans On Manufactured Home Dwelling (A B C & D)
Number
Average Value
Number
Average Value
Number
Average Value
Number
Average Value
Number
Average Value
Number
Average Value
LOANS ORIGINATED
16
$131,466
188
$128,637
198
$127,113
23
$66,844
31
$138,587
12
$50,356
APPLICATIONS APPROVED, NOT ACCEPTED
0
$0
18
$105,275
19
$123,081
2
$51,220
2
$119,780
3
$47,750
APPLICATIONS DENIED
3
$84,233
28
$78,843
118
$129,055
16
$37,659
4
$99,732
18
$67,283
APPLICATIONS WITHDRAWN
1
$122,070
22
$149,382
70
$124,202
6
$69,803
5
$98,162
0
$0
FILES CLOSED FOR INCOMPLETENESS
0
$0
4
$86,855
8
$97,211
2
$40,285
1
$57,300
0
$0
Aggregated Statistics For Year 2004 (Based on 6 partial tracts)
A) FHA, FSA/RHS & VA Home Purchase Loans
B) Conventional Home Purchase Loans
C) Refinancings
D) Home Improvement Loans
F) Non-occupant Loans on < 5 Family Dwellings (A B C & D)
G) Loans On Manufactured Home Dwelling (A B C & D)
Number
Average Value
Number
Average Value
Number
Average Value
Number
Average Value
Number
Average Value
Number
Average Value
LOANS ORIGINATED
26
$113,444
178
$118,797
178
$132,653
23
$49,963
34
$103,220
17
$54,241
APPLICATIONS APPROVED, NOT ACCEPTED
1
$125,350
21
$94,030
29
$109,142
2
$83,545
2
$71,470
2
$40,785
APPLICATIONS DENIED
5
$98,572
38
$89,540
84
$110,162
10
$27,334
6
$141,162
25
$49,602
APPLICATIONS WITHDRAWN
3
$106,527
18
$114,382
66
$122,334
3
$31,337
5
$106,624
3
$75,150
FILES CLOSED FOR INCOMPLETENESS
0
$0
1
$148,590
14
$140,543
3
$92,607
0
$0
1
$87,470
Aggregated Statistics For Year 2003 (Based on 4 partial tracts)
A) FHA, FSA/RHS & VA Home Purchase Loans
B) Conventional Home Purchase Loans
C) Refinancings
D) Home Improvement Loans
F) Non-occupant Loans on < 5 Family Dwellings (A B C & D)
Number
Average Value
Number
Average Value
Number
Average Value
Number
Average Value
Number
Average Value
LOANS ORIGINATED
20
$104,543
120
$113,889
410
$120,490
12
$34,372
21
$85,848
APPLICATIONS APPROVED, NOT ACCEPTED
0
$0
12
$85,214
30
$116,963
2
$26,695
1
$102,960
APPLICATIONS DENIED
3
$108,073
14
$88,410
77
$100,507
5
$17,110
3
$73,477
APPLICATIONS WITHDRAWN
3
$109,943
14
$125,187
62
$116,609
2
$22,665
4
$124,675
FILES CLOSED FOR INCOMPLETENESS
1
$74,290
2
$93,785
5
$94,622
0
$0
0
$0
Aggregated Statistics For Year 2002 (Based on 4 partial tracts)
A) FHA, FSA/RHS & VA Home Purchase Loans
B) Conventional Home Purchase Loans
C) Refinancings
D) Home Improvement Loans
F) Non-occupant Loans on < 5 Family Dwellings (A B C & D)
Number
Average Value
Number
Average Value
Number
Average Value
Number
Average Value
Number
Average Value
LOANS ORIGINATED
13
$97,866
82
$105,479
315
$119,269
6
$9,940
17
$86,426
APPLICATIONS APPROVED, NOT ACCEPTED
1
$75,750
8
$58,349
21
$112,177
0
$0
3
$58,770
APPLICATIONS DENIED
5
$114,528
18
$58,815
49
$94,419
2
$22,995
2
$69,775
APPLICATIONS WITHDRAWN
5
$102,806
8
$93,306
60
$105,501
1
$7,210
0
$0
FILES CLOSED FOR INCOMPLETENESS
2
$106,730
3
$94,997
11
$93,347
0
$0
0
$0
Aggregated Statistics For Year 2001 (Based on 4 partial tracts)
A) FHA, FSA/RHS & VA Home Purchase Loans
B) Conventional Home Purchase Loans
C) Refinancings
D) Home Improvement Loans
F) Non-occupant Loans on < 5 Family Dwellings (A B C & D)
Number
Average Value
Number
Average Value
Number
Average Value
Number
Average Value
Number
Average Value
LOANS ORIGINATED
14
$91,432
82
$89,303
224
$109,407
11
$22,771
10
$79,214
APPLICATIONS APPROVED, NOT ACCEPTED
0
$0
11
$57,605
22
$105,878
2
$4,700
4
$60,420
APPLICATIONS DENIED
3
$68,537
29
$41,405
52
$90,843
6
$15,708
1
$136,620
APPLICATIONS WITHDRAWN
4
$57,040
5
$95,716
41
$91,612
0
$0
0
$0
FILES CLOSED FOR INCOMPLETENESS
0
$0
3
$96,493
8
$119,181
0
$0
0
$0
Aggregated Statistics For Year 2000 (Based on 4 partial tracts)
A) FHA, FSA/RHS & VA Home Purchase Loans
B) Conventional Home Purchase Loans
C) Refinancings
D) Home Improvement Loans
E) Loans on Dwellings For 5+ Families
F) Non-occupant Loans on < 5 Family Dwellings (A B C & D)
Number
Average Value
Number
Average Value
Number
Average Value
Number
Average Value
Number
Average Value
Number
Average Value
LOANS ORIGINATED
17
$94,861
93
$106,408
88
$86,311
16
$18,169
1
$97,390
12
$156,923
APPLICATIONS APPROVED, NOT ACCEPTED
1
$30,660
10
$60,853
16
$68,999
7
$9,914
0
$0
0
$0
APPLICATIONS DENIED
3
$91,393
38
$54,354
36
$71,162
6
$29,537
0
$0
3
$38,830
APPLICATIONS WITHDRAWN
2
$98,075
6
$143,837
16
$93,946
3
$70,087
0
$0
1
$180,910
FILES CLOSED FOR INCOMPLETENESS
0
$0
3
$93,123
2
$79,810
0
$0
0
$0
1
$84,770
Aggregated Statistics For Year 1999 (Based on 2 partial tracts)
A) FHA, FSA/RHS & VA Home Purchase Loans
B) Conventional Home Purchase Loans
C) Refinancings
D) Home Improvement Loans
F) Non-occupant Loans on < 5 Family Dwellings (A B C & D)


 Nearest zip codes: 65010, 65023, 65109, 65201, 65203, 65053.