Estimated zip code population in 2022: 2,718 Zip code population in 2010: 2,860 Zip code population in 2000: 2,806
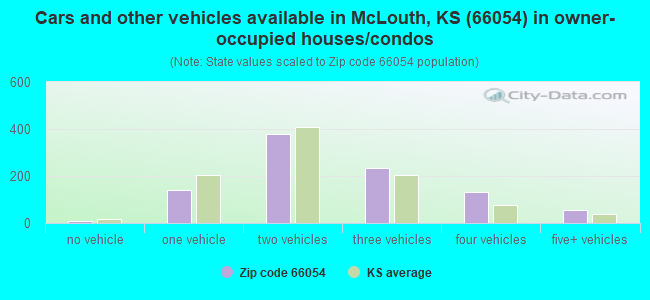
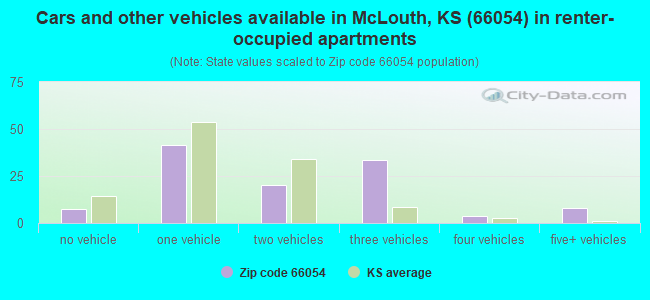
Houses and condos: 1,207 Renter-occupied apartments: 115
% of renters here:
11%
State:
32%
March 2022 cost of living index in zip code 66054: 79.7 (low, U.S. average is 100)
Land area: 76.0 sq. mi. Water area: 0.8 sq. mi.
Population density: 36 people per square mile
(very low).
OSM Map
General Map
Google Map
MSN Map
OSM Map
General Map
Google Map
MSN Map
OSM Map
General Map
Google Map
MSN Map
OSM Map
General Map
Google Map
MSN Map
Please wait while loading the map...
Real estate property taxes paid for housing units in 2022:
This zip code:
1.2% ($2,727)
Kansas:
1.2% ($2,578)
Median real estate property taxes paid for housing units with mortgages in 2022: $2,687 (1.3%) Median real estate property taxes paid for housing units with no mortgage in 2022: $2,750 (1.1%)
Business Search- 14 Million verified businesses
Males: 1,361
(50.1%)
Females: 1,356
(49.9%)
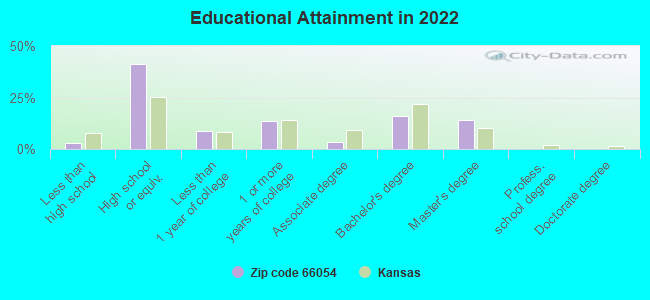
For population 25 years and over in 66054:
High school or higher: 96.4%
Bachelor's degree or higher: 29.9%
Graduate or professional degree: 14.0%
Unemployed: 2.4%
Mean travel time to work (commute): 41.4 minutes
For population 15 years and over in 66054:
Never married: 17.8%
Now married: 61.5%
Separated: 0.2%
Widowed: 8.3%
Divorced: 12.2%
Zip code 66054 compared to state average:
Black race population percentage significantly below state average.
Hispanic race population percentage significantly below state average.
Median age above state average.
Foreign-born population percentage significantly below state average.
Renting percentage significantly below state average.
Length of stay since moving in above state average.
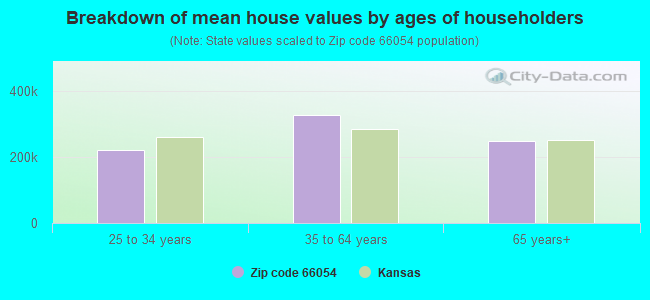
Estimated median house/condo value in 2022: $234,103
66054:
$234,103
Kansas:
$206,600
According to our research of Kansas and other state lists, there were 3 registered sex offenders living in 66054 zip code as of June 19, 2024. The ratio of all residents to sex offenders in zip code 66054 is 980 to 1. The ratio of registered sex offenders to all residents in this zip code is much lower than the state average.
Median resident age:
This zip code:
44.2 years
Kansas median age:
37.6 years
Average household size:
This zip code:
2.6 people
Kansas:
2.4 people
Averages for the 2020 tax year for zip code 66054, filed in 2021:
Average Adjusted Gross Income (AGI) in 2020: $60,875 (Individual Income Tax Returns)
Here:
$60,875
State:
$72,721
Salary/wage: $56,176 (reported on 80.0% of returns)
Here:
$56,176
State:
$58,641
(% of AGI for various income ranges: 1211.2% for AGIs below $25k, 3678.3% for AGIs $25k-50k, 6000.0% for AGIs $50k-75k, 9270.0% for AGIs $75k-100k, 14688.7% for AGIs $100k-200k)
Taxable interest for individuals: $738 (reported on 34.8% of returns)
This zip code:
$738
Kansas:
$1,625
(% of AGI for various income ranges: 22.5% for AGIs below $25k, 22.9% for AGIs $25k-50k, 57.1% for AGIs $50k-75k, 18.3% for AGIs $75k-100k, 56.2% for AGIs $100k-200k)
Ordinary dividends: $2,080 (reported on 14.8% of returns)
Here:
$2,080
State:
$7,290
(% of AGI for various income ranges: 9.2% for AGIs below $25k, 15.8% for AGIs $25k-50k, 57.1% for AGIs $50k-75k, 37.5% for AGIs $75k-100k, 133.8% for AGIs $100k-200k)
Net capital gain/loss in AGI: +$12,563 (reported on 14.1% of returns)
Here:
+$12,563
State:
+$20,511
(% of AGI for various income ranges: 17.9% for AGIs below $25k, 90.8% for AGIs $25k-50k, 126.5% for AGIs $50k-75k, 1194.4% for AGIs $100k-200k)
Profit/loss from business: +$10,125 (reported on 14.8% of returns)
Here:
+$10,125
State:
+$13,852
(% of AGI for various income ranges: 99.2% for AGIs below $25k, 117.9% for AGIs $25k-50k, 380.6% for AGIs $50k-75k, 97.5% for AGIs $75k-100k, 462.5% for AGIs $100k-200k)
Taxable individual retirement arrangement distribution: $18,592 (reported on 8.9% of returns)
66054:
$18,592
Kansas:
$19,921
(% of AGI for various income ranges: 190.8% for AGIs below $25k, 480.0% for AGIs $50k-75k, 598.1% for AGIs $100k-200k)
Total itemized deductions: $27,288 (reported on 5.9% of returns)
Here:
$27,288
State:
$36,939
(% of AGI for various income ranges: 556.5% for AGIs $50k-75k, 773.1% for AGIs $100k-200k)
Charity contributions: $9,280 (reported on 3.7% of returns)
Here:
$9,280
State:
$15,443
(% of AGI for various income ranges: 290.0% for AGIs $100k-200k)
Taxes paid: $7,700 (reported on 5.9% of returns)
66054:
$7,700
State:
$8,001
(% of AGI for various income ranges: 137.6% for AGIs $50k-75k, 238.8% for AGIs $100k-200k)
Earned income credit: $2,089 (reported on 13.3% of returns)
Here:
$2,089
State:
$2,267
(% of AGI for various income ranges: 86.7% for AGIs below $25k, 70.0% for AGIs $25k-50k)
Percentage of individuals using paid preparers for their 2020 taxes: 94.1%
Here:
94%
State:
95%
(% for various income ranges: 91.9% for AGIs below $25k, 96.9% for AGIs $25k-50k, 95.7% for AGIs $50k-75k, 94.1% for AGIs $75k-100k, 95.7% for AGIs $100k-200k, 66.7% for AGIs over 200k)
Averages for the 2012 tax year for zip code 66054, filed in 2013:
Average Adjusted Gross Income (AGI) in 2012: $51,029 (Individual Income Tax Returns)
Here:
$51,029
State:
$60,095
Salary/wage: $47,602 (reported on 81.7% of returns)
Here:
$47,602
State:
$48,770
(% of AGI for various income ranges: 70.4% for AGIs below $25k, 75.5% for AGIs $25k-50k, 75.4% for AGIs $50k-75k, 78.1% for AGIs $75k-100k, 77.5% for AGIs $100k-200k)
Taxable interest for individuals: $824 (reported on 36.5% of returns)
This zip code:
$824
Kansas:
$1,506
(% of AGI for various income ranges: 1.0% for AGIs below $25k, 0.5% for AGIs $25k-50k, 0.7% for AGIs $50k-75k, 0.2% for AGIs $75k-100k, 0.7% for AGIs $100k-200k)
Ordinary dividends: $1,639 (reported on 14.3% of returns)
Here:
$1,639
State:
$6,093
(% of AGI for various income ranges: 0.5% for AGIs below $25k, 0.1% for AGIs $25k-50k, 0.5% for AGIs $50k-75k, 0.4% for AGIs $75k-100k, 0.6% for AGIs $100k-200k)
Net capital gain/loss in AGI: +$3,994 (reported on 12.7% of returns)
Here:
+$3,994
State:
+$14,598
(% of AGI for various income ranges: 0.6% for AGIs $25k-50k, 0.4% for AGIs $50k-75k, 0.5% for AGIs $75k-100k, 2.0% for AGIs $100k-200k)
Profit/loss from business: +$9,177 (reported on 17.5% of returns)
Here:
+$9,177
State:
+$12,554
(% of AGI for various income ranges: 7.2% for AGIs below $25k, 3.2% for AGIs $25k-50k, 4.1% for AGIs $50k-75k, 3.6% for AGIs $75k-100k, 1.4% for AGIs $100k-200k)
Taxable individual retirement arrangement distribution: $10,947 (reported on 11.9% of returns)
66054:
$10,947
Kansas:
$14,098
(% of AGI for various income ranges: 5.4% for AGIs below $25k, 3.5% for AGIs $25k-50k, 2.2% for AGIs $50k-75k, 5.7% for AGIs $75k-100k)
Total itemized deductions: $18,204 (22% of AGI, reported on 35.7% of returns)
Here:
$18,204
State:
$23,678
Here:
22.1% of AGI
State:
18.9% of AGI
(% of AGI for various income ranges: 14.1% for AGIs below $25k, 8.1% for AGIs $25k-50k, 11.9% for AGIs $50k-75k, 12.7% for AGIs $75k-100k, 15.1% for AGIs $100k-200k)
Charity contributions: $2,357 (reported on 27.8% of returns)
Here:
$2,357
State:
$5,321
(% of AGI for various income ranges: 1.1% for AGIs below $25k, 0.8% for AGIs $25k-50k, 1.0% for AGIs $50k-75k, 1.4% for AGIs $75k-100k, 1.6% for AGIs $100k-200k)
Taxes paid: $6,531 (reported on 35.7% of returns)
66054:
$6,531
State:
$9,548
(% of AGI for various income ranges: 3.1% for AGIs below $25k, 2.3% for AGIs $25k-50k, 3.8% for AGIs $50k-75k, 4.8% for AGIs $75k-100k, 6.3% for AGIs $100k-200k)
Earned income credit: $2,222 (reported on 14.3% of returns)
Here:
$2,222
State:
$2,212
(% of AGI for various income ranges: 5.3% for AGIs below $25k, 1.3% for AGIs $25k-50k)
Percentage of individuals using paid preparers for their 2012 taxes: 61.9%
Here:
62%
State:
56%
(% for various income ranges: 54.5% for AGIs below $25k, 58.6% for AGIs $25k-50k, 73.9% for AGIs $50k-75k, 64.3% for AGIs $75k-100k, 68.8% for AGIs $100k-200k)
Averages for the 2004 tax year for zip code 66054, filed in 2005:
Average Adjusted Gross Income (AGI) in 2004: $41,676 (Individual Income Tax Returns)
Here:
$41,676
State:
$45,726
Salary/wage: $39,999 (reported on 85.4% of returns)
Here:
$39,999
State:
$40,112
(% of AGI for various income ranges: 110.1% for AGIs below $10k, 74.3% for AGIs $10k-25k, 85.1% for AGIs $25k-50k, 87.3% for AGIs $50k-75k, 86.8% for AGIs $75k-100k, 66.4% for AGIs over 100k)
Taxable interest for individuals: $1,627 (reported on 46.4% of returns)
This zip code:
$1,627
Kansas:
$1,749
(% of AGI for various income ranges: 11.3% for AGIs below $10k, 4.1% for AGIs $10k-25k, 0.8% for AGIs $25k-50k, 0.8% for AGIs $50k-75k, 0.5% for AGIs $75k-100k, 4.1% for AGIs over 100k)
Taxable dividends: $1,255 (reported on 18.2% of returns)
Here:
$1,255
State:
$3,066
(% of AGI for various income ranges: 1.6% for AGIs below $10k, 0.5% for AGIs $10k-25k, 0.5% for AGIs $25k-50k, 0.4% for AGIs $50k-75k, 0.3% for AGIs $75k-100k, 1.1% for AGIs over 100k)
Net capital gain/loss: +$4,156 (reported on 14.3% of returns)
Here:
+$4,156
State:
+$7,555
(% of AGI for various income ranges: 1.1% for AGIs below $10k, -0.1% for AGIs $10k-25k, 0.5% for AGIs $25k-50k, 0.0% for AGIs $50k-75k, 0.1% for AGIs $75k-100k, 6.8% for AGIs over 100k)
Profit/loss from business: +$4,179 (reported on 18.6% of returns)
Here:
+$4,179
State:
+$9,571
(% of AGI for various income ranges: 12.0% for AGIs below $10k, 2.0% for AGIs $10k-25k, 3.2% for AGIs $25k-50k, -0.4% for AGIs $50k-75k, 2.0% for AGIs $75k-100k, 2.7% for AGIs over 100k)
IRA payment deduction: $2,765 (reported on 2.8% of returns)
66054:
$2,765
Kansas:
$2,922
Total itemized deductions: $16,213 (24% of AGI, reported on 36.6% of returns)
Here:
$16,213
State:
$18,779
Here:
23.8% of AGI
State:
20.5% of AGI
(% of AGI for various income ranges: 14.7% for AGIs $10k-25k, 12.8% for AGIs $25k-50k, 14.7% for AGIs $50k-75k, 16.8% for AGIs $75k-100k, 13.4% for AGIs over 100k)
Charity contributions deductions: $2,014 (3% of AGI, reported on 29.6% of returns)
Here:
$2,014
State:
$3,892
Here:
2.8% of AGI
State:
4.0% of AGI
(% of AGI for various income ranges: 1.2% for AGIs $10k-25k, 1.7% for AGIs $25k-50k, 1.0% for AGIs $50k-75k, 2.0% for AGIs $75k-100k, 1.6% for AGIs over 100k)
Total tax: $4,839 (reported on 77.5% of returns)
66054:
$4,839
State:
$7,203
(% of AGI for various income ranges: 6.1% for AGIs below $10k, 3.7% for AGIs $10k-25k, 6.1% for AGIs $25k-50k, 7.9% for AGIs $50k-75k, 10.0% for AGIs $75k-100k, 15.6% for AGIs over 100k)
Earned income credit: $1,763 (reported on 11.5% of returns)
Here:
$1,763
State:
$1,674
Percentage of individuals using paid preparers for their 2004 taxes: 67.9%
Here:
68%
State:
63%
(% for various income ranges: 59.2% for AGIs below $10k, 64.3% for AGIs $10k-25k, 68.4% for AGIs $25k-50k, 75.0% for AGIs $50k-75k, 70.3% for AGIs $75k-100k, 78.8% for AGIs over 100k)
Household received Food Stamps/SNAP in the past 12 months: 54 Household did not receive Food Stamps/SNAP in the past 12 months: 1,008
Women who had a birth in the past 12 months: 34 (30 now married, 3 unmarried) Women who did not have a birth in the past 12 months: 401 (233 now married, 166 unmarried)
Housing units in zip code 66054 with a mortgage: 406 (71 second mortgage, 47 both second mortgage and home equity loan) Median monthly owner costs for units with a mortgage: $1,543 Median monthly owner costs for units without a mortgage: $630
Residents with income below the poverty level in 2022:
This zip code:
10.1%
Whole state:
12.0%
Residents with income below 50% of the poverty level in 2022:
This zip code:
6.6%
Whole state:
6.4%
Median number of rooms in houses and condos:
Here:
6.3
State:
6.9
Median number of rooms in apartments:
Here:
6.0
State:
4.4
Notable locations in this zip code not listed on our city pages
Notable locations in zip code 66054: McLouth Sewer Treatment Plant (A), Hinton School (B), Brown School (C), Mclouth Police Department (D), Union Township Fire District 9 (E), Sarcoxie Township Fire District 4 North Station (F), McLouth Public Library (G), McLouth Fire Department (H), Alexandria Township Fire Department (I). Display/hide their locations on the map
Size of family households: 379 2-persons, 120 3-persons, 76 4-persons, 46 5-persons, 48 6-persons, 41 7-or-more-persons
Size of nonfamily households: 272 1-person, 80 2-persons, 3 3-persons
552 married couples with children.
55 single-parent households (3 men, 52 women).
97.3% of residents of 66054 zip code speak English at home.
2.6% of residents speak Spanish at home (67% very well, 33% well).
0.1% of residents speak other Indo-European language at home (100% very well).
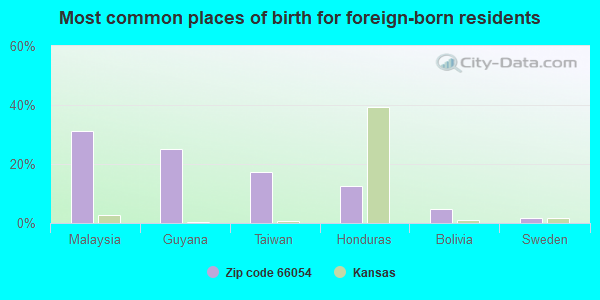
Foreign born population: 62 (2.3%) (51.6% of them are naturalized citizens)
This zip code:
2.3%
Whole state:
7.1%
31%Malaysia
25%Guyana
17%Taiwan
12%Honduras
5%Bolivia
2%Sweden
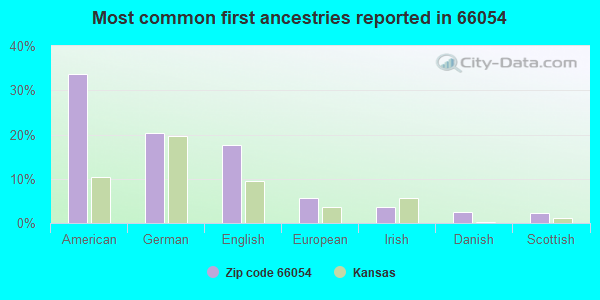
34%American
20%German
18%English
6%European
4%Irish
3%Danish
2%Scottish
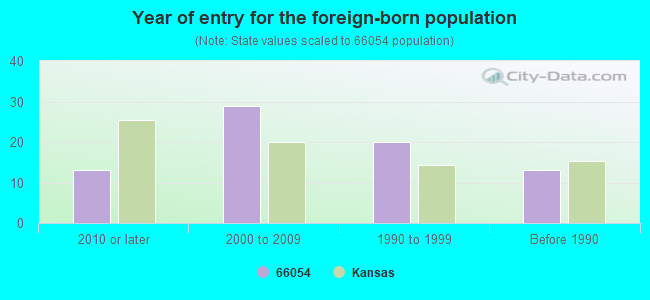
Year of entry for the foreign-born population
132010 or later
292000 to 2009
201990 to 1999
13Before 1990
Facilities with environmental interests located in this zip code:
MCLOUTH ELEM (217 SUMMIT in MCLOUTH, KS)
(National Center for Education Statistics) - STATE ID-4006
MCLOUTH HIGH (217 SUMMIT in MCLOUTH, KS)
(National Center for Education Statistics) - STATE ID-4008
MCLOUTH MIDDLE (217 SUMMIT in MCLOUTH, KS)
(National Center for Education Statistics) - STATE ID-4007
MCLOUTH PUMP STA (7055 UNION RD in MCLOUTH, KS)
(Resource Conservation and Recovery Act (tracking hazardous waste)) Organizations: ENTERPRISE PRODUCTS OPERATING LP (CONTACT/OPERATOR)
, MID AMERICA PIPELINE CO LLC (CONTACT/OWNER)
MCLOUTH SEWER TREATMENT PLANT C/O CITY HALL (110 NORTH UNION STREET in MCLOUTH, KS)
National Pollutant Discharge Elimination System NON-MAJOR (Tracking pollutant discharge elimination systems) - permit Business SIC classification: SEWERAGE SYSTEMS Organizations: MCLOUTH, CITY OF (CONTACT/OWNER)
Alternative names: MCLOUTH CITY OF STP
MURRFIELD FARMS SUPPLY CO (22947 243RD in MC LOUTH, KS)
COMPLIANCE ACTIVITY (Tracking inspections of insecticide, fungicide, and rodenticide, and toxic substances) Conditionally Exempt Small Quantity Generators, less than 100 kg/month of hazardous waste (Resource Conservation and Recovery Act (tracking hazardous waste)) - notification Organizations: WILLIAM MURR (CONTACT/OWNER)
JOES RPR SHOP (2 MN ON HWY 92 in MCLOUTH, KS)
Conditionally Exempt Small Quantity Generators, less than 100 kg/month of hazardous waste (Resource Conservation and Recovery Act (tracking hazardous waste)) Organizations: ALBERT J CLEAVINGER (CONTACT/OWNER)
JDFX (204 W LUCY in MCLOUTH, KS)
Conditionally Exempt Small Quantity Generators, less than 100 kg/month of hazardous waste (Resource Conservation and Recovery Act (tracking hazardous waste)) - notification Organizations: KIRK PATTERSON (CONTACT/OWNER)
Housing units lacking complete plumbing facilities: 1.8% Housing units lacking complete kitchen facilities: 0.1%
37.6%Bottled, tank, or LP gas
36.4%Utility gas
14.9%Electricity
9.6%Wood
1.7%Other fuel
Population in 1990: 2,139. Population change in the 1990s: +667 (+31.2%).
Place of birth for U.S.-born residents:
This state: 1,996
Northeast: 53
Midwest: 301
South: 132
West: 159
58% of the 66054 zip code residents lived in the same house 5 years ago. Out of people who lived in different houses, 35% lived in this county. Out of people who lived in different counties, 50% lived in Kansas.
91% of the 66054 zip code residents lived in the same house 1 year ago. Out of people who lived in different houses, 68% moved from this county. Out of people who lived in different houses, 24% moved from different county within same state. Out of people who lived in different houses, 9% moved from different state.
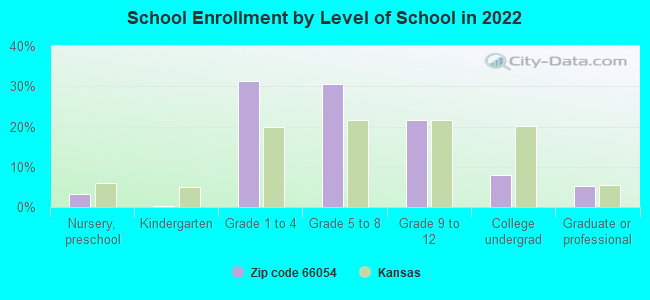
Private vs. public school enrollment:
Students in private schools in grades 1 to 8 (elementary and middle school): 194
Here:
53.1%
Kansas:
14.1%
Students in private schools in grades 9 to 12 (high school): 23
Here:
19.9%
Kansas:
10.8%
Students in private undergraduate colleges: 6
Here:
14.9%
Kansas:
15.4%
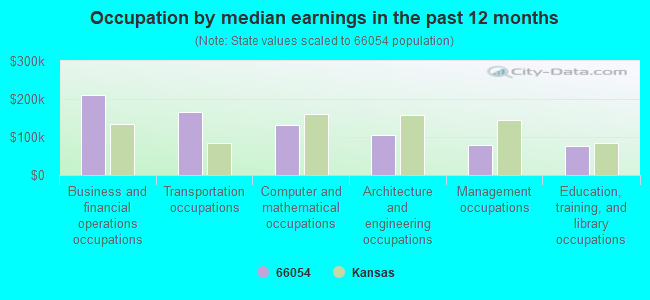
Occupation by median earnings in the past 12 months ($)
209,212Business and financial operations occupations
164,955Transportation occupations
132,422Computer and mathematical occupations
104,281Architecture and engineering occupations
79,248Management occupations
75,747Education, training, and library occupations
Companies with federal contracts located in this zip code:
LEAVENWORTH-JEFFERSON ELECTRIC (507 NORTH UNION STREET in MC LOUTH, KS) : $1,726,544 in 12 contractsfrom 2002 to 2006
Contracts for Electric Services by Defense Logistics Agency, Army, U.S. Army Corps of Engineers - civil program financing only Signed by year:2000: $0; 2001: $0; 2002: $6,567; 2003: $0; 2004: $16,000; 2005: $1,680,977; 2006: $23,000.
Biggest contracts:
$1,619,447 with Defense Logistics Agency for Electric Services. Signed on 2005-09-30. Completion date: 2005-09-30.
$25,092 with Army for Electric Services. Signed on 2005-04-12. Completion date: 2003-09-30.
$15,000, same as above.Signed on 2006-04-20. Completion date: 2003-09-30.
$13,000, same as above.Signed on 2005-08-17. Completion date: 2003-09-30.
JAMES W HUNT (13116 UNION ROAD in MC LOUTH, KS; small business) : $63,495 in 9 contractsfrom 2001 to 2006
Contracts for Custodial Janitorial Services, Landscaping/Groundskeeping Services, Facilities Operations Support Services by U.S. Army Corps of Engineers - civil program financing only, Army Signed by year:2000: $0; 2001: $16,143; 2002: $2,365; 2003: $21,062; 2004: $0; 2005: $15,950; 2006: $7,975.
Biggest contracts:
$18,697 with U.S. Army Corps of Engineers - civil program financing only for Custodial Janitorial Services. Taking place in MO. Signed on 2003-04-03. Completion date: 2002-09-30.
$16,143, same as above.Signed on 2001-10-11. Completion date: 2002-09-30.
$7,975 with Army for Landscaping/Groundskeeping Services. Signed on 2006-04-10. Completion date: 2005-03-07.
$7,975 with U.S. Army Corps of Engineers - civil program financing only for Landscaping/Groundskeeping Services. Signed on 2005-03-07. Completion date: 2005-03-07.
Top industries in this zip code by the number of employees in 2005:
Utilities: Electric Power Distribution (20-49 employees: 1 establishment)
Administrative and Support and Waste Management and Remediation Services: Janitorial Services (20-49: 1)
Accommodation and Food Services: Full-Service Restaurants (10-19: 1, 1-4: 1)
Finance and Insurance: Commercial Banking (10-19: 1)
Mining: Crude Petroleum and Natural Gas Extraction (10-19: 1)
Construction: Poured Concrete Foundation and Structure Contractors (5-9: 1)
Other Services (except Public Administration): Religious Organizations (1-4: 3)
Fatal accident statistics in 2013:
Fatal accident count: 1
Vehicles involved in fatal accidents: 1
Fatal accidents caused by drunken drivers: 1
Fatalities: 1
Persons involved in fatal accidents: 2
Pedestrians involved in fatal accidents: 0
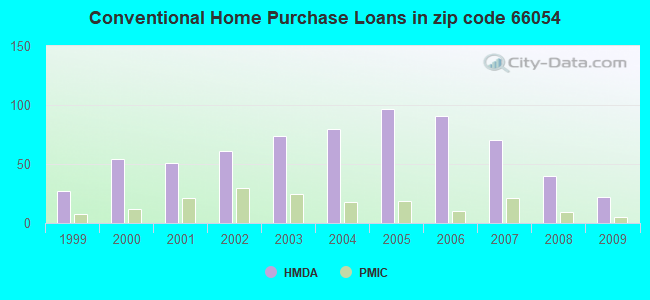
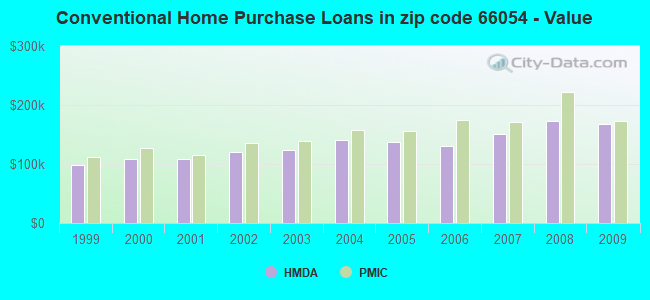
Home Mortgage Disclosure Act Aggregated Statistics For Year 2009 (Based on 4 partial tracts)
A) FHA, FSA/RHS & VA Home Purchase Loans
B) Conventional Home Purchase Loans
C) Refinancings
D) Home Improvement Loans
F) Non-occupant Loans on < 5 Family Dwellings (A B C & D)
G) Loans On Manufactured Home Dwelling (A B C & D)
Number
Average Value
Number
Average Value
Number
Average Value
Number
Average Value
Number
Average Value
Number
Average Value
LOANS ORIGINATED
30
$164,188
22
$167,693
180
$168,247
16
$85,798
12
$121,655
2
$63,535
APPLICATIONS APPROVED, NOT ACCEPTED
1
$206,340
2
$107,480
10
$198,733
2
$19,740
0
$0
0
$0
APPLICATIONS DENIED
1
$216,150
6
$196,770
37
$180,881
5
$52,592
0
$0
0
$0
APPLICATIONS WITHDRAWN
5
$133,126
3
$119,980
20
$176,181
0
$0
1
$124,260
1
$36,770
FILES CLOSED FOR INCOMPLETENESS
0
$0
0
$0
6
$156,842
1
$53,530
0
$0
0
$0
Aggregated Statistics For Year 2008 (Based on 4 partial tracts)
A) FHA, FSA/RHS & VA Home Purchase Loans
B) Conventional Home Purchase Loans
C) Refinancings
D) Home Improvement Loans
F) Non-occupant Loans on < 5 Family Dwellings (A B C & D)
G) Loans On Manufactured Home Dwelling (A B C & D)
Number
Average Value
Number
Average Value
Number
Average Value
Number
Average Value
Number
Average Value
Number
Average Value
LOANS ORIGINATED
18
$161,980
40
$173,202
109
$142,199
13
$77,464
18
$122,613
2
$89,620
APPLICATIONS APPROVED, NOT ACCEPTED
0
$0
2
$206,545
7
$167,999
1
$22,060
1
$132,800
1
$86,210
APPLICATIONS DENIED
3
$171,107
7
$152,697
36
$174,384
8
$49,836
2
$111,750
3
$59,417
APPLICATIONS WITHDRAWN
1
$168,170
3
$119,583
23
$152,955
2
$99,540
1
$208,330
2
$83,650
FILES CLOSED FOR INCOMPLETENESS
0
$0
0
$0
5
$165,544
0
$0
2
$86,215
1
$136,060
Aggregated Statistics For Year 2007 (Based on 4 partial tracts)
A) FHA, FSA/RHS & VA Home Purchase Loans
B) Conventional Home Purchase Loans
C) Refinancings
D) Home Improvement Loans
F) Non-occupant Loans on < 5 Family Dwellings (A B C & D)
G) Loans On Manufactured Home Dwelling (A B C & D)
Number
Average Value
Number
Average Value
Number
Average Value
Number
Average Value
Number
Average Value
Number
Average Value
LOANS ORIGINATED
11
$152,665
70
$150,262
102
$139,769
18
$43,348
16
$139,308
3
$72,583
APPLICATIONS APPROVED, NOT ACCEPTED
1
$166,300
7
$126,111
16
$176,501
0
$0
1
$73,840
0
$0
APPLICATIONS DENIED
2
$140,150
13
$139,984
60
$162,894
13
$63,795
6
$157,770
3
$83,850
APPLICATIONS WITHDRAWN
1
$110,320
7
$157,823
25
$161,036
4
$78,492
2
$153,880
0
$0
FILES CLOSED FOR INCOMPLETENESS
0
$0
1
$133,610
10
$183,741
1
$45,810
0
$0
0
$0
Aggregated Statistics For Year 2006 (Based on 4 partial tracts)
A) FHA, FSA/RHS & VA Home Purchase Loans
B) Conventional Home Purchase Loans
C) Refinancings
D) Home Improvement Loans
F) Non-occupant Loans on < 5 Family Dwellings (A B C & D)
G) Loans On Manufactured Home Dwelling (A B C & D)
Number
Average Value
Number
Average Value
Number
Average Value
Number
Average Value
Number
Average Value
Number
Average Value
LOANS ORIGINATED
18
$189,480
91
$130,958
102
$138,445
18
$45,260
17
$171,369
5
$102,760
APPLICATIONS APPROVED, NOT ACCEPTED
0
$0
6
$123,595
16
$178,616
5
$26,678
0
$0
1
$39,690
APPLICATIONS DENIED
1
$140,560
22
$139,750
64
$149,338
11
$42,493
5
$162,406
3
$46,620
APPLICATIONS WITHDRAWN
2
$101,740
11
$160,685
39
$145,507
3
$70,867
2
$87,835
1
$101,540
FILES CLOSED FOR INCOMPLETENESS
0
$0
3
$113,897
7
$154,413
0
$0
0
$0
0
$0
Aggregated Statistics For Year 2005 (Based on 4 partial tracts)
A) FHA, FSA/RHS & VA Home Purchase Loans
B) Conventional Home Purchase Loans
C) Refinancings
D) Home Improvement Loans
F) Non-occupant Loans on < 5 Family Dwellings (A B C & D)
G) Loans On Manufactured Home Dwelling (A B C & D)
Number
Average Value
Number
Average Value
Number
Average Value
Number
Average Value
Number
Average Value
Number
Average Value
LOANS ORIGINATED
13
$182,714
97
$137,742
123
$134,617
15
$61,230
19
$118,774
8
$67,261
APPLICATIONS APPROVED, NOT ACCEPTED
1
$107,870
10
$144,335
16
$131,480
3
$34,237
0
$0
0
$0
APPLICATIONS DENIED
1
$49,440
19
$119,086
71
$138,530
10
$45,087
1
$95,290
7
$69,926
APPLICATIONS WITHDRAWN
4
$151,390
22
$119,857
49
$151,866
5
$178,612
1
$64,970
1
$143,630
FILES CLOSED FOR INCOMPLETENESS
0
$0
3
$132,450
7
$163,044
0
$0
1
$107,900
0
$0
Aggregated Statistics For Year 2004 (Based on 4 partial tracts)
A) FHA, FSA/RHS & VA Home Purchase Loans
B) Conventional Home Purchase Loans
C) Refinancings
D) Home Improvement Loans
F) Non-occupant Loans on < 5 Family Dwellings (A B C & D)
G) Loans On Manufactured Home Dwelling (A B C & D)
Number
Average Value
Number
Average Value
Number
Average Value
Number
Average Value
Number
Average Value
Number
Average Value
LOANS ORIGINATED
15
$164,018
80
$141,356
147
$122,754
18
$66,589
19
$121,907
6
$74,240
APPLICATIONS APPROVED, NOT ACCEPTED
0
$0
7
$128,131
19
$132,880
2
$11,645
3
$87,940
0
$0
APPLICATIONS DENIED
1
$101,330
15
$119,081
67
$126,751
8
$72,736
3
$72,993
4
$69,718
APPLICATIONS WITHDRAWN
0
$0
6
$110,170
46
$141,756
6
$93,550
0
$0
2
$118,180
FILES CLOSED FOR INCOMPLETENESS
0
$0
2
$70,910
21
$137,654
0
$0
0
$0
1
$99,980
Aggregated Statistics For Year 2003 (Based on 4 partial tracts)
A) FHA, FSA/RHS & VA Home Purchase Loans
B) Conventional Home Purchase Loans
C) Refinancings
D) Home Improvement Loans
F) Non-occupant Loans on < 5 Family Dwellings (A B C & D)
Number
Average Value
Number
Average Value
Number
Average Value
Number
Average Value
Number
Average Value
LOANS ORIGINATED
14
$157,314
74
$124,325
241
$121,621
13
$31,929
19
$110,359
APPLICATIONS APPROVED, NOT ACCEPTED
0
$0
5
$85,038
14
$110,678
1
$37,310
0
$0
APPLICATIONS DENIED
1
$210,630
7
$87,689
57
$121,100
4
$31,875
1
$113,190
APPLICATIONS WITHDRAWN
1
$157,200
6
$120,160
54
$128,355
0
$0
2
$127,690
FILES CLOSED FOR INCOMPLETENESS
0
$0
2
$129,320
8
$98,794
0
$0
0
$0
Aggregated Statistics For Year 2002 (Based on 4 partial tracts)
A) FHA, FSA/RHS & VA Home Purchase Loans
B) Conventional Home Purchase Loans
C) Refinancings
D) Home Improvement Loans
E) Loans on Dwellings For 5+ Families
F) Non-occupant Loans on < 5 Family Dwellings (A B C & D)
Number
Average Value
Number
Average Value
Number
Average Value
Number
Average Value
Number
Average Value
Number
Average Value
LOANS ORIGINATED
9
$135,237
61
$119,931
186
$120,745
10
$18,289
1
$107,460
16
$107,822
APPLICATIONS APPROVED, NOT ACCEPTED
0
$0
5
$100,530
12
$126,327
3
$46,303
0
$0
0
$0
APPLICATIONS DENIED
1
$138,520
9
$77,143
37
$100,654
4
$16,238
0
$0
1
$121,760
APPLICATIONS WITHDRAWN
1
$102,560
8
$103,620
48
$133,356
1
$14,470
0
$0
2
$78,450
FILES CLOSED FOR INCOMPLETENESS
0
$0
1
$158,950
17
$118,869
0
$0
0
$0
0
$0
Aggregated Statistics For Year 2001 (Based on 4 partial tracts)
A) FHA, FSA/RHS & VA Home Purchase Loans
B) Conventional Home Purchase Loans
C) Refinancings
D) Home Improvement Loans
F) Non-occupant Loans on < 5 Family Dwellings (A B C & D)
Number
Average Value
Number
Average Value
Number
Average Value
Number
Average Value
Number
Average Value
LOANS ORIGINATED
12
$124,356
51
$109,274
182
$106,524
13
$32,551
31
$99,628
APPLICATIONS APPROVED, NOT ACCEPTED
0
$0
6
$73,603
11
$90,677
0
$0
1
$54,750
APPLICATIONS DENIED
1
$91,120
14
$84,588
42
$101,261
7
$21,824
3
$75,590
APPLICATIONS WITHDRAWN
1
$176,190
6
$92,368
36
$108,568
2
$16,465
2
$62,230
FILES CLOSED FOR INCOMPLETENESS
0
$0
0
$0
9
$117,280
0
$0
1
$70,880
Aggregated Statistics For Year 2000 (Based on 4 partial tracts)
A) FHA, FSA/RHS & VA Home Purchase Loans
B) Conventional Home Purchase Loans
C) Refinancings
D) Home Improvement Loans
F) Non-occupant Loans on < 5 Family Dwellings (A B C & D)
Number
Average Value
Number
Average Value
Number
Average Value
Number
Average Value
Number
Average Value
LOANS ORIGINATED
9
$110,114
54
$108,438
66
$84,347
17
$18,283
13
$68,413
APPLICATIONS APPROVED, NOT ACCEPTED
1
$106,610
8
$92,961
9
$94,088
2
$50,285
0
$0
APPLICATIONS DENIED
0
$0
21
$70,859
23
$79,303
4
$31,848
2
$80,085
APPLICATIONS WITHDRAWN
1
$66,190
7
$124,529
18
$83,727
0
$0
1
$89,480
FILES CLOSED FOR INCOMPLETENESS
0
$0
1
$81,490
5
$89,738
0
$0
0
$0
Aggregated Statistics For Year 1999 (Based on 2 partial tracts)
A) FHA, FSA/RHS & VA Home Purchase Loans
B) Conventional Home Purchase Loans
C) Refinancings
D) Home Improvement Loans
F) Non-occupant Loans on < 5 Family Dwellings (A B C & D)
Detailed PMIC statistics for the following Tracts:0710.00
, 0713.00
2002 - 2018 National Fire Incident Reporting System (NFIRS) incidents
Based on the data from the years 2002 - 2018 the average number of fires per year is 52. The highest number of reported fire incidents - 95 took place in 2002, and the least - 21 in 2010. The data has a dropping trend.
When looking into fire subcategories, the most reports belonged to: Outside Fires (59.7%), and Structure Fires (30.6%).
Fire incident types reported to NFIRS in Zip Code 66054


 Nearest zip codes: 66097, 66066, 66086, 66020, 66044, 66073.


 Based on the data from the years 2002 - 2018 the average number of fires per year is 52. The highest number of reported fire incidents - 95 took place in 2002, and the least - 21 in 2010. The data has a dropping trend.
 When looking into fire subcategories, the most reports belonged to: Outside Fires (59.7%), and Structure Fires (30.6%).