Estimated zip code population in 2022: 2,388 Zip code population in 2010: 1,676 Zip code population in 2000: 1,133
Houses and condos: 814 Renter-occupied apartments: 89
% of renters here:
11%
State:
32%
March 2022 cost of living index in zip code 67001: 82.0 (low, U.S. average is 100)
Land area: 23.7 sq. mi. Water area: 0.0 sq. mi.
Population density: 101 people per square mile
(very low).
OSM Map
General Map
Google Map
MSN Map
OSM Map
General Map
Google Map
MSN Map
OSM Map
General Map
Google Map
MSN Map
OSM Map
General Map
Google Map
MSN Map
Please wait while loading the map...
Real estate property taxes paid for housing units in 2022:
This zip code:
1.0% ($3,535)
Kansas:
1.2% ($2,578)
Median real estate property taxes paid for housing units with mortgages in 2022: $3,562 (1.2%) Median real estate property taxes paid for housing units with no mortgage in 2022: $3,444 (0.9%)
Business Search- 14 Million verified businesses
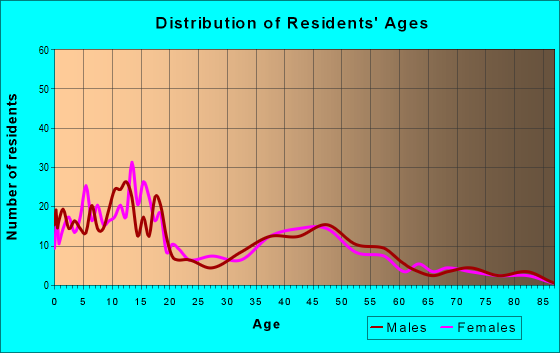
Males: 1,182
(49.5%)
Females: 1,206
(50.5%)
For population 25 years and over in 67001:
High school or higher: 95.4%
Bachelor's degree or higher: 34.0%
Graduate or professional degree: 9.6%
Unemployed: 2.4%
Mean travel time to work (commute): 26.1 minutes
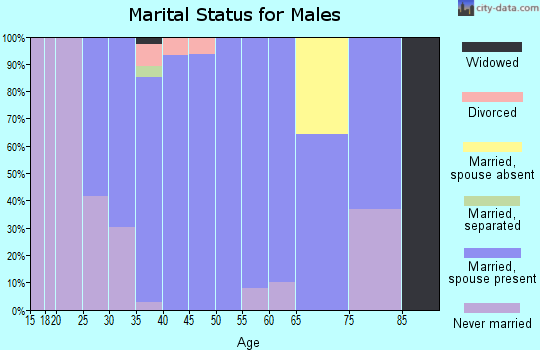
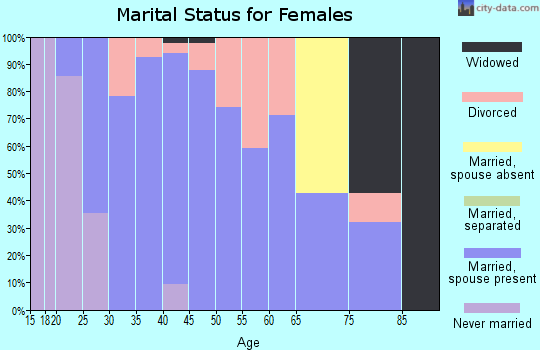
For population 15 years and over in 67001:
Never married: 24.6%
Now married: 70.4%
Separated: 0.1%
Widowed: 1.1%
Divorced: 3.8%
Zip code 67001 compared to state average:
Median house value above state average.
Black race population percentage significantly below state average.
Hispanic race population percentage significantly below state average.
Median age below state average.
Foreign-born population percentage significantly below state average.
Renting percentage significantly below state average.
Length of stay since moving in significantly above state average.
Number of rooms per house significantly above state average.
Estimated median house/condo value in 2022: $357,976
67001:
$357,976
Kansas:
$206,600
Median resident age:
This zip code:
32.0 years
Kansas median age:
37.6 years
Average household size:
This zip code:
3.0 people
Kansas:
2.4 people
Averages for the 2020 tax year for zip code 67001, filed in 2021:
Average Adjusted Gross Income (AGI) in 2020: $93,545 (Individual Income Tax Returns)
Here:
$93,545
State:
$72,721
Salary/wage: $79,736 (reported on 85.2% of returns)
Here:
$79,736
State:
$58,641
(% of AGI for various income ranges: 1171.2% for AGIs below $25k, 4191.0% for AGIs $25k-50k, 7255.0% for AGIs $50k-75k, 11041.7% for AGIs $75k-100k, 17055.4% for AGIs $100k-200k, 68233.3% for AGIs over 200k)
Taxable interest for individuals: $717 (reported on 47.7% of returns)
This zip code:
$717
Kansas:
$1,625
(% of AGI for various income ranges: 4.1% for AGIs below $25k, 71.0% for AGIs $25k-50k, 56.7% for AGIs $50k-75k, 35.0% for AGIs $75k-100k, 86.2% for AGIs $100k-200k, 186.7% for AGIs over 200k)
Ordinary dividends: $3,582 (reported on 25.0% of returns)
Here:
$3,582
State:
$7,290
(% of AGI for various income ranges: 19.4% for AGIs below $25k, 105.0% for AGIs $25k-50k, 131.7% for AGIs $75k-100k, 254.6% for AGIs $100k-200k, 800.0% for AGIs over 200k)
Net capital gain/loss in AGI: +$8,155 (reported on 25.0% of returns)
Here:
+$8,155
State:
+$20,511
(% of AGI for various income ranges: 45.3% for AGIs below $25k, 206.7% for AGIs $50k-75k, 130.0% for AGIs $75k-100k, 363.1% for AGIs $100k-200k, 3476.7% for AGIs over 200k)
Profit/loss from business: +$12,806 (reported on 19.3% of returns)
Here:
+$12,806
State:
+$13,852
(% of AGI for various income ranges: 167.6% for AGIs below $25k, 840.0% for AGIs $50k-75k, 313.3% for AGIs $75k-100k, 442.3% for AGIs $100k-200k, 2083.3% for AGIs over 200k)
Taxable individual retirement arrangement distribution: $17,778 (reported on 10.2% of returns)
67001:
$17,778
Kansas:
$19,921
(% of AGI for various income ranges: 122.4% for AGIs below $25k, 865.0% for AGIs $50k-75k, 671.5% for AGIs $100k-200k)
Total itemized deductions: $33,044 (reported on 10.2% of returns)
Here:
$33,044
State:
$36,939
(% of AGI for various income ranges: 1223.1% for AGIs $100k-200k, 4613.3% for AGIs over 200k)
Charity contributions: $12,100 (reported on 9.1% of returns)
Here:
$12,100
State:
$15,443
(% of AGI for various income ranges: 250.8% for AGIs $100k-200k, 2140.0% for AGIs over 200k)
Taxes paid: $9,233 (reported on 10.2% of returns)
67001:
$9,233
State:
$8,001
(% of AGI for various income ranges: 377.7% for AGIs $100k-200k, 1133.3% for AGIs over 200k)
Earned income credit: $1,867 (reported on 6.8% of returns)
Here:
$1,867
State:
$2,267
(% of AGI for various income ranges: 38.2% for AGIs below $25k, 47.0% for AGIs $25k-50k)
Percentage of individuals using paid preparers for their 2020 taxes: 95.5%
Here:
95%
State:
95%
(% for various income ranges: 95.8% for AGIs below $25k, 100.0% for AGIs $25k-50k, 90.0% for AGIs $50k-75k, 90.0% for AGIs $75k-100k, 100.0% for AGIs $100k-200k, 88.9% for AGIs over 200k)
Averages for the 2012 tax year for zip code 67001, filed in 2013:
Average Adjusted Gross Income (AGI) in 2012: $75,915 (Individual Income Tax Returns)
Here:
$75,915
State:
$60,095
Salary/wage: $62,414 (reported on 88.0% of returns)
Here:
$62,414
State:
$48,770
(% of AGI for various income ranges: 70.8% for AGIs below $25k, 81.2% for AGIs $25k-50k, 81.6% for AGIs $50k-75k, 81.9% for AGIs $75k-100k, 80.0% for AGIs $100k-200k, 50.9% for AGIs over 200k)
Taxable interest for individuals: $586 (reported on 48.0% of returns)
This zip code:
$586
Kansas:
$1,506
(% of AGI for various income ranges: 1.6% for AGIs below $25k, 0.2% for AGIs $25k-50k, 0.4% for AGIs $50k-75k, 0.3% for AGIs $75k-100k, 0.2% for AGIs $100k-200k, 0.5% for AGIs over 200k)
Ordinary dividends: $1,462 (reported on 21.3% of returns)
Here:
$1,462
State:
$6,093
(% of AGI for various income ranges: 2.1% for AGIs below $25k, 0.7% for AGIs $50k-75k, 0.4% for AGIs $75k-100k, 0.2% for AGIs $100k-200k, 0.3% for AGIs over 200k)
Net capital gain/loss in AGI: +$3,729 (reported on 18.7% of returns)
Here:
+$3,729
State:
+$14,598
(% of AGI for various income ranges: 0.5% for AGIs $25k-50k, 0.2% for AGIs $75k-100k, 1.3% for AGIs $100k-200k, 1.7% for AGIs over 200k)
Profit/loss from business: +$15,829 (reported on 18.7% of returns)
Here:
+$15,829
State:
+$12,554
(% of AGI for various income ranges: 15.0% for AGIs below $25k, 3.2% for AGIs $50k-75k, 3.8% for AGIs $75k-100k, 6.7% for AGIs $100k-200k)
Taxable individual retirement arrangement distribution: $11,371 (reported on 9.3% of returns)
67001:
$11,371
Kansas:
$14,098
(% of AGI for various income ranges: 6.8% for AGIs below $25k, 3.8% for AGIs $50k-75k, 1.8% for AGIs $100k-200k)
Total itemized deductions: $22,747 (18% of AGI, reported on 45.3% of returns)
Here:
$22,747
State:
$23,678
Here:
18.1% of AGI
State:
18.9% of AGI
(% of AGI for various income ranges: 20.1% for AGIs $25k-50k, 9.8% for AGIs $50k-75k, 12.6% for AGIs $75k-100k, 15.1% for AGIs $100k-200k, 14.3% for AGIs over 200k)
Charity contributions: $3,845 (reported on 38.7% of returns)
Here:
$3,845
State:
$5,321
(% of AGI for various income ranges: 2.0% for AGIs $25k-50k, 1.1% for AGIs $50k-75k, 2.0% for AGIs $75k-100k, 2.4% for AGIs $100k-200k, 2.0% for AGIs over 200k)
Taxes paid: $9,821 (reported on 45.3% of returns)
67001:
$9,821
State:
$9,548
(% of AGI for various income ranges: 6.1% for AGIs $25k-50k, 3.9% for AGIs $50k-75k, 5.3% for AGIs $75k-100k, 7.1% for AGIs $100k-200k, 6.3% for AGIs over 200k)
Earned income credit: $2,120 (reported on 6.7% of returns)
Here:
$2,120
State:
$2,212
(% of AGI for various income ranges: 2.6% for AGIs below $25k, 1.0% for AGIs $25k-50k)
Percentage of individuals using paid preparers for their 2012 taxes: 60.0%
Here:
60%
State:
56%
(% for various income ranges: 56.0% for AGIs below $25k, 63.6% for AGIs $25k-50k, 58.3% for AGIs $50k-75k, 66.7% for AGIs $75k-100k, 57.1% for AGIs $100k-200k, 75.0% for AGIs over 200k)
Averages for the 2004 tax year for zip code 67001, filed in 2005:
Average Adjusted Gross Income (AGI) in 2004: $47,805 (Individual Income Tax Returns)
Here:
$47,805
State:
$45,726
Salary/wage: $45,151 (reported on 87.3% of returns)
Here:
$45,151
State:
$40,112
(% of AGI for various income ranges: 93.4% for AGIs below $10k, 62.0% for AGIs $10k-25k, 81.1% for AGIs $25k-50k, 87.7% for AGIs $50k-75k, 83.5% for AGIs $75k-100k, 81.8% for AGIs over 100k)
Taxable interest for individuals: $811 (reported on 59.9% of returns)
This zip code:
$811
Kansas:
$1,749
(% of AGI for various income ranges: 8.2% for AGIs below $10k, 5.3% for AGIs $10k-25k, 1.0% for AGIs $25k-50k, 1.0% for AGIs $50k-75k, 0.6% for AGIs $75k-100k, 0.2% for AGIs over 100k)
Taxable dividends: $771 (reported on 25.5% of returns)
Here:
$771
State:
$3,066
(% of AGI for various income ranges: 0.4% for AGIs below $10k, 1.6% for AGIs $10k-25k, 0.3% for AGIs $25k-50k, 0.4% for AGIs $50k-75k, 0.6% for AGIs $75k-100k, 0.1% for AGIs over 100k)
Net capital gain/loss: +$858 (reported on 21.2% of returns)
Here:
+$858
State:
+$7,555
(% of AGI for various income ranges: -2.6% for AGIs below $10k, 0.5% for AGIs $10k-25k, 0.5% for AGIs $25k-50k, 0.3% for AGIs $50k-75k, 0.3% for AGIs $75k-100k, 0.6% for AGIs over 100k)
Profit/loss from business: +$8,374 (reported on 16.5% of returns)
Here:
+$8,374
State:
+$9,571
(% of AGI for various income ranges: 9.3% for AGIs $10k-25k, 4.7% for AGIs $25k-50k, 0.3% for AGIs $50k-75k, 5.1% for AGIs $75k-100k, 1.0% for AGIs over 100k)
IRA payment deduction: $3,312 (reported on 2.7% of returns)
67001:
$3,312
Kansas:
$2,922
Total itemized deductions: $16,173 (20% of AGI, reported on 36.7% of returns)
Here:
$16,173
State:
$18,779
Here:
19.5% of AGI
State:
20.5% of AGI
(% of AGI for various income ranges: 14.9% for AGIs $10k-25k, 8.4% for AGIs $25k-50k, 9.6% for AGIs $50k-75k, 13.9% for AGIs $75k-100k, 15.3% for AGIs over 100k)
Charity contributions deductions: $3,085 (4% of AGI, reported on 33.6% of returns)
Here:
$3,085
State:
$3,892
Here:
3.6% of AGI
State:
4.0% of AGI
(% of AGI for various income ranges: 2.8% for AGIs $10k-25k, 1.3% for AGIs $25k-50k, 1.5% for AGIs $50k-75k, 1.8% for AGIs $75k-100k, 3.3% for AGIs over 100k)
Total tax: $6,115 (reported on 75.8% of returns)
67001:
$6,115
State:
$7,203
(% of AGI for various income ranges: 2.4% for AGIs below $10k, 5.6% for AGIs $10k-25k, 6.3% for AGIs $25k-50k, 6.8% for AGIs $50k-75k, 8.9% for AGIs $75k-100k, 14.8% for AGIs over 100k)
Earned income credit: $1,561 (reported on 6.8% of returns)
Here:
$1,561
State:
$1,674
Percentage of individuals using paid preparers for their 2004 taxes: 61.1%
Here:
61%
State:
63%
(% for various income ranges: 46.4% for AGIs below $10k, 59.6% for AGIs $10k-25k, 70.0% for AGIs $25k-50k, 71.6% for AGIs $50k-75k, 58.1% for AGIs $75k-100k, 66.7% for AGIs over 100k)
Household received Food Stamps/SNAP in the past 12 months: 16 Household did not receive Food Stamps/SNAP in the past 12 months: 783
Women who had a birth in the past 12 months: 53 (54 now married, 0 unmarried) Women who did not have a birth in the past 12 months: 393 (233 now married, 158 unmarried)
Housing units in zip code 67001 with a mortgage: 315 (23 second mortgage, 2 home equity loan, 20 both second mortgage and home equity loan) Houses without a mortgage: 4
Median monthly owner costs for units with a mortgage: $1,641 Median monthly owner costs for units without a mortgage: $724
Residents with income below the poverty level in 2022:
This zip code:
5.9%
Whole state:
12.0%
Residents with income below 50% of the poverty level in 2022:
This zip code:
5.2%
Whole state:
6.4%
Median number of rooms in houses and condos:
Here:
10.0
State:
6.9
Median number of rooms in apartments:
Here:
5.9
State:
4.4
Notable locations in this zip code not listed on our city pages
Notable locations in zip code 67001: Andale Sewer Treatment Facility (A), Andale Police Department (B), Sedgewick County Public Library - Andale District (C), Sedgwick County Fire District 1 Station 31 (D), Andale Care Center (E). Display/hide their locations on the map
Size of family households: 162 2-persons, 320 3-persons, 73 4-persons, 35 5-persons, 31 6-persons, 73 7-or-more-persons
Size of nonfamily households: 85 1-person, 10 2-persons, 2 3-persons
614 married couples with children.
42 single-parent households (36 men, 6 women).
98.4% of residents of 67001 zip code speak English at home.
0.8% of residents speak Spanish at home (100% very well).
0.5% of residents speak other Indo-European language at home (100% very well).
0.3% of residents speak Asian or Pacific Island language at home (100% very well).
Foreign born population: 9 (0.4%) (0.0% of them are naturalized citizens)
:
0.4%
Whole state:
7.1%
89%Belgium
56%German
15%American
9%English
2%French
2%Irish
2%European
1%Lebanese
Year of entry for the foreign-born population
92010 or later
22000 to 2009
01990 to 1999
0Before 1990
Facilities with environmental interests located in this zip code:
ANDALE FARMERS COOP-MAIN FACILTY (219 MAIN ST in ANDALE, KS)
AIR MINOR (AIRS/AFS) STATE MASTER (Kansas Facility Profiler) - ISTEPS-17300047, AIR PROGRAM, RTK-SG00371, EPCRA, ISL-C208770056, STATE CLEANUP SITE Business SIC classification: GRAIN AND FIELD BEANS Business NAICS classification: GRAIN AND FIELD BEAN WHOLESALERS. Organizations: ANDALE FARMERS COOP CO (RTK PARENT ORGANIZATION)
Alternative names: ANDALE FARMERS COOPERATIVE CO., ANDALE FARMERS COOPERATIVE CO.
ANDALE FARMERS COOP-ANDALE BULK (5700 NORTH ANDALE ROAD in ANDALE, KS)
STATE MASTER (Kansas Facility Profiler) - RTK-SG00373, EPCRA COMPLIANCE ACTIVITY (Tracking inspections of insecticide, fungicide, and rodenticide, and toxic substances) Business SIC classification: GRAIN AND FIELD BEANS Organizations: ANDALE FARMERS COOP CO
ANDALE ELEM-MIDDLE (500 WEST RUSH in ANDALE, KS)
(National Center for Education Statistics) - STATE ID-2062 Organizations: RENWICK (SCHOOL DISTRICT)
ANDALE HIGH (600 WEST RUSH in ANDALE, KS)
(National Center for Education Statistics) - STATE ID-2064 Organizations: RENWICK (SCHOOL DISTRICT)
ANDALE HIGH SCHOOL (400 W RUSH in ANDALE, KS)
(Integrated Compliance Information System) - ICIS-07-1990-0360, FORMAL ENFORCEMENT ACTION
ANDALE AUTO SERVICE INC. (307 MAIN in ANDALE, KS)
Conditionally Exempt Small Quantity Generators, less than 100 kg/month of hazardous waste (Resource Conservation and Recovery Act (tracking hazardous waste)) Organizations: STEVEN G. HILGER (CONTACT/OPERATOR)
, ANDALE AUTO (CONTACT/OWNER)
Alternative names: ANDALE AUTO
ANDALE SEWER TREATMENT C/O CITY HALL (304 NORTH MAIN STREET in ANDALE, KS)
National Pollutant Discharge Elimination System NON-MAJOR (Tracking pollutant discharge elimination systems) - permit Business SIC classification: SEWERAGE SYSTEMS Organizations: ANDALE, CITY OF (CONTACT/OWNER)
UTILITY MAINT CONTRACTORS LLC (3701 W DORA in WICHITA, KS)
Conditionally Exempt Small Quantity Generators, less than 100 kg/month of hazardous waste (Resource Conservation and Recovery Act (tracking hazardous waste)) Organizations: DON COLEMAN (CONTACT/OWNER)
JOHN MARTIN (23018 WEST 61ST STREET NORTH in ANDALE, KS)
National Pollutant Discharge Elimination System NON-MAJOR (Tracking pollutant discharge elimination systems) - permit Business SIC classification: HOGS Alternative names: MARTIN, JOHN
ANDALE PESTICIDE (16 MI NW OF WICHITA ON 296 in ANDALE, KS)
SUPERFUND (Superfund database)
Housing units lacking complete plumbing facilities: 0.7% Housing units lacking complete kitchen facilities: 0.8%
53.0%Bottled, tank, or LP gas
36.2%Utility gas
11.0%Electricity
Population in 1990: 1,251.
Place of birth for U.S.-born residents:
This state: 1,890
Midwest: 225
South: 176
West: 84
66% of the 67001 zip code residents lived in the same house 5 years ago. Out of people who lived in different houses, 75% lived in this county. Out of people who lived in different counties, 50% lived in Kansas.
89% of the 67001 zip code residents lived in the same house 1 year ago. Out of people who lived in different houses, 85% moved from this county. Out of people who lived in different houses, 4% moved from different county within same state. Out of people who lived in different houses, 9% moved from abroad.
Private vs. public school enrollment:
Students in private schools in grades 1 to 8 (elementary and middle school): 91
Here:
22.7%
Kansas:
14.1%
Students in private schools in grades 9 to 12 (high school): 9
Here:
4.4%
Kansas:
10.8%
Students in private undergraduate colleges: 13
Here:
18.8%
Kansas:
15.4%
Occupation by median earnings in the past 12 months ($)
107,929Computer and mathematical occupations
83,953Law enforcement workers including supervisors
80,959Management occupations
71,358Health diagnosing and treating practitioners and other technical occupations
65,261Architecture and engineering occupations
61,085Installation, maintenance, and repair occupations
Companies with federal contracts located in this zip code:
DEALER MANAGEMENT, INC (24800 W 53RD ST NORTH in ANDALE, KS; small business) : $48,071 in 4 contractsfrom 2003 to 2005
$15,866 with Army for Gardening Implements and Tools. Signed on 2003-08-13. Completion date: 2003-09-19.
$13,660 with Army for Motorcycles, Motor Scooters, and Bicycles. Signed on 2005-09-14. Completion date: 2005-10-14.
$9,770 with Army for Gardening Implements and Tools. Signed on 2003-06-26. Completion date: 2003-07-25.
$8,775, same as above.Signed on 2003-02-12. Completion date: 2003-03-12.
PAT REICHENBERGER LUMBER, INC (125 ANDALE RD in ANDALE, KS; small business) : $11,967 in 4 contractsfrom 2002 to 2003
$6,499 with Army for Plywood and Veneer. Signed on 2003-07-10. Completion date: 2003-08-08.
$2,921 with Army for Lumber and Related Basic Wood Materials. Signed on 2002-08-29. Completion date: 2002-09-27.
$2,802 with Army for Plywood and Veneer. Signed on 2003-06-10. Completion date: 2003-07-21.
-$255, same as above.Signed on 2003-08-12. Completion date: 2003-07-21.
Top industries in this zip code by the number of employees in 2005:
Wholesale Trade: Farm and Garden Machinery and Equipment Merchant Wholesalers (20-49 employees: 1 establishment)
Finance and Insurance: Commercial Banking (10-19: 1, 5-9: 1)
Wholesale Trade: Grain and Field Bean Merchant Wholesalers (10-19: 1)
Accommodation and Food Services: Limited-Service Restaurants (10-19: 1)
Accommodation and Food Services: Full-Service Restaurants (5-9: 1, 1-4: 1)
Other Services (except Public Administration): Beauty Salons (5-9: 1)
Other Services (except Public Administration): General Automotive Repair (5-9: 1)
Health Care and Social Assistance: Offices of Physicians (except Mental Health Specialists) (5-9: 1)
Home Mortgage Disclosure Act Aggregated Statistics For Year 2009 (Based on 2 partial tracts)
A) FHA, FSA/RHS & VA Home Purchase Loans
B) Conventional Home Purchase Loans
C) Refinancings
D) Home Improvement Loans
F) Non-occupant Loans on < 5 Family Dwellings (A B C & D)
G) Loans On Manufactured Home Dwelling (A B C & D)
Number
Average Value
Number
Average Value
Number
Average Value
Number
Average Value
Number
Average Value
Number
Average Value
LOANS ORIGINATED
12
$127,212
15
$163,660
65
$160,806
9
$39,690
3
$74,983
1
$9,020
APPLICATIONS APPROVED, NOT ACCEPTED
0
$0
1
$167,840
4
$154,810
1
$53,110
0
$0
0
$0
APPLICATIONS DENIED
1
$72,140
1
$147,290
9
$155,088
2
$20,040
0
$0
0
$0
APPLICATIONS WITHDRAWN
0
$0
3
$124,080
15
$132,999
1
$67,640
2
$53,105
0
$0
FILES CLOSED FOR INCOMPLETENESS
0
$0
0
$0
2
$181,110
0
$0
0
$0
0
$0
Aggregated Statistics For Year 2008 (Based on 2 partial tracts)
A) FHA, FSA/RHS & VA Home Purchase Loans
B) Conventional Home Purchase Loans
C) Refinancings
D) Home Improvement Loans
F) Non-occupant Loans on < 5 Family Dwellings (A B C & D)
G) Loans On Manufactured Home Dwelling (A B C & D)
Number
Average Value
Number
Average Value
Number
Average Value
Number
Average Value
Number
Average Value
Number
Average Value
LOANS ORIGINATED
8
$127,880
20
$155,686
29
$154,947
3
$46,760
4
$79,532
1
$40,580
APPLICATIONS APPROVED, NOT ACCEPTED
0
$0
2
$160,070
4
$77,780
1
$2,500
1
$6,510
0
$0
APPLICATIONS DENIED
2
$101,455
1
$90,180
9
$134,323
4
$87,675
1
$90,180
0
$0
APPLICATIONS WITHDRAWN
1
$43,590
1
$222,940
9
$159,819
3
$110,387
1
$45,090
1
$48,100
FILES CLOSED FOR INCOMPLETENESS
0
$0
0
$0
1
$86,670
0
$0
0
$0
0
$0
Aggregated Statistics For Year 2007 (Based on 2 partial tracts)
A) FHA, FSA/RHS & VA Home Purchase Loans
B) Conventional Home Purchase Loans
C) Refinancings
D) Home Improvement Loans
E) Loans on Dwellings For 5+ Families
F) Non-occupant Loans on < 5 Family Dwellings (A B C & D)
G) Loans On Manufactured Home Dwelling (A B C & D)
Number
Average Value
Number
Average Value
Number
Average Value
Number
Average Value
Number
Average Value
Number
Average Value
Number
Average Value
LOANS ORIGINATED
5
$113,326
31
$153,015
29
$105,988
14
$46,879
1
$1,000
8
$71,330
1
$30,060
APPLICATIONS APPROVED, NOT ACCEPTED
0
$0
4
$110,095
6
$69,807
2
$9,770
0
$0
0
$0
1
$30,560
APPLICATIONS DENIED
0
$0
4
$84,168
12
$111,180
4
$69,640
0
$0
0
$0
3
$51,437
APPLICATIONS WITHDRAWN
0
$0
1
$126,250
6
$113,310
2
$66,380
0
$0
1
$40,080
0
$0
FILES CLOSED FOR INCOMPLETENESS
0
$0
0
$0
3
$118,403
0
$0
0
$0
0
$0
0
$0
Aggregated Statistics For Year 2006 (Based on 2 partial tracts)
A) FHA, FSA/RHS & VA Home Purchase Loans
B) Conventional Home Purchase Loans
C) Refinancings
D) Home Improvement Loans
F) Non-occupant Loans on < 5 Family Dwellings (A B C & D)
G) Loans On Manufactured Home Dwelling (A B C & D)
Number
Average Value
Number
Average Value
Number
Average Value
Number
Average Value
Number
Average Value
Number
Average Value
LOANS ORIGINATED
4
$147,795
38
$120,174
21
$117,926
7
$56,470
3
$62,793
1
$49,100
APPLICATIONS APPROVED, NOT ACCEPTED
0
$0
3
$178,190
4
$94,312
1
$36,070
1
$52,600
1
$25,050
APPLICATIONS DENIED
1
$62,120
5
$115,730
11
$115,321
5
$81,764
1
$20,040
0
$0
APPLICATIONS WITHDRAWN
0
$0
1
$100,700
6
$141,700
1
$133,770
1
$20,040
0
$0
FILES CLOSED FOR INCOMPLETENESS
0
$0
1
$60,620
1
$86,170
1
$34,070
0
$0
0
$0
Aggregated Statistics For Year 2005 (Based on 2 partial tracts)
A) FHA, FSA/RHS & VA Home Purchase Loans
B) Conventional Home Purchase Loans
C) Refinancings
D) Home Improvement Loans
F) Non-occupant Loans on < 5 Family Dwellings (A B C & D)
G) Loans On Manufactured Home Dwelling (A B C & D)
Number
Average Value
Number
Average Value
Number
Average Value
Number
Average Value
Number
Average Value
Number
Average Value
LOANS ORIGINATED
2
$118,485
39
$105,749
31
$118,931
6
$27,638
3
$45,757
1
$76,150
APPLICATIONS APPROVED, NOT ACCEPTED
0
$0
2
$118,235
3
$193,220
1
$7,510
0
$0
1
$19,040
APPLICATIONS DENIED
2
$110,220
4
$89,178
9
$106,379
5
$18,236
1
$31,060
1
$30,060
APPLICATIONS WITHDRAWN
0
$0
1
$54,610
10
$82,966
1
$5,010
2
$35,820
1
$20,540
FILES CLOSED FOR INCOMPLETENESS
0
$0
1
$19,040
3
$72,477
1
$10,020
0
$0
0
$0
Aggregated Statistics For Year 2004 (Based on 2 partial tracts)
A) FHA, FSA/RHS & VA Home Purchase Loans
B) Conventional Home Purchase Loans
C) Refinancings
D) Home Improvement Loans
F) Non-occupant Loans on < 5 Family Dwellings (A B C & D)
G) Loans On Manufactured Home Dwelling (A B C & D)
Number
Average Value
Number
Average Value
Number
Average Value
Number
Average Value
Number
Average Value
Number
Average Value
LOANS ORIGINATED
2
$110,470
30
$133,734
39
$124,582
10
$32,014
3
$73,813
1
$104,210
APPLICATIONS APPROVED, NOT ACCEPTED
0
$0
3
$98,363
7
$94,760
1
$8,020
1
$32,060
1
$17,030
APPLICATIONS DENIED
1
$78,660
6
$79,910
13
$107,676
1
$7,510
2
$91,685
3
$31,730
APPLICATIONS WITHDRAWN
0
$0
1
$228,960
10
$135,120
1
$41,580
0
$0
0
$0
FILES CLOSED FOR INCOMPLETENESS
0
$0
1
$122,750
4
$76,902
0
$0
1
$55,110
0
$0
Aggregated Statistics For Year 2003 (Based on 2 partial tracts)
A) FHA, FSA/RHS & VA Home Purchase Loans
B) Conventional Home Purchase Loans
C) Refinancings
D) Home Improvement Loans
F) Non-occupant Loans on < 5 Family Dwellings (A B C & D)
Number
Average Value
Number
Average Value
Number
Average Value
Number
Average Value
Number
Average Value
LOANS ORIGINATED
3
$77,320
24
$116,608
89
$110,000
5
$20,140
6
$62,708
APPLICATIONS APPROVED, NOT ACCEPTED
0
$0
2
$114,480
5
$106,312
0
$0
1
$24,050
APPLICATIONS DENIED
1
$49,600
2
$135,270
12
$114,144
0
$0
2
$64,880
APPLICATIONS WITHDRAWN
0
$0
2
$104,460
7
$85,241
0
$0
0
$0
FILES CLOSED FOR INCOMPLETENESS
0
$0
1
$32,560
2
$135,270
0
$0
0
$0
Aggregated Statistics For Year 2002 (Based on 2 partial tracts)
A) FHA, FSA/RHS & VA Home Purchase Loans
B) Conventional Home Purchase Loans
C) Refinancings
D) Home Improvement Loans
F) Non-occupant Loans on < 5 Family Dwellings (A B C & D)
Number
Average Value
Number
Average Value
Number
Average Value
Number
Average Value
Number
Average Value
LOANS ORIGINATED
4
$68,262
19
$92,658
50
$107,705
10
$18,236
5
$66,934
APPLICATIONS APPROVED, NOT ACCEPTED
0
$0
3
$85,003
5
$111,924
1
$13,530
0
$0
APPLICATIONS DENIED
0
$0
3
$61,623
8
$102,455
1
$21,040
0
$0
APPLICATIONS WITHDRAWN
0
$0
1
$25,050
4
$98,948
1
$35,070
0
$0
FILES CLOSED FOR INCOMPLETENESS
0
$0
0
$0
1
$74,150
0
$0
0
$0
Aggregated Statistics For Year 2001 (Based on 2 partial tracts)
A) FHA, FSA/RHS & VA Home Purchase Loans
B) Conventional Home Purchase Loans
C) Refinancings
D) Home Improvement Loans
F) Non-occupant Loans on < 5 Family Dwellings (A B C & D)
Number
Average Value
Number
Average Value
Number
Average Value
Number
Average Value
Number
Average Value
LOANS ORIGINATED
2
$75,400
22
$102,181
54
$102,566
10
$20,291
5
$38,576
APPLICATIONS APPROVED, NOT ACCEPTED
0
$0
3
$70,807
5
$69,338
2
$31,315
0
$0
APPLICATIONS DENIED
0
$0
3
$44,253
15
$74,649
3
$25,717
1
$29,060
APPLICATIONS WITHDRAWN
0
$0
1
$77,660
10
$97,344
1
$10,020
0
$0
FILES CLOSED FOR INCOMPLETENESS
0
$0
0
$0
2
$94,940
0
$0
0
$0
Aggregated Statistics For Year 2000 (Based on 2 partial tracts)
A) FHA, FSA/RHS & VA Home Purchase Loans
B) Conventional Home Purchase Loans
C) Refinancings
D) Home Improvement Loans
F) Non-occupant Loans on < 5 Family Dwellings (A B C & D)
Number
Average Value
Number
Average Value
Number
Average Value
Number
Average Value
Number
Average Value
LOANS ORIGINATED
2
$67,885
29
$104,122
18
$101,508
10
$16,884
4
$83,418
APPLICATIONS APPROVED, NOT ACCEPTED
0
$0
4
$63,752
1
$33,070
1
$8,520
0
$0
APPLICATIONS DENIED
1
$33,570
8
$46,530
6
$56,697
1
$16,530
1
$42,590
APPLICATIONS WITHDRAWN
0
$0
4
$108,090
9
$101,147
2
$18,035
1
$20,040
FILES CLOSED FOR INCOMPLETENESS
0
$0
0
$0
1
$109,220
0
$0
1
$50,100
Aggregated Statistics For Year 1999 (Based on 1 partial tract)
A) FHA, FSA/RHS & VA Home Purchase Loans
B) Conventional Home Purchase Loans
C) Refinancings
D) Home Improvement Loans
F) Non-occupant Loans on < 5 Family Dwellings (A B C & D)
Detailed PMIC statistics for the following Tracts:0105.00
2002 - 2018 National Fire Incident Reporting System (NFIRS) incidents
According to the data from the years 2002 - 2018 the average number of fire incidents per year is 10. The highest number of fire incidents - 16 took place in 2005, and the least - 2 in 2009. The data has a declining trend.
When looking into fire subcategories, the most reports belonged to: Outside Fires (62.0%), and Structure Fires (20.9%).
Fire incident types reported to NFIRS in Zip Code 67001


 Nearest zip codes: 67108, 67030, 67050, 67052, 67223, 67235.


 According to the data from the years 2002 - 2018 the average number of fire incidents per year is 10. The highest number of fire incidents - 16 took place in 2005, and the least - 2 in 2009. The data has a declining trend.
 When looking into fire subcategories, the most reports belonged to: Outside Fires (62.0%), and Structure Fires (20.9%).