Estimated zip code population in 2022: 1,478 Zip code population in 2010: 1,375 Zip code population in 2000: 1,118
Houses and condos: 533 Renter-occupied apartments: 83
% of renters here:
17%
State:
34%
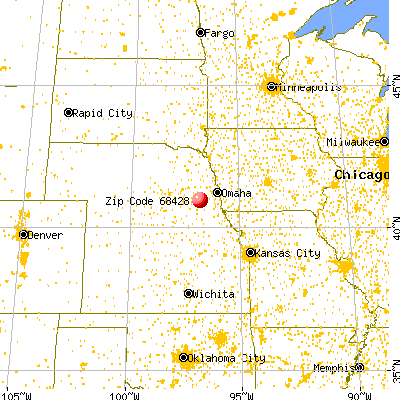
March 2022 cost of living index in zip code 68428: 73.9 (low, U.S. average is 100)
Land area: 51.7 sq. mi. Water area: 2.9 sq. mi.
Population density: 29 people per square mile
(very low).
OSM Map
General Map
Google Map
MSN Map
OSM Map
General Map
Google Map
MSN Map
OSM Map
General Map
Google Map
MSN Map
OSM Map
General Map
Google Map
MSN Map
Please wait while loading the map...
Real estate property taxes paid for housing units in 2022:
This zip code:
1.1% ($4,781)
Nebraska:
1.4% ($3,313)
Median real estate property taxes paid for housing units with mortgages in 2022: $3,819 (0.8%) Median real estate property taxes paid for housing units with no mortgage in 2022: $5,271 (1.5%)
Business Search- 14 Million verified businesses
Males: 755
(51.1%)
Females: 723
(48.9%)
For population 25 years and over in 68428:
High school or higher: 97.3%
Bachelor's degree or higher: 32.9%
Graduate or professional degree: 15.1%
Unemployed: 4.2%
Mean travel time to work (commute): 22.7 minutes
For population 15 years and over in 68428:
Never married: 20.9%
Now married: 70.9%
Separated: 0.0%
Widowed: 4.5%
Divorced: 3.7%
Zip code 68428 compared to state average:
Median household income above state average.
Median house value above state average.
Unemployed percentage above state average.
Black race population percentage significantly below state average.
Hispanic race population percentage significantly below state average.
Foreign-born population percentage below state average.
Renting percentage below state average.
Length of stay since moving in significantly above state average.
Number of college students significantly below state average.
Averages for the 2020 tax year for zip code 68428, filed in 2021:
Average Adjusted Gross Income (AGI) in 2020: $86,050 (Individual Income Tax Returns)
Here:
$86,050
State:
$73,874
Salary/wage: $70,651 (reported on 81.2% of returns)
Here:
$70,651
State:
$58,268
(% of AGI for various income ranges: 1187.9% for AGIs below $25k, 3468.0% for AGIs $25k-50k, 6960.0% for AGIs $50k-75k, 8757.1% for AGIs $75k-100k, 15430.0% for AGIs $100k-200k)
Taxable interest for individuals: $1,155 (reported on 47.5% of returns)
This zip code:
$1,155
Nebraska:
$1,748
(% of AGI for various income ranges: 30.0% for AGIs below $25k, 52.0% for AGIs $25k-50k, 128.3% for AGIs $50k-75k, 32.9% for AGIs $75k-100k, 120.7% for AGIs $100k-200k)
Ordinary dividends: $4,714 (reported on 26.2% of returns)
Here:
$4,714
State:
$7,841
(% of AGI for various income ranges: 65.0% for AGIs below $25k, 96.0% for AGIs $25k-50k, 100.0% for AGIs $50k-75k, 72.9% for AGIs $75k-100k, 323.6% for AGIs $100k-200k)
Net capital gain/loss in AGI: +$10,456 (reported on 22.5% of returns)
Here:
+$10,456
State:
+$21,703
(% of AGI for various income ranges: 55.7% for AGIs below $25k, 113.3% for AGIs $50k-75k, 128.6% for AGIs $75k-100k, 497.1% for AGIs $100k-200k)
Profit/loss from business: +$15,717 (reported on 15.0% of returns)
Here:
+$15,717
State:
+$11,239
(% of AGI for various income ranges: 240.7% for AGIs below $25k, 956.7% for AGIs $50k-75k, 696.4% for AGIs $100k-200k)
Taxable individual retirement arrangement distribution: $16,830 (reported on 12.5% of returns)
68428:
$16,830
Nebraska:
$18,251
(% of AGI for various income ranges: 488.0% for AGIs $25k-50k, 781.4% for AGIs $75k-100k, 462.9% for AGIs $100k-200k)
Total itemized deductions: $33,440 (reported on 6.2% of returns)
Here:
$33,440
State:
$37,704
(% of AGI for various income ranges: 1005.0% for AGIs $50k-75k, 763.6% for AGIs $100k-200k)
Charity contributions: $7,180 (reported on 6.2% of returns)
Here:
$7,180
State:
$15,251
(% of AGI for various income ranges: 256.4% for AGIs $100k-200k)
Taxes paid: $9,940 (reported on 6.2% of returns)
68428:
$9,940
State:
$8,015
(% of AGI for various income ranges: 285.0% for AGIs $50k-75k, 232.9% for AGIs $100k-200k)
Earned income credit: $1,850 (reported on 5.0% of returns)
Here:
$1,850
State:
$2,260
(% of AGI for various income ranges: 52.9% for AGIs below $25k)
Percentage of individuals using paid preparers for their 2020 taxes: 95.0%
Here:
95%
State:
95%
(% for various income ranges: 95.0% for AGIs below $25k, 92.9% for AGIs $25k-50k, 90.0% for AGIs $50k-75k, 100.0% for AGIs $75k-100k, 95.2% for AGIs $100k-200k, 100.0% for AGIs over 200k)
Averages for the 2012 tax year for zip code 68428, filed in 2013:
Average Adjusted Gross Income (AGI) in 2012: $72,657 (Individual Income Tax Returns)
Here:
$72,657
State:
$60,572
Salary/wage: $58,108 (reported on 82.9% of returns)
Here:
$58,108
State:
$47,046
(% of AGI for various income ranges: 66.8% for AGIs below $25k, 70.7% for AGIs $25k-50k, 72.2% for AGIs $50k-75k, 77.6% for AGIs $75k-100k, 79.2% for AGIs $100k-200k, 35.8% for AGIs over 200k)
Taxable interest for individuals: $742 (reported on 52.6% of returns)
This zip code:
$742
Nebraska:
$1,535
(% of AGI for various income ranges: 1.7% for AGIs below $25k, 1.3% for AGIs $25k-50k, 1.0% for AGIs $50k-75k, 0.5% for AGIs $75k-100k, 0.3% for AGIs $100k-200k, 0.1% for AGIs over 200k)
Ordinary dividends: $4,081 (reported on 27.6% of returns)
Here:
$4,081
State:
$5,776
(% of AGI for various income ranges: 1.1% for AGIs below $25k, 1.9% for AGIs $25k-50k, 0.8% for AGIs $50k-75k, 0.6% for AGIs $75k-100k, 3.4% for AGIs $100k-200k)
Net capital gain/loss in AGI: +$8,994 (reported on 22.4% of returns)
Here:
+$8,994
State:
+$16,171
(% of AGI for various income ranges: 0.4% for AGIs $50k-75k, 8.1% for AGIs $100k-200k)
Profit/loss from business: +$8,108 (reported on 17.1% of returns)
Here:
+$8,108
State:
+$9,897
(% of AGI for various income ranges: 4.6% for AGIs below $25k, 3.8% for AGIs $25k-50k, 2.6% for AGIs $50k-75k, 2.5% for AGIs $75k-100k, 1.9% for AGIs $100k-200k)
Taxable individual retirement arrangement distribution: $9,044 (reported on 11.8% of returns)
68428:
$9,044
Nebraska:
$12,804
(% of AGI for various income ranges: 2.9% for AGIs below $25k, 11.0% for AGIs $25k-50k, 3.0% for AGIs $75k-100k)
Total itemized deductions: $21,068 (18% of AGI, reported on 44.7% of returns)
Here:
$21,068
State:
$23,343
Here:
17.7% of AGI
State:
18.7% of AGI
(% of AGI for various income ranges: 21.0% for AGIs $25k-50k, 11.8% for AGIs $50k-75k, 14.5% for AGIs $75k-100k, 15.4% for AGIs $100k-200k, 9.2% for AGIs over 200k)
Charity contributions: $3,093 (reported on 36.8% of returns)
Here:
$3,093
State:
$4,921
(% of AGI for various income ranges: 1.2% for AGIs $25k-50k, 1.1% for AGIs $50k-75k, 1.2% for AGIs $75k-100k, 2.5% for AGIs $100k-200k, 1.2% for AGIs over 200k)
Taxes paid: $10,168 (reported on 44.7% of returns)
68428:
$10,168
State:
$9,758
(% of AGI for various income ranges: 6.9% for AGIs $25k-50k, 5.0% for AGIs $50k-75k, 6.3% for AGIs $75k-100k, 7.8% for AGIs $100k-200k, 5.9% for AGIs over 200k)
Earned income credit: $2,025 (reported on 5.3% of returns)
Here:
$2,025
State:
$2,188
(% of AGI for various income ranges: 3.0% for AGIs below $25k)
Percentage of individuals using paid preparers for their 2012 taxes: 65.8%
Here:
66%
State:
57%
(% for various income ranges: 54.2% for AGIs below $25k, 72.7% for AGIs $25k-50k, 66.7% for AGIs $50k-75k, 72.7% for AGIs $75k-100k, 66.7% for AGIs $100k-200k, 100.0% for AGIs over 200k)
Averages for the 2004 tax year for zip code 68428, filed in 2005:
Average Adjusted Gross Income (AGI) in 2004: $54,606 (Individual Income Tax Returns)
Here:
$54,606
State:
$44,271
Salary/wage: $47,103 (reported on 88.0% of returns)
Here:
$47,103
State:
$38,230
(% of AGI for various income ranges: 138.1% for AGIs below $10k, 74.6% for AGIs $10k-25k, 82.4% for AGIs $25k-50k, 86.5% for AGIs $50k-75k, 89.7% for AGIs $75k-100k, 59.5% for AGIs over 100k)
Taxable interest for individuals: $801 (reported on 60.2% of returns)
This zip code:
$801
Nebraska:
$1,759
(% of AGI for various income ranges: 8.1% for AGIs below $10k, 2.6% for AGIs $10k-25k, 1.5% for AGIs $25k-50k, 0.5% for AGIs $50k-75k, 0.4% for AGIs $75k-100k, 0.7% for AGIs over 100k)
Taxable dividends: $1,090 (reported on 32.1% of returns)
Here:
$1,090
State:
$2,804
(% of AGI for various income ranges: 2.9% for AGIs below $10k, 0.8% for AGIs $10k-25k, 0.8% for AGIs $25k-50k, 0.2% for AGIs $50k-75k, 0.2% for AGIs $75k-100k, 0.9% for AGIs over 100k)
Net capital gain/loss: +$4,155 (reported on 25.5% of returns)
Here:
+$4,155
State:
+$7,887
(% of AGI for various income ranges: 6.5% for AGIs below $10k, -0.3% for AGIs $10k-25k, -0.2% for AGIs $25k-50k, -0.3% for AGIs $50k-75k, 3.1% for AGIs $75k-100k, 3.6% for AGIs over 100k)
Profit/loss from business: +$6,041 (reported on 18.6% of returns)
Here:
+$6,041
State:
+$7,743
(% of AGI for various income ranges: 6.0% for AGIs $10k-25k, 1.1% for AGIs $25k-50k, 2.8% for AGIs $50k-75k, 2.5% for AGIs over 100k)
IRA payment deduction: $3,800 (reported on 3.0% of returns)
68428:
$3,800
Nebraska:
$2,902
Total itemized deductions: $18,252 (20% of AGI, reported on 45.8% of returns)
Here:
$18,252
State:
$18,692
Here:
20.3% of AGI
State:
21.1% of AGI
(% of AGI for various income ranges: 14.7% for AGIs $10k-25k, 15.6% for AGIs $25k-50k, 14.4% for AGIs $50k-75k, 19.4% for AGIs $75k-100k, 14.0% for AGIs over 100k)
Charity contributions deductions: $2,596 (3% of AGI, reported on 39.4% of returns)
Here:
$2,596
State:
$3,500
Here:
2.7% of AGI
State:
3.8% of AGI
(% of AGI for various income ranges: 0.8% for AGIs $10k-25k, 1.6% for AGIs $25k-50k, 1.7% for AGIs $50k-75k, 2.2% for AGIs $75k-100k, 2.1% for AGIs over 100k)
Total tax: $7,624 (reported on 79.8% of returns)
68428:
$7,624
State:
$6,550
(% of AGI for various income ranges: 4.9% for AGIs below $10k, 5.0% for AGIs $10k-25k, 6.8% for AGIs $25k-50k, 8.5% for AGIs $50k-75k, 8.5% for AGIs $75k-100k, 16.6% for AGIs over 100k)
Earned income credit: $1,409 (reported on 6.7% of returns)
Here:
$1,409
State:
$1,643
Percentage of individuals using paid preparers for their 2004 taxes: 62.6%
Here:
63%
State:
62%
(% for various income ranges: 52.0% for AGIs below $10k, 54.9% for AGIs $10k-25k, 63.8% for AGIs $25k-50k, 71.4% for AGIs $50k-75k, 70.0% for AGIs $75k-100k, 66.2% for AGIs over 100k)
Household received Food Stamps/SNAP in the past 12 months: 12 Household did not receive Food Stamps/SNAP in the past 12 months: 489
Women who had a birth in the past 12 months: 32 (34 now married, 0 unmarried) Women who did not have a birth in the past 12 months: 228 (110 now married, 117 unmarried)
Housing units in zip code 68428 with a mortgage: 210 (47 second mortgage, 32 both second mortgage and home equity loan) Median monthly owner costs for units with a mortgage: $2,235 Median monthly owner costs for units without a mortgage: $794
Residents with income below the poverty level in 2022:
This zip code:
3.6%
Whole state:
11.2%
Residents with income below 50% of the poverty level in 2022:
This zip code:
0.3%
Whole state:
6.1%
Median number of rooms in houses and condos:
Here:
6.8
State:
7.1
Median number of rooms in apartments:
Here:
3.5
State:
4.2
Notable locations in this zip code not listed on our city pages
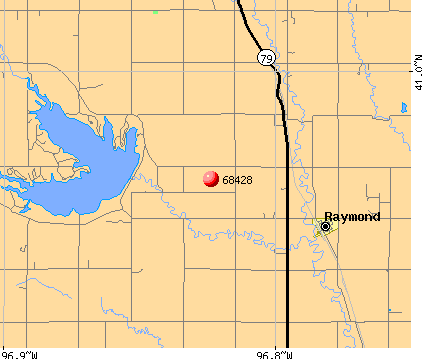
Notable locations in zip code 68428: Countryside Co-op Elevator (A), Raymond (B), Agnew (C), Area Eleven Campground (D), Area Ten Campground (E), Area Two Campground (F), Area Six Campground (G), Area Three Campground (H), Area Nine Campground (I), James Arthur Vineyard (J), Raymond Volunteer Fire and Rescue Station 1Headquarters (K). Display/hide their locations on the map
Parks in zip code 68428 include: Branched Oak Lake State Wildlife Management Area (1), Branched Oak Lake State Recreation Area (2). Display/hide their locations on the map
Size of family households: 257 2-persons, 42 3-persons, 45 4-persons, 38 5-persons, 64 7-or-more-persons
Size of nonfamily households: 53 1-person
305 married couples with children.
154 single-parent households (141 men, 13 women).
90.1% of residents of 68428 zip code speak English at home.
1.6% of residents speak Spanish at home (96% very well, 4% not well).
4.9% of residents speak other Indo-European language at home (100% very well).
3.9% of residents speak Asian or Pacific Island language at home (71% very well, 16% not well, 13% not at all).
Foreign born population: 53 (3.6%) (77.4% of them are naturalized citizens)
This zip code:
3.6%
Whole state:
7.2%
38%Thailand
13%Serbia
36%German
15%Czech
13%American
6%English
4%Polish
3%European
2%Irish
Year of entry for the foreign-born population
102010 or later
272000 to 2009
71990 to 1999
18Before 1990
Facilities with environmental interests located in this zip code:
DORCHESTER FARMERS COOP RAYMOND ANHYDROUS PLANT (14540 WEST RAILROAD STREET in RAYMOND, NE)
AIR MINOR (AIRS/AFS) STATE MASTER (Nebraska tracking) - AIR PROGRAM, -111691-CT-1116, LEAKING STORAGE TANK, -0005500096, EPCRA CRITERIA AND HAZARDOUS AIR POLLUTANT INVENTORY (Inventory of air pollution sources) Business SIC classification: GRAIN AND FIELD BEANS Alternative names: DORCHESTER FARMERS CO-OP
AGNEW ELEVETOR (6801 WEST AGNEW ROAD in AGNEW, NE)
AIR MINOR (AIRS/AFS) COMPLIANCE ACTIVITY (Tracking inspections of insecticide, fungicide, and rodenticide, and toxic substances) STATE MASTER (Nebraska tracking) - AIR PROGRAM, EPCRA Business SIC classification: GRAIN AND FIELD BEANS Alternative names: AGNEW ELEVATOR
DAVEY GRAIN (6205 W AGNEW ST in AGNEW, NE)
COMPLIANCE ACTIVITY (Tracking inspections of insecticide, fungicide, and rodenticide, and toxic substances)
Housing units lacking complete plumbing facilities: 6.5%
54.7%Electricity
31.4%Bottled, tank, or LP gas
5.0%Utility gas
5.0%Other fuel
4.5%Wood
Population in 1990: 1,218.
Place of birth for U.S.-born residents:
This state: 1,218
Northeast: 3
Midwest: 108
South: 27
West: 54
69% of the 68428 zip code residents lived in the same house 5 years ago. Out of people who lived in different houses, 58% lived in this county. Out of people who lived in different counties, 50% lived in Nebraska.
95% of the 68428 zip code residents lived in the same house 1 year ago. Out of people who lived in different houses, 52% moved from this county. Out of people who lived in different houses, 15% moved from different county within same state. Out of people who lived in different houses, 46% moved from different state.
Private vs. public school enrollment:
Students in private schools in grades 1 to 8 (elementary and middle school): 75
Here:
27.7%
Nebraska:
14.1%
Students in private schools in grades 9 to 12 (high school):
Here:
0.0%
Nebraska:
12.5%
Students in private undergraduate colleges: 1
Here:
45.7%
Nebraska:
18.0%
Occupation by median earnings in the past 12 months ($)
128,489Architecture and engineering occupations
90,550Healthcare support occupations
81,624Education, training, and library occupations
78,392Computer and mathematical occupations
77,798Health diagnosing and treating practitioners and other technical occupations
76,756Sales and related occupations
Top industries in this zip code by the number of employees in 2005:
Construction: Poured Concrete Foundation and Structure Contractors (10-19 employees: 1 establishment, 1-4 employees: 1 establishment)
Accommodation and Food Services: Limited-Service Restaurants (10-19: 1)
Construction: Plumbing, Heating, and Air-Conditioning Contractors (10-19: 1)
Health Care and Social Assistance: Child Day Care Services (10-19: 1)
Professional, Scientific, and Technical Services: Engineering Services (10-19: 1)
Construction: Framing Contractors (5-9: 1)
Accommodation and Food Services: Full-Service Restaurants (5-9: 1)
Construction: Masonry Contractors (5-9: 1)
Administrative and Support and Waste Management and Remediation Services: Septic Tank and Related Services (5-9: 1)
Fatal accident statistics in 2013:
Fatal accident count: 3
Vehicles involved in fatal accidents: 3
Fatal accidents caused by drunken drivers: 1
Fatalities: 4
Persons involved in fatal accidents: 10
Pedestrians involved in fatal accidents: 0
Fatal accident statistics in 2011:
Fatal accident count: 2
Vehicles involved in fatal accidents: 4
Fatal accidents caused by drunken drivers: 0
Fatalities: 3
Persons involved in fatal accidents: 8
Pedestrians involved in fatal accidents: 0
Home Mortgage Disclosure Act Aggregated Statistics For Year 2009 (Based on 2 partial tracts)
A) FHA, FSA/RHS & VA Home Purchase Loans
B) Conventional Home Purchase Loans
C) Refinancings
D) Home Improvement Loans
F) Non-occupant Loans on < 5 Family Dwellings (A B C & D)
G) Loans On Manufactured Home Dwelling (A B C & D)
Number
Average Value
Number
Average Value
Number
Average Value
Number
Average Value
Number
Average Value
Number
Average Value
LOANS ORIGINATED
26
$160,552
27
$185,024
173
$178,314
13
$32,581
6
$166,118
2
$53,995
APPLICATIONS APPROVED, NOT ACCEPTED
1
$190,170
1
$210,190
13
$194,997
1
$27,920
0
$0
0
$0
APPLICATIONS DENIED
3
$199,307
2
$121,425
34
$184,426
5
$17,596
0
$0
1
$2,630
APPLICATIONS WITHDRAWN
0
$0
2
$144,080
25
$163,097
1
$10,540
1
$199,660
1
$74,810
FILES CLOSED FOR INCOMPLETENESS
0
$0
0
$0
3
$115,193
0
$0
0
$0
0
$0
Aggregated Statistics For Year 2008 (Based on 2 partial tracts)
A) FHA, FSA/RHS & VA Home Purchase Loans
B) Conventional Home Purchase Loans
C) Refinancings
D) Home Improvement Loans
F) Non-occupant Loans on < 5 Family Dwellings (A B C & D)
G) Loans On Manufactured Home Dwelling (A B C & D)
Number
Average Value
Number
Average Value
Number
Average Value
Number
Average Value
Number
Average Value
Number
Average Value
LOANS ORIGINATED
12
$154,484
39
$191,971
96
$164,241
9
$17,443
13
$140,210
0
$0
APPLICATIONS APPROVED, NOT ACCEPTED
1
$161,200
3
$128,363
6
$182,448
2
$10,800
0
$0
0
$0
APPLICATIONS DENIED
0
$0
2
$195,970
23
$175,264
6
$25,198
0
$0
1
$6,320
APPLICATIONS WITHDRAWN
1
$169,100
3
$211,247
23
$176,593
2
$69,800
1
$96,400
0
$0
FILES CLOSED FOR INCOMPLETENESS
0
$0
1
$139,080
4
$158,040
2
$143,815
0
$0
0
$0
Aggregated Statistics For Year 2007 (Based on 2 partial tracts)
A) FHA, FSA/RHS & VA Home Purchase Loans
B) Conventional Home Purchase Loans
C) Refinancings
D) Home Improvement Loans
F) Non-occupant Loans on < 5 Family Dwellings (A B C & D)
G) Loans On Manufactured Home Dwelling (A B C & D)
Number
Average Value
Number
Average Value
Number
Average Value
Number
Average Value
Number
Average Value
Number
Average Value
LOANS ORIGINATED
3
$200,887
61
$151,649
83
$132,055
24
$47,544
17
$127,516
4
$58,608
APPLICATIONS APPROVED, NOT ACCEPTED
0
$0
3
$151,893
9
$119,408
3
$42,497
1
$22,130
0
$0
APPLICATIONS DENIED
0
$0
7
$106,263
26
$152,671
4
$63,610
4
$106,018
1
$15,800
APPLICATIONS WITHDRAWN
1
$134,330
3
$179,287
19
$169,685
1
$6,320
0
$0
0
$0
FILES CLOSED FOR INCOMPLETENESS
0
$0
0
$0
6
$212,037
1
$154,350
0
$0
0
$0
Aggregated Statistics For Year 2006 (Based on 2 partial tracts)
A) FHA, FSA/RHS & VA Home Purchase Loans
B) Conventional Home Purchase Loans
C) Refinancings
D) Home Improvement Loans
F) Non-occupant Loans on < 5 Family Dwellings (A B C & D)
G) Loans On Manufactured Home Dwelling (A B C & D)
Number
Average Value
Number
Average Value
Number
Average Value
Number
Average Value
Number
Average Value
Number
Average Value
LOANS ORIGINATED
3
$215,460
53
$148,995
88
$144,128
18
$32,018
13
$118,773
2
$52,155
APPLICATIONS APPROVED, NOT ACCEPTED
0
$0
3
$194,563
13
$152,691
2
$65,850
0
$0
0
$0
APPLICATIONS DENIED
1
$45,300
4
$141,710
31
$148,235
5
$30,554
1
$127,490
1
$71,120
APPLICATIONS WITHDRAWN
0
$0
6
$141,973
18
$139,573
2
$62,160
3
$191,230
1
$31,610
FILES CLOSED FOR INCOMPLETENESS
0
$0
1
$73,750
1
$170,680
1
$22,130
0
$0
0
$0
Aggregated Statistics For Year 2005 (Based on 2 partial tracts)
A) FHA, FSA/RHS & VA Home Purchase Loans
B) Conventional Home Purchase Loans
C) Refinancings
D) Home Improvement Loans
F) Non-occupant Loans on < 5 Family Dwellings (A B C & D)
G) Loans On Manufactured Home Dwelling (A B C & D)
Number
Average Value
Number
Average Value
Number
Average Value
Number
Average Value
Number
Average Value
Number
Average Value
LOANS ORIGINATED
10
$148,031
89
$132,748
94
$139,271
20
$35,190
7
$195,744
1
$26,870
APPLICATIONS APPROVED, NOT ACCEPTED
0
$0
4
$94,955
11
$126,096
1
$34,240
0
$0
0
$0
APPLICATIONS DENIED
0
$0
6
$110,277
25
$145,439
3
$67,080
2
$116,160
0
$0
APPLICATIONS WITHDRAWN
3
$168,927
7
$111,681
17
$184,256
3
$96,930
0
$0
0
$0
FILES CLOSED FOR INCOMPLETENESS
0
$0
0
$0
5
$133,702
0
$0
1
$41,620
0
$0
Aggregated Statistics For Year 2004 (Based on 2 partial tracts)
A) FHA, FSA/RHS & VA Home Purchase Loans
B) Conventional Home Purchase Loans
C) Refinancings
D) Home Improvement Loans
F) Non-occupant Loans on < 5 Family Dwellings (A B C & D)
G) Loans On Manufactured Home Dwelling (A B C & D)
Number
Average Value
Number
Average Value
Number
Average Value
Number
Average Value
Number
Average Value
Number
Average Value
LOANS ORIGINATED
12
$139,338
80
$131,825
105
$144,117
19
$35,102
8
$101,014
4
$66,378
APPLICATIONS APPROVED, NOT ACCEPTED
0
$0
9
$120,169
5
$168,366
0
$0
1
$124,320
1
$10,540
APPLICATIONS DENIED
0
$0
6
$131,262
26
$137,819
4
$47,542
2
$101,145
1
$19,490
APPLICATIONS WITHDRAWN
2
$94,295
6
$114,667
18
$93,390
2
$31,610
0
$0
1
$35,820
FILES CLOSED FOR INCOMPLETENESS
0
$0
1
$69,540
6
$190,087
1
$21,070
0
$0
0
$0
Aggregated Statistics For Year 2003 (Based on 2 partial tracts)
A) FHA, FSA/RHS & VA Home Purchase Loans
B) Conventional Home Purchase Loans
C) Refinancings
D) Home Improvement Loans
F) Non-occupant Loans on < 5 Family Dwellings (A B C & D)
Number
Average Value
Number
Average Value
Number
Average Value
Number
Average Value
Number
Average Value
LOANS ORIGINATED
10
$133,280
32
$130,054
191
$144,616
11
$27,776
4
$84,682
APPLICATIONS APPROVED, NOT ACCEPTED
1
$156,460
3
$79,723
13
$164,321
1
$23,180
1
$53,730
APPLICATIONS DENIED
1
$38,980
1
$129,590
25
$168,934
1
$4,210
1
$141,180
APPLICATIONS WITHDRAWN
0
$0
2
$99,830
19
$158,123
0
$0
1
$118,000
FILES CLOSED FOR INCOMPLETENESS
1
$65,850
1
$79,020
3
$156,283
0
$0
0
$0
Aggregated Statistics For Year 2002 (Based on 2 partial tracts)
A) FHA, FSA/RHS & VA Home Purchase Loans
B) Conventional Home Purchase Loans
C) Refinancings
D) Home Improvement Loans
E) Loans on Dwellings For 5+ Families
F) Non-occupant Loans on < 5 Family Dwellings (A B C & D)
Number
Average Value
Number
Average Value
Number
Average Value
Number
Average Value
Number
Average Value
Number
Average Value
LOANS ORIGINATED
2
$103,780
17
$127,795
136
$138,397
11
$29,836
1
$2,370,600
4
$70,065
APPLICATIONS APPROVED, NOT ACCEPTED
0
$0
2
$91,400
18
$130,910
1
$15,800
0
$0
1
$64,800
APPLICATIONS DENIED
0
$0
3
$94,650
21
$137,746
2
$18,965
0
$0
1
$79,020
APPLICATIONS WITHDRAWN
0
$0
1
$153,830
16
$142,894
1
$21,600
0
$0
0
$0
FILES CLOSED FOR INCOMPLETENESS
0
$0
0
$0
4
$107,335
1
$110,630
0
$0
0
$0
Aggregated Statistics For Year 2001 (Based on 2 partial tracts)
A) FHA, FSA/RHS & VA Home Purchase Loans
B) Conventional Home Purchase Loans
C) Refinancings
D) Home Improvement Loans
E) Loans on Dwellings For 5+ Families
F) Non-occupant Loans on < 5 Family Dwellings (A B C & D)
Number
Average Value
Number
Average Value
Number
Average Value
Number
Average Value
Number
Average Value
Number
Average Value
LOANS ORIGINATED
1
$136,440
14
$163,308
103
$122,714
12
$16,462
1
$28,450
4
$107,600
APPLICATIONS APPROVED, NOT ACCEPTED
0
$0
1
$164,360
7
$105,811
1
$71,120
0
$0
0
$0
APPLICATIONS DENIED
0
$0
2
$134,860
18
$104,921
4
$26,208
0
$0
1
$21,070
APPLICATIONS WITHDRAWN
0
$0
1
$114,840
12
$116,817
1
$23,180
0
$0
0
$0
FILES CLOSED FOR INCOMPLETENESS
0
$0
0
$0
4
$121,560
1
$20,020
0
$0
0
$0
Aggregated Statistics For Year 2000 (Based on 2 partial tracts)
A) FHA, FSA/RHS & VA Home Purchase Loans
B) Conventional Home Purchase Loans
C) Refinancings
D) Home Improvement Loans
F) Non-occupant Loans on < 5 Family Dwellings (A B C & D)
Number
Average Value
Number
Average Value
Number
Average Value
Number
Average Value
Number
Average Value
LOANS ORIGINATED
4
$105,360
18
$142,997
36
$117,549
12
$18,702
2
$59,790
APPLICATIONS APPROVED, NOT ACCEPTED
0
$0
2
$113,525
4
$104,570
2
$12,380
0
$0
APPLICATIONS DENIED
1
$55,310
4
$85,868
11
$103,492
3
$8,957
0
$0
APPLICATIONS WITHDRAWN
0
$0
1
$18,440
6
$92,453
1
$3,690
1
$54,260
FILES CLOSED FOR INCOMPLETENESS
0
$0
0
$0
3
$128,363
0
$0
0
$0
Aggregated Statistics For Year 1999 (Based on 1 partial tract)
Detailed PMIC statistics for the following Tracts:0102.00
2002 - 2018 National Fire Incident Reporting System (NFIRS) incidents
Based on the data from the years 2002 - 2018 the average number of fire incidents per year is 17. The highest number of fire incidents - 40 took place in 2012, and the least - 0 in 2007. The data has a declining trend.
When looking into fire subcategories, the most incidents belonged to: Outside Fires (66.7%), and Structure Fires (15.3%).
Fire incident types reported to NFIRS in Zip Code 68428


 Nearest zip codes: 68524, 68402, 68531, 68336, 68065, 68521.


 Based on the data from the years 2002 - 2018 the average number of fire incidents per year is 17. The highest number of fire incidents - 40 took place in 2012, and the least - 0 in 2007. The data has a declining trend.
 When looking into fire subcategories, the most incidents belonged to: Outside Fires (66.7%), and Structure Fires (15.3%).