Estimated zip code population in 2022: 3,778 Zip code population in 2010: 4,585 Zip code population in 2000: 4,173
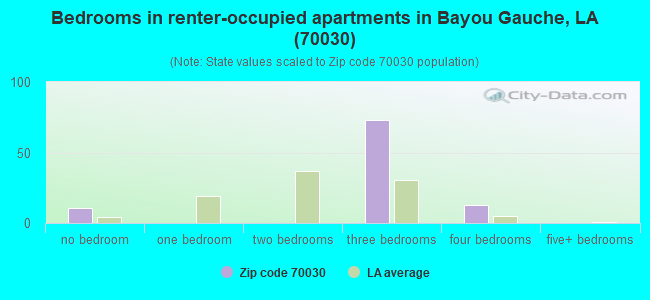
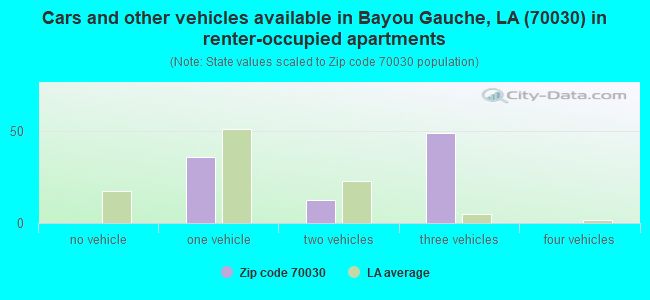
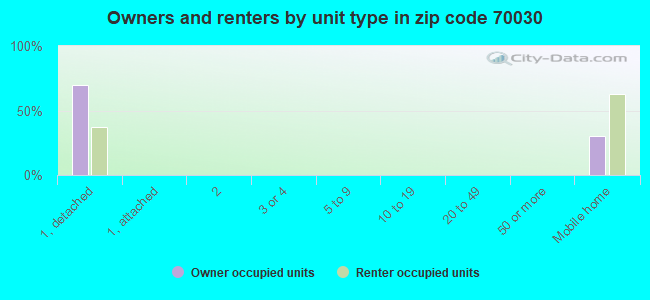
Houses and condos: 1,633 Renter-occupied apartments: 96
% of renters here:
7%
State:
32%
March 2022 cost of living index in zip code 70030: 82.8 (low, U.S. average is 100)
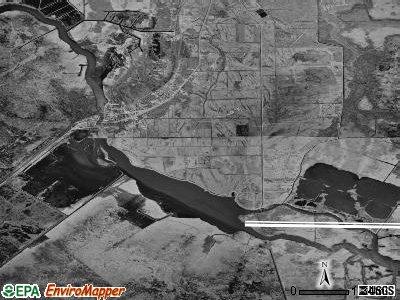
Land area: 31.5 sq. mi. Water area: 5.2 sq. mi.
Population density: 120 people per square mile
(very low).
OSM Map
General Map
Google Map
MSN Map
OSM Map
General Map
Google Map
MSN Map
OSM Map
General Map
Google Map
MSN Map
OSM Map
General Map
Google Map
MSN Map
Please wait while loading the map...
Real estate property taxes paid for housing units in 2022:
This zip code:
0.7% ($1,523)
Louisiana:
0.5% ($1,127)
Median real estate property taxes paid for housing units with mortgages in 2022: $1,841 (0.5%) Median real estate property taxes paid for housing units with no mortgage in 2022: $1,225 (0.4%)
Business Search- 14 Million verified businesses
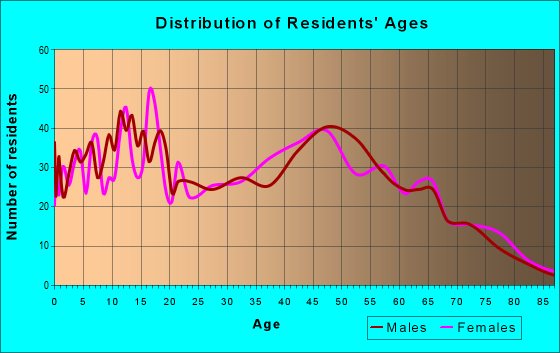
Males: 1,877
(49.7%)
Females: 1,901
(50.3%)
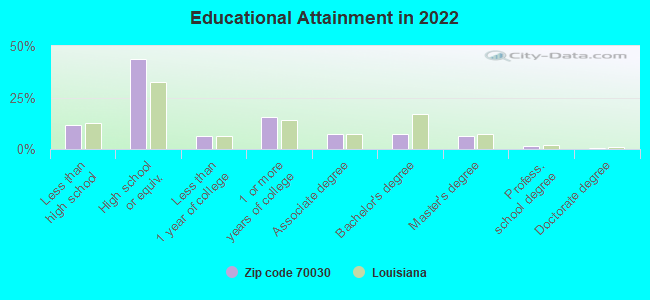
For population 25 years and over in 70030:
High school or higher: 87.4%
Bachelor's degree or higher: 15.6%
Graduate or professional degree: 8.3%
Unemployed: 2.3%
Mean travel time to work (commute): 26.6 minutes
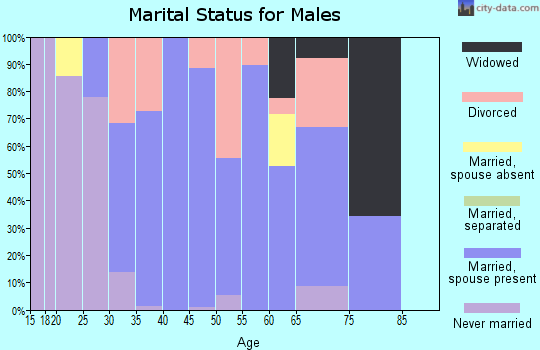
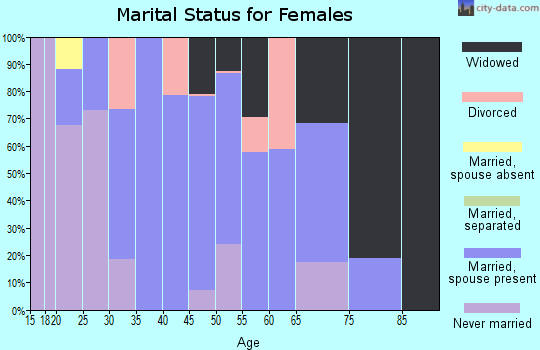
For population 15 years and over in 70030:
Never married: 38.4%
Now married: 48.8%
Separated: 1.8%
Widowed: 3.4%
Divorced: 7.7%
Zip code 70030 compared to state average:
Median household income above state average.
Unemployed percentage below state average.
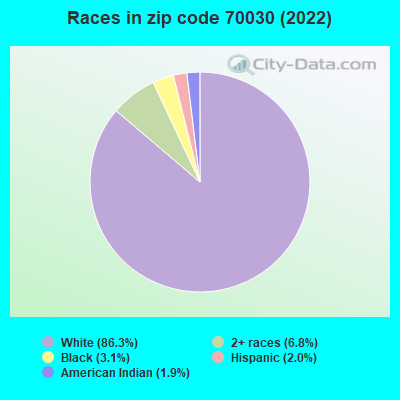
Black race population percentage significantly below state average.
Hispanic race population percentage below state average.
Foreign-born population percentage significantly below state average.
Renting percentage significantly below state average.
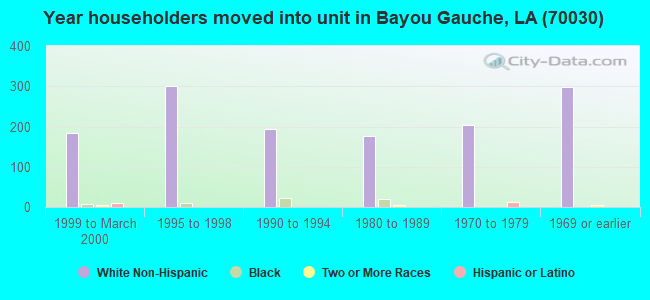
Length of stay since moving in above state average.
House age below state average.
Percentage of population with a bachelor's degree or higher below state average.
Averages for the 2020 tax year for zip code 70030, filed in 2021:
Average Adjusted Gross Income (AGI) in 2020: $65,557 (Individual Income Tax Returns)
Here:
$65,557
State:
$60,757
Salary/wage: $60,523 (reported on 80.0% of returns)
Here:
$60,523
State:
$50,882
(% of AGI for various income ranges: 958.1% for AGIs below $25k, 3248.1% for AGIs $25k-50k, 6625.3% for AGIs $50k-75k, 8653.1% for AGIs $75k-100k, 16857.9% for AGIs $100k-200k, 38700.0% for AGIs over 200k)
Taxable interest for individuals: $868 (reported on 28.6% of returns)
This zip code:
$868
Louisiana:
$1,576
(% of AGI for various income ranges: 10.4% for AGIs below $25k, 16.2% for AGIs $25k-50k, 21.8% for AGIs $50k-75k, 11.5% for AGIs $75k-100k, 74.6% for AGIs $100k-200k, 423.3% for AGIs over 200k)
Ordinary dividends: $3,952 (reported on 13.5% of returns)
Here:
$3,952
State:
$7,743
(% of AGI for various income ranges: 8.8% for AGIs below $25k, 21.6% for AGIs $25k-50k, 34.1% for AGIs $50k-75k, 20.8% for AGIs $75k-100k, 163.3% for AGIs $100k-200k, 1333.3% for AGIs over 200k)
Net capital gain/loss in AGI: +$10,192 (reported on 13.0% of returns)
Here:
+$10,192
State:
+$16,917
(% of AGI for various income ranges: 5.0% for AGIs below $25k, 4.7% for AGIs $25k-50k, 54.1% for AGIs $50k-75k, 27.7% for AGIs $75k-100k, 300.0% for AGIs $100k-200k, 5196.7% for AGIs over 200k)
Profit/loss from business: +$5,162 (reported on 18.4% of returns)
Here:
+$5,162
State:
+$7,679
(% of AGI for various income ranges: 109.2% for AGIs below $25k, 197.2% for AGIs $25k-50k, 142.4% for AGIs $50k-75k, 188.5% for AGIs $75k-100k, 47.1% for AGIs $100k-200k)
Taxable individual retirement arrangement distribution: $19,789 (reported on 10.3% of returns)
70030:
$19,789
Louisiana:
$20,716
(% of AGI for various income ranges: 82.5% for AGIs below $25k, 311.9% for AGIs $25k-50k, 610.8% for AGIs $75k-100k, 655.0% for AGIs $100k-200k)
Total itemized deductions: $25,990 (reported on 5.4% of returns)
Here:
$25,990
State:
$36,265
(% of AGI for various income ranges: 478.2% for AGIs $50k-75k, 744.2% for AGIs $100k-200k)
Charity contributions: $7,250 (reported on 4.3% of returns)
Here:
$7,250
State:
$13,106
(% of AGI for various income ranges: 36.9% for AGIs $25k-50k, 192.5% for AGIs $100k-200k)
Taxes paid: $6,712 (reported on 4.3% of returns)
70030:
$6,712
State:
$6,643
(% of AGI for various income ranges: 81.8% for AGIs $50k-75k, 165.8% for AGIs $100k-200k)
Earned income credit: $2,591 (reported on 17.3% of returns)
Here:
$2,591
State:
$2,671
(% of AGI for various income ranges: 120.4% for AGIs below $25k, 78.4% for AGIs $25k-50k)
Percentage of individuals using paid preparers for their 2020 taxes: 94.6%
Here:
95%
State:
92%
(% for various income ranges: 95.1% for AGIs below $25k, 92.9% for AGIs $25k-50k, 91.7% for AGIs $50k-75k, 94.1% for AGIs $75k-100k, 97.1% for AGIs $100k-200k, 100.0% for AGIs over 200k)
Averages for the 2012 tax year for zip code 70030, filed in 2013:
Average Adjusted Gross Income (AGI) in 2012: $56,948 (Individual Income Tax Returns)
Here:
$56,948
State:
$56,730
Salary/wage: $55,290 (reported on 84.0% of returns)
Here:
$55,290
State:
$45,545
(% of AGI for various income ranges: 68.0% for AGIs below $25k, 76.9% for AGIs $25k-50k, 80.1% for AGIs $50k-75k, 84.1% for AGIs $75k-100k, 88.5% for AGIs $100k-200k, 72.4% for AGIs over 200k)
Taxable interest for individuals: $1,002 (reported on 32.0% of returns)
This zip code:
$1,002
Louisiana:
$1,804
(% of AGI for various income ranges: 1.1% for AGIs below $25k, 0.7% for AGIs $25k-50k, 0.3% for AGIs $50k-75k, 0.3% for AGIs $75k-100k, 0.2% for AGIs $100k-200k, 1.8% for AGIs over 200k)
Ordinary dividends: $3,388 (reported on 14.3% of returns)
Here:
$3,388
State:
$7,610
(% of AGI for various income ranges: 1.5% for AGIs below $25k, 1.9% for AGIs $25k-50k, 0.3% for AGIs $50k-75k, 0.3% for AGIs $75k-100k, 0.3% for AGIs $100k-200k, 2.3% for AGIs over 200k)
Net capital gain/loss in AGI: +$4,683 (reported on 13.1% of returns)
Here:
+$4,683
State:
+$17,096
(% of AGI for various income ranges: 0.1% for AGIs $50k-75k, 0.4% for AGIs $100k-200k, 8.2% for AGIs over 200k)
Profit/loss from business: +$7,032 (reported on 19.4% of returns)
Here:
+$7,032
State:
+$12,088
(% of AGI for various income ranges: 12.3% for AGIs below $25k, 4.1% for AGIs $25k-50k, 1.8% for AGIs $50k-75k, 0.8% for AGIs $75k-100k, 1.3% for AGIs $100k-200k)
Taxable individual retirement arrangement distribution: $15,554 (reported on 7.4% of returns)
70030:
$15,554
Louisiana:
$16,085
(% of AGI for various income ranges: 2.7% for AGIs below $25k, 3.8% for AGIs $25k-50k, 5.9% for AGIs $50k-75k, 1.3% for AGIs $100k-200k)
Total itemized deductions: $21,150 (20% of AGI, reported on 28.6% of returns)
Here:
$21,150
State:
$23,585
Here:
20.1% of AGI
State:
18.1% of AGI
(% of AGI for various income ranges: 7.9% for AGIs below $25k, 9.9% for AGIs $25k-50k, 10.6% for AGIs $50k-75k, 9.9% for AGIs $75k-100k, 10.7% for AGIs $100k-200k, 14.1% for AGIs over 200k)
Charity contributions: $3,025 (reported on 22.9% of returns)
Here:
$3,025
State:
$5,533
(% of AGI for various income ranges: 0.7% for AGIs below $25k, 1.2% for AGIs $25k-50k, 0.9% for AGIs $50k-75k, 1.4% for AGIs $75k-100k, 1.3% for AGIs $100k-200k, 1.6% for AGIs over 200k)
Taxes paid: $5,978 (reported on 28.6% of returns)
70030:
$5,978
State:
$6,282
(% of AGI for various income ranges: 0.7% for AGIs below $25k, 1.2% for AGIs $25k-50k, 1.9% for AGIs $50k-75k, 2.1% for AGIs $75k-100k, 3.5% for AGIs $100k-200k, 7.5% for AGIs over 200k)
Earned income credit: $2,434 (reported on 20.0% of returns)
Here:
$2,434
State:
$2,633
(% of AGI for various income ranges: 8.4% for AGIs below $25k, 1.3% for AGIs $25k-50k)
Percentage of individuals using paid preparers for their 2012 taxes: 58.9%
Here:
59%
State:
57%
(% for various income ranges: 55.4% for AGIs below $25k, 57.9% for AGIs $25k-50k, 59.1% for AGIs $50k-75k, 61.1% for AGIs $75k-100k, 62.1% for AGIs $100k-200k, 100.0% for AGIs over 200k)
Averages for the 2004 tax year for zip code 70030, filed in 2005:
Average Adjusted Gross Income (AGI) in 2004: $38,876 (Individual Income Tax Returns)
Here:
$38,876
State:
$39,411
Salary/wage: $38,143 (reported on 86.1% of returns)
Here:
$38,143
State:
$34,434
(% of AGI for various income ranges: 90.4% for AGIs below $10k, 75.3% for AGIs $10k-25k, 84.8% for AGIs $25k-50k, 87.6% for AGIs $50k-75k, 90.0% for AGIs $75k-100k, 77.0% for AGIs over 100k)
Taxable interest for individuals: $722 (reported on 41.3% of returns)
This zip code:
$722
Louisiana:
$1,606
(% of AGI for various income ranges: 2.6% for AGIs below $10k, 1.3% for AGIs $10k-25k, 0.7% for AGIs $25k-50k, 0.7% for AGIs $50k-75k, 0.3% for AGIs $75k-100k, 1.0% for AGIs over 100k)
Taxable dividends: $887 (reported on 16.1% of returns)
Here:
$887
State:
$3,235
(% of AGI for various income ranges: 0.3% for AGIs below $10k, 0.6% for AGIs $10k-25k, 0.5% for AGIs $25k-50k, 0.3% for AGIs $50k-75k, 0.2% for AGIs $75k-100k, 0.4% for AGIs over 100k)
Net capital gain/loss: +$838 (reported on 10.5% of returns)
Here:
+$838
State:
+$8,531
(% of AGI for various income ranges: -0.4% for AGIs below $10k, -0.1% for AGIs $10k-25k, 0.2% for AGIs $25k-50k, -0.1% for AGIs $50k-75k, 0.4% for AGIs $75k-100k, 0.9% for AGIs over 100k)
Profit/loss from business: +$4,697 (reported on 18.4% of returns)
Here:
+$4,697
State:
+$9,128
(% of AGI for various income ranges: 9.6% for AGIs below $10k, 8.5% for AGIs $10k-25k, 2.8% for AGIs $25k-50k, 1.6% for AGIs $50k-75k, -0.1% for AGIs $75k-100k, 0.6% for AGIs over 100k)
IRA payment deduction: $1,800 (reported on 1.2% of returns)
70030:
$1,800
Louisiana:
$3,055
Total itemized deductions: $15,613 (23% of AGI, reported on 25.8% of returns)
Here:
$15,613
State:
$18,222
Here:
22.8% of AGI
State:
20.3% of AGI
(% of AGI for various income ranges: 4.0% for AGIs $10k-25k, 11.0% for AGIs $25k-50k, 12.2% for AGIs $50k-75k, 12.0% for AGIs $75k-100k, 10.2% for AGIs over 100k)
Charity contributions deductions: $2,586 (4% of AGI, reported on 22.9% of returns)
Here:
$2,586
State:
$4,190
Here:
3.7% of AGI
State:
4.4% of AGI
(% of AGI for various income ranges: 0.2% for AGIs $10k-25k, 1.3% for AGIs $25k-50k, 1.6% for AGIs $50k-75k, 2.0% for AGIs $75k-100k, 2.0% for AGIs over 100k)
Total tax: $4,702 (reported on 73.7% of returns)
70030:
$4,702
State:
$6,529
(% of AGI for various income ranges: 3.2% for AGIs below $10k, 3.8% for AGIs $10k-25k, 5.8% for AGIs $25k-50k, 8.8% for AGIs $50k-75k, 10.0% for AGIs $75k-100k, 15.5% for AGIs over 100k)
Earned income credit: $1,946 (reported on 22.6% of returns)
Here:
$1,946
State:
$2,103
Percentage of individuals using paid preparers for their 2004 taxes: 62.5%
Here:
62%
State:
61%
(% for various income ranges: 58.2% for AGIs below $10k, 66.0% for AGIs $10k-25k, 63.2% for AGIs $25k-50k, 65.1% for AGIs $50k-75k, 59.1% for AGIs $75k-100k, 57.8% for AGIs over 100k)
Household received Food Stamps/SNAP in the past 12 months: 204 Household did not receive Food Stamps/SNAP in the past 12 months: 1,160
Women who had a birth in the past 12 months: 12 (0 now married, 12 unmarried) Women who did not have a birth in the past 12 months: 949 (334 now married, 616 unmarried)
Housing units in zip code 70030 with a mortgage: 692 (45 second mortgage, 8 home equity loan) Median monthly owner costs for units with a mortgage: $1,944 Median monthly owner costs for units without a mortgage: $307
Residents with income below the poverty level in 2022:
This zip code:
9.7%
Whole state:
18.6%
Residents with income below 50% of the poverty level in 2022:
This zip code:
9.1%
Whole state:
10.1%
Median number of rooms in houses and condos:
Here:
6.0
State:
6.2
Median number of rooms in apartments:
Here:
6.0
State:
4.4
Notable locations in this zip code not listed on our city pages
Notable locations in zip code 70030: Des Allemands Volunteer Fire Department (A), Bayou Gauche Volunteer Fire Department (B), Des Allemands Volunteer Fire Department Station 71 (C). Display/hide their locations on the map
Churches in zip code 70030 include: Life Fellowship Community Church (A), First Assembly of God Church (B), Des Allemands Baptist Church (C), Great Antioch Church (D), Saint Gertrude Catholic Church (E), Bayou Gauche Church (F), Antioch Church (G). Display/hide their locations on the map
Size of family households: 451 2-persons, 290 3-persons, 227 4-persons, 160 5-persons, 10 6-persons
Size of nonfamily households: 168 1-person, 43 2-persons
429 married couples with children.
297 single-parent households (152 men, 145 women).
98.7% of residents of 70030 zip code speak English at home.
1.3% of residents speak other Indo-European language at home (100% not well).
Foreign born population: 0 (0.0%)
:
0.0%
Whole state:
4.2%
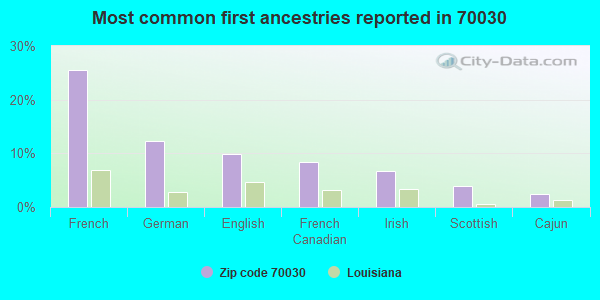
26%French
12%German
10%English
8%French Canadian
7%Irish
4%Scottish
2%Cajun
Facilities with environmental interests located in this zip code:
ALLEMANDS ELEMENTARY SCHOOL (1471 WPA ROAD in DES ALLEMANDS, LA)
(Geographic Names Information System) (National Center for Education Statistics) - STATE ID-045001 Organizations: SAINT CHARLES PARISH SCHOOL BOARD (SCHOOL DISTRICT)
BAYOU DES ALLEMANDS - #2 FACILITY (3 MI E OF BAYOU GAUCHE in DES ALLEMANDS, LA) . Tribal Land
AIR MINOR (AIRS/AFS) Business SIC classification: CRUDE PETROLEUM AND NATURAL GAS Alternative names: AMOCO/BAYOU GAUCHE, HILCORP DES ALEMNDS
BAYOU SIDE R V PARK (4298 B HIGHWAY 90 EAST in DES ALLEMANDS, LA)
National Pollutant Discharge Elimination System NON-MAJOR (Tracking pollutant discharge elimination systems) - permit Business SIC classification: RECREATIONAL VEHICLE PARKS AND CAMPSITES
BAYOU SIDE WASHATERIA (4298 HWY 90 EAST in DES ALLEMANDS, LA)
National Pollutant Discharge Elimination System NON-MAJOR (Tracking pollutant discharge elimination systems) - permit
OTTO CANDIES INC (17271 HWY 90 in DES ALLEMANDS, LA) . Tribal Land
TRANSPORTER (Resource Conservation and Recovery Act (tracking hazardous waste)) USED OIL PROGRAM (Resource Conservation and Recovery Act (tracking hazardous waste))
PARADIS TANK BATTERY #2 (10 MI SW PARADIS - 2 MI E in DES ALLEMANDS, LA)
AIR MINOR (AIRS/AFS) Business SIC classification: CRUDE PETROLEUM AND NATURAL GAS Alternative names: D W SYMANK, TEXACO PARADIS TB 2
PLEASANT VALLEY EXT SUB (LA HWY 306 ON PLEASANT in DES ALLEMANDS, LA)
National Pollutant Discharge Elimination System NON-MAJOR (Tracking pollutant discharge elimination systems) - permit Alternative names: PLESANT VALLEY EXT SUB
PARADIS TANK BATTERY #7 (2 MI E OF in DES ALLEMANDS, LA)
AIR MAJOR (AIRS/AFS) CRITERIA AND HAZARDOUS AIR POLLUTANT INVENTORY (Inventory of air pollution sources) Business SIC classification: CRUDE PETROLEUM AND NATURAL GAS Alternative names: D W SYMANK, PARADIS TB#7
PARADIS TB#6 (2 MI E OF in DES ALLEMANDS, LA)
CRITERIA AND HAZARDOUS AIR POLLUTANT INVENTORY (Inventory of air pollution sources) Business SIC classification: CRUDE PETROLEUM AND NATURAL GAS
Housing units lacking complete plumbing facilities: 3.4% Housing units lacking complete kitchen facilities: 2.0%
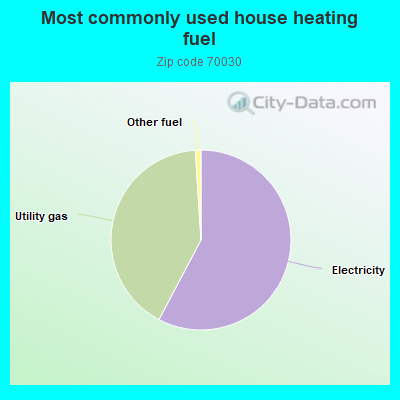
57.8%Electricity
41.3%Utility gas
1.0%Other fuel
Population in 1990: 3,322. Population change in the 1990s: +851 (+25.6%).
Place of birth for U.S.-born residents:
This state: 3,167
Northeast: 50
Midwest: 101
South: 402
West: 59
71% of the 70030 zip code residents lived in the same house 5 years ago. Out of people who lived in different houses, 61% lived in this county. Out of people who lived in different counties, 50% lived in Louisiana.
94% of the 70030 zip code residents lived in the same house 1 year ago. Out of people who lived in different houses, 25% moved from this county. Out of people who lived in different houses, 77% moved from different county within same state.
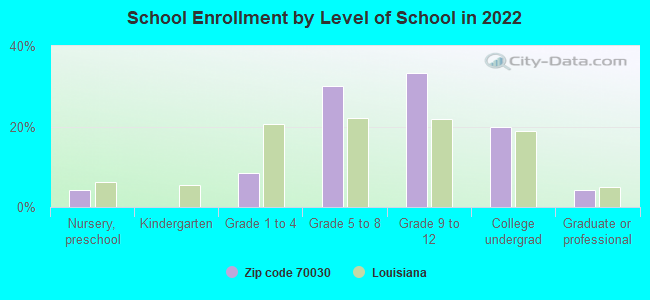
Private vs. public school enrollment:
Students in private schools in grades 1 to 8 (elementary and middle school): 43
Here:
14.1%
Louisiana:
19.6%
Students in private schools in grades 9 to 12 (high school):
Here:
0.0%
Louisiana:
18.3%
Students in private undergraduate colleges:
Here:
0.0%
Louisiana:
17.4%
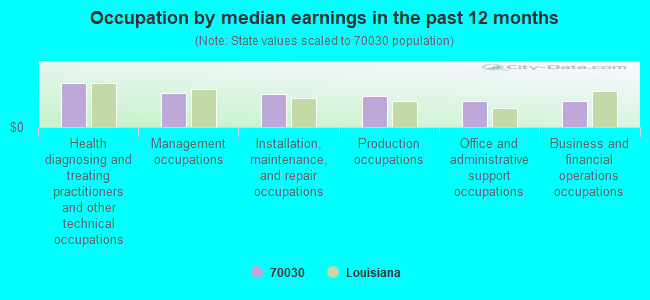
Occupation by median earnings in the past 12 months ($)
111,518Health diagnosing and treating practitioners and other technical occupations
86,377Management occupations
83,292Installation, maintenance, and repair occupations
80,364Production occupations
65,556Office and administrative support occupations
65,378Business and financial operations occupations
Top industries in this zip code by the number of employees in 2005:
Administrative and Support and Waste Management and Remediation Services: Tour Operators (20-49 employees: 1 establishment)
Other Services (except Public Administration): Commercial and Industrial Machinery and Equipment (except Automotive and Electronic) Repair and Maintenance (20-49: 1)
Other Services (except Public Administration): Religious Organizations (5-9: 2, 1-4: 2)
Accommodation and Food Services: Full-Service Restaurants (10-19: 1, 1-4: 1)
Construction: Other Heavy and Civil Engineering Construction (10-19: 1)
Arts, Entertainment, and Recreation: Marinas (10-19: 1)
Fatal accident statistics in 2013:
Fatal accident count: 2
Vehicles involved in fatal accidents: 3
Fatal accidents caused by drunken drivers: 0
Fatalities: 2
Persons involved in fatal accidents: 6
Pedestrians involved in fatal accidents: 0
Fatal accident statistics in 2012:
Fatal accident count: 1
Vehicles involved in fatal accidents: 1
Fatal accidents caused by drunken drivers: 1
Fatalities: 1
Persons involved in fatal accidents: 2
Pedestrians involved in fatal accidents: 0
Home Mortgage Disclosure Act Aggregated Statistics For Year 2009 (Based on 6 partial tracts)
A) FHA, FSA/RHS & VA Home Purchase Loans
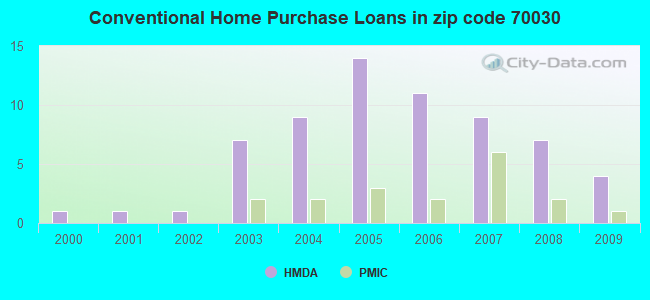
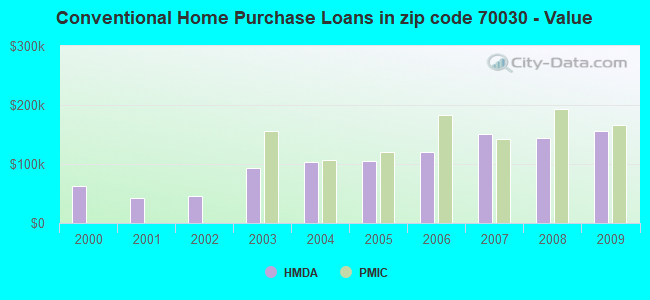
B) Conventional Home Purchase Loans
C) Refinancings
D) Home Improvement Loans
F) Non-occupant Loans on < 5 Family Dwellings (A B C & D)
G) Loans On Manufactured Home Dwelling (A B C & D)
Number
Average Value
Number
Average Value
Number
Average Value
Number
Average Value
Number
Average Value
Number
Average Value
LOANS ORIGINATED
4
$168,968
4
$156,380
20
$139,424
3
$30,130
1
$86,850
2
$42,610
APPLICATIONS APPROVED, NOT ACCEPTED
0
$0
1
$115,850
2
$168,375
1
$28,990
0
$0
0
$0
APPLICATIONS DENIED
0
$0
3
$67,433
9
$143,944
2
$33,680
1
$38,560
3
$25,433
APPLICATIONS WITHDRAWN
1
$112,760
0
$0
4
$148,942
0
$0
0
$0
0
$0
FILES CLOSED FOR INCOMPLETENESS
0
$0
0
$0
1
$149,640
0
$0
0
$0
0
$0
Aggregated Statistics For Year 2008 (Based on 6 partial tracts)
A) FHA, FSA/RHS & VA Home Purchase Loans
B) Conventional Home Purchase Loans
C) Refinancings
D) Home Improvement Loans
F) Non-occupant Loans on < 5 Family Dwellings (A B C & D)
G) Loans On Manufactured Home Dwelling (A B C & D)
Number
Average Value
Number
Average Value
Number
Average Value
Number
Average Value
Number
Average Value
Number
Average Value
LOANS ORIGINATED
3
$167,713
7
$144,327
15
$127,603
5
$28,918
1
$128,320
2
$93,775
APPLICATIONS APPROVED, NOT ACCEPTED
0
$0
3
$112,363
3
$118,960
1
$10,980
0
$0
1
$118,220
APPLICATIONS DENIED
0
$0
4
$82,545
10
$140,464
7
$53,146
0
$0
4
$56,912
APPLICATIONS WITHDRAWN
1
$121,290
0
$0
3
$156,540
1
$52,390
0
$0
0
$0
FILES CLOSED FOR INCOMPLETENESS
0
$0
0
$0
2
$129,015
0
$0
0
$0
0
$0
Aggregated Statistics For Year 2007 (Based on 6 partial tracts)
A) FHA, FSA/RHS & VA Home Purchase Loans
B) Conventional Home Purchase Loans
C) Refinancings
D) Home Improvement Loans
F) Non-occupant Loans on < 5 Family Dwellings (A B C & D)
G) Loans On Manufactured Home Dwelling (A B C & D)
Number
Average Value
Number
Average Value
Number
Average Value
Number
Average Value
Number
Average Value
Number
Average Value
LOANS ORIGINATED
1
$65,810
9
$150,357
17
$149,166
7
$24,607
2
$96,765
2
$46,050
APPLICATIONS APPROVED, NOT ACCEPTED
0
$0
2
$110,190
3
$103,987
0
$0
0
$0
1
$76,110
APPLICATIONS DENIED
0
$0
6
$141,173
9
$143,847
6
$63,833
1
$75,920
4
$51,602
APPLICATIONS WITHDRAWN
0
$0
1
$200,100
4
$166,218
0
$0
0
$0
0
$0
FILES CLOSED FOR INCOMPLETENESS
0
$0
1
$148,520
1
$219,850
0
$0
0
$0
0
$0
Aggregated Statistics For Year 2006 (Based on 6 partial tracts)
A) FHA, FSA/RHS & VA Home Purchase Loans
B) Conventional Home Purchase Loans
C) Refinancings
D) Home Improvement Loans
F) Non-occupant Loans on < 5 Family Dwellings (A B C & D)
G) Loans On Manufactured Home Dwelling (A B C & D)
Number
Average Value
Number
Average Value
Number
Average Value
Number
Average Value
Number
Average Value
Number
Average Value
LOANS ORIGINATED
3
$93,867
11
$120,290
19
$126,388
5
$24,176
3
$106,567
4
$47,428
APPLICATIONS APPROVED, NOT ACCEPTED
0
$0
3
$68,020
3
$91,707
1
$43,470
0
$0
2
$60,090
APPLICATIONS DENIED
0
$0
6
$84,628
11
$107,446
4
$60,408
0
$0
5
$51,556
APPLICATIONS WITHDRAWN
0
$0
1
$111,330
6
$121,160
1
$128,950
1
$74,600
0
$0
FILES CLOSED FOR INCOMPLETENESS
0
$0
0
$0
2
$128,345
0
$0
0
$0
0
$0
Aggregated Statistics For Year 2005 (Based on 6 partial tracts)
A) FHA, FSA/RHS & VA Home Purchase Loans
B) Conventional Home Purchase Loans
C) Refinancings
D) Home Improvement Loans
F) Non-occupant Loans on < 5 Family Dwellings (A B C & D)
G) Loans On Manufactured Home Dwelling (A B C & D)
Number
Average Value
Number
Average Value
Number
Average Value
Number
Average Value
Number
Average Value
Number
Average Value
LOANS ORIGINATED
2
$108,160
14
$105,388
23
$108,604
6
$56,627
3
$73,590
2
$50,120
APPLICATIONS APPROVED, NOT ACCEPTED
0
$0
3
$104,540
4
$113,868
0
$0
0
$0
1
$35,230
APPLICATIONS DENIED
0
$0
6
$75,745
15
$96,668
3
$26,363
1
$73,390
5
$43,100
APPLICATIONS WITHDRAWN
0
$0
3
$77,773
6
$121,645
1
$77,430
1
$48,730
0
$0
FILES CLOSED FOR INCOMPLETENESS
0
$0
0
$0
2
$211,315
0
$0
0
$0
0
$0
Aggregated Statistics For Year 2004 (Based on 6 partial tracts)
A) FHA, FSA/RHS & VA Home Purchase Loans
B) Conventional Home Purchase Loans
C) Refinancings
D) Home Improvement Loans
F) Non-occupant Loans on < 5 Family Dwellings (A B C & D)
G) Loans On Manufactured Home Dwelling (A B C & D)
Number
Average Value
Number
Average Value
Number
Average Value
Number
Average Value
Number
Average Value
Number
Average Value
LOANS ORIGINATED
2
$79,010
9
$102,683
26
$99,581
7
$32,396
1
$139,770
3
$46,543
APPLICATIONS APPROVED, NOT ACCEPTED
1
$36,870
3
$54,780
7
$99,279
2
$32,165
0
$0
3
$45,507
APPLICATIONS DENIED
1
$32,300
5
$74,500
18
$117,995
3
$49,277
1
$158,070
6
$68,312
APPLICATIONS WITHDRAWN
0
$0
2
$87,675
9
$108,698
0
$0
0
$0
0
$0
FILES CLOSED FOR INCOMPLETENESS
0
$0
1
$75,840
5
$100,622
0
$0
0
$0
0
$0
Aggregated Statistics For Year 2003 (Based on 6 partial tracts)
A) FHA, FSA/RHS & VA Home Purchase Loans
B) Conventional Home Purchase Loans
C) Refinancings
D) Home Improvement Loans
F) Non-occupant Loans on < 5 Family Dwellings (A B C & D)
Number
Average Value
Number
Average Value
Number
Average Value
Number
Average Value
Number
Average Value
LOANS ORIGINATED
3
$125,407
7
$92,427
55
$102,848
7
$20,800
3
$71,067
APPLICATIONS APPROVED, NOT ACCEPTED
0
$0
2
$98,600
9
$84,229
1
$42,470
1
$27,790
APPLICATIONS DENIED
1
$44,470
7
$54,780
17
$97,859
2
$36,815
1
$49,380
APPLICATIONS WITHDRAWN
0
$0
1
$102,890
6
$120,047
0
$0
0
$0
FILES CLOSED FOR INCOMPLETENESS
0
$0
0
$0
1
$85,780
0
$0
0
$0
Aggregated Statistics For Year 2002 (Based on 4 partial tracts)
B) Conventional Home Purchase Loans
C) Refinancings
D) Home Improvement Loans
Number
Average Value
Number
Average Value
Number
Average Value
LOANS ORIGINATED
1
$45,840
3
$85,250
1
$20,360
APPLICATIONS APPROVED, NOT ACCEPTED
0
$0
0
$0
0
$0
APPLICATIONS DENIED
1
$34,250
0
$0
0
$0
APPLICATIONS WITHDRAWN
0
$0
0
$0
0
$0
FILES CLOSED FOR INCOMPLETENESS
0
$0
0
$0
0
$0
Aggregated Statistics For Year 2001 (Based on 4 partial tracts)
B) Conventional Home Purchase Loans
C) Refinancings
D) Home Improvement Loans
Number
Average Value
Number
Average Value
Number
Average Value
LOANS ORIGINATED
1
$42,440
3
$63,417
1
$16,200
APPLICATIONS APPROVED, NOT ACCEPTED
0
$0
0
$0
0
$0
APPLICATIONS DENIED
0
$0
1
$38,150
0
$0
APPLICATIONS WITHDRAWN
0
$0
0
$0
0
$0
FILES CLOSED FOR INCOMPLETENESS
0
$0
0
$0
0
$0
Aggregated Statistics For Year 2000 (Based on 4 partial tracts)
B) Conventional Home Purchase Loans
C) Refinancings
D) Home Improvement Loans
Number
Average Value
Number
Average Value
Number
Average Value
LOANS ORIGINATED
1
$62,900
2
$36,005
1
$11,580
APPLICATIONS APPROVED, NOT ACCEPTED
0
$0
0
$0
0
$0
APPLICATIONS DENIED
1
$24,490
1
$34,090
0
$0
APPLICATIONS WITHDRAWN
0
$0
0
$0
0
$0
FILES CLOSED FOR INCOMPLETENESS
0
$0
0
$0
0
$0
Aggregated Statistics For Year 1999 (Based on 2 partial tracts)
Detailed PMIC statistics for the following Tracts:0210.00
, 0632.00
2002 - 2018 National Fire Incident Reporting System (NFIRS) incidents
Based on the data from the years 2002 - 2018 the average number of fire incidents per year is 27. The highest number of fires - 65 took place in 2012, and the least - 0 in 2008. The data has an increasing trend.
When looking into fire subcategories, the most reports belonged to: Outside Fires (56.6%), and Structure Fires (28.7%).
Fire incident types reported to NFIRS in Zip Code 70030


 Nearest zip codes: 70080, 70039, 70355, 70070, 70057, 70375.
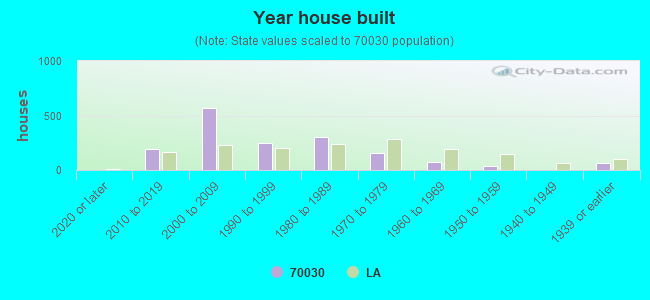


 Based on the data from the years 2002 - 2018 the average number of fire incidents per year is 27. The highest number of fires - 65 took place in 2012, and the least - 0 in 2008. The data has an increasing trend.
 When looking into fire subcategories, the most reports belonged to: Outside Fires (56.6%), and Structure Fires (28.7%).