Estimated zip code population in 2022: 3,721 Zip code population in 2010: 4,403 Zip code population in 2000: 4,600
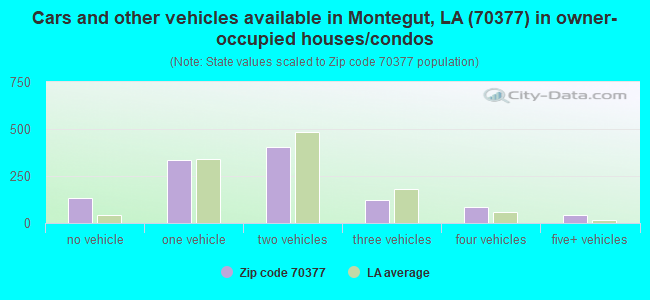
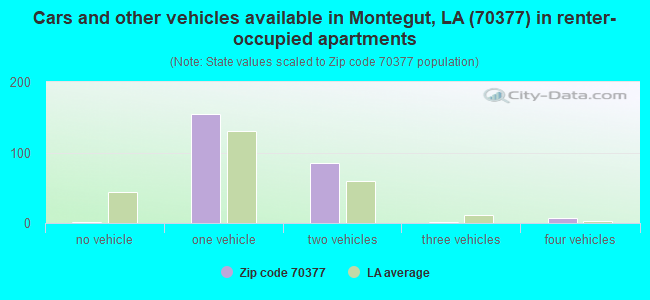
Houses and condos: 1,531 Renter-occupied apartments: 250
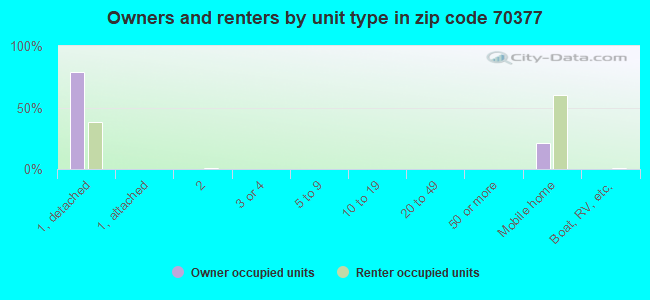
% of renters here:
18%
State:
32%
March 2022 cost of living index in zip code 70377: 80.1 (low, U.S. average is 100)
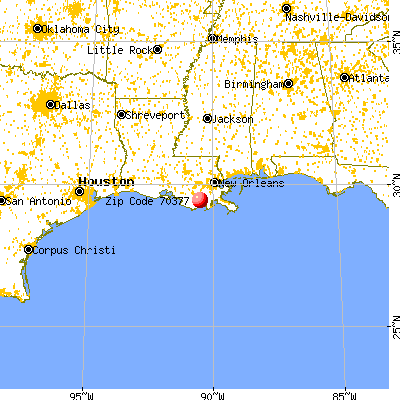
Land area: 132.2 sq. mi. Water area: 95.7 sq. mi.
Population density: 28 people per square mile
(very low).
OSM Map
General Map
Google Map
MSN Map
OSM Map
General Map
Google Map
MSN Map
OSM Map
General Map
Google Map
MSN Map
OSM Map
General Map
Google Map
MSN Map
Please wait while loading the map...
Real estate property taxes paid for housing units in 2022:
This zip code:
0.4% ($439)
Louisiana:
0.5% ($1,127)
Median real estate property taxes paid for housing units with mortgages in 2022: $449 (0.4%) Median real estate property taxes paid for housing units with no mortgage in 2022: $436 (0.4%)
Business Search- 14 Million verified businesses
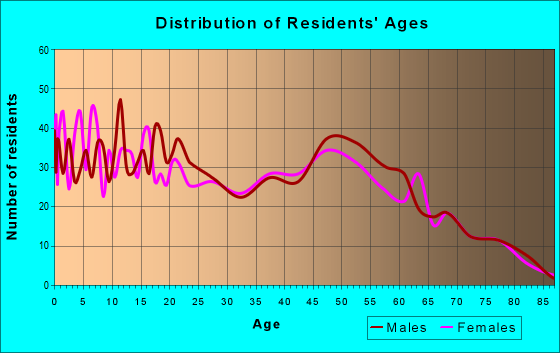
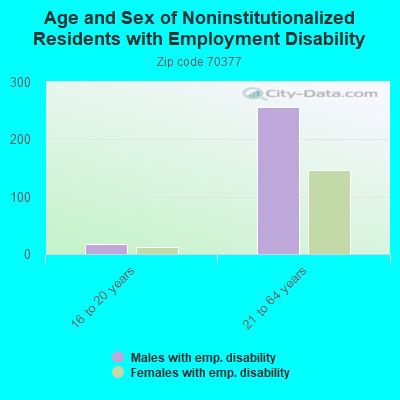
Males: 2,065
(55.5%)
Females: 1,655
(44.5%)
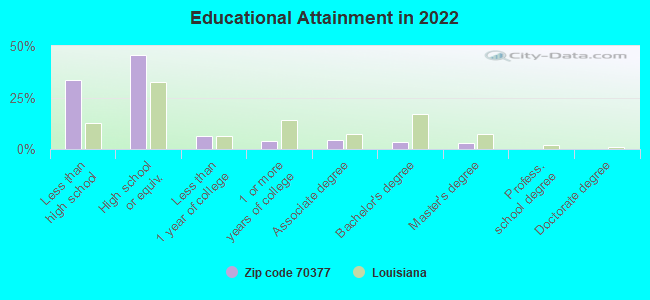
For population 25 years and over in 70377:
High school or higher: 65.2%
Bachelor's degree or higher: 6.2%
Graduate or professional degree: 2.8%
Unemployed: 2.0%
Mean travel time to work (commute): 49.0 minutes
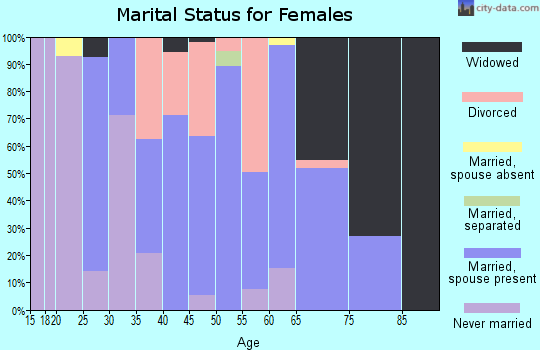
For population 15 years and over in 70377:
Never married: 28.0%
Now married: 54.4%
Separated: 1.1%
Widowed: 7.8%
Divorced: 8.7%
Zip code 70377 compared to state average:
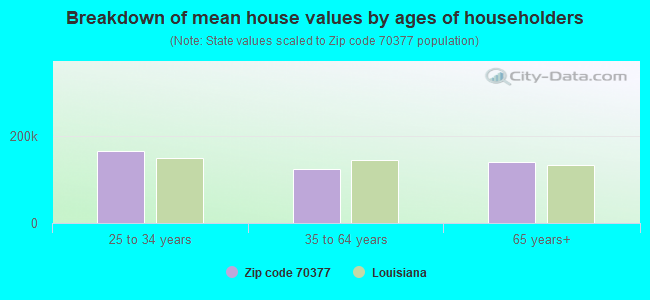
Median house value below state average.
Unemployed percentage below state average.
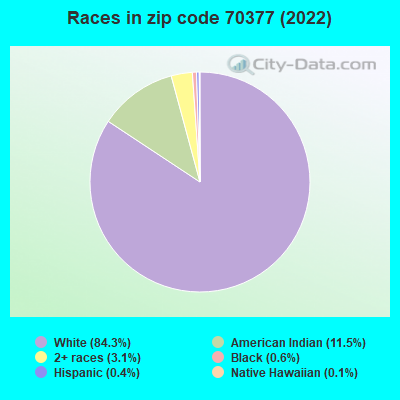
Black race population percentage significantly below state average.
Hispanic race population percentage significantly below state average.
Median age significantly above state average.
Foreign-born population percentage significantly below state average.
Renting percentage below state average.
Length of stay since moving in significantly above state average.
Percentage of population with a bachelor's degree or higher significantly below state average.
Averages for the 2020 tax year for zip code 70377, filed in 2021:
Average Adjusted Gross Income (AGI) in 2020: $43,052 (Individual Income Tax Returns)
Here:
$43,052
State:
$60,757
Salary/wage: $41,993 (reported on 80.4% of returns)
Here:
$41,993
State:
$50,882
(% of AGI for various income ranges: 1030.6% for AGIs below $25k, 3468.8% for AGIs $25k-50k, 6468.7% for AGIs $50k-75k, 9803.8% for AGIs $75k-100k, 16368.0% for AGIs $100k-200k)
Taxable interest for individuals: $303 (reported on 21.0% of returns)
This zip code:
$303
Louisiana:
$1,576
(% of AGI for various income ranges: 4.6% for AGIs below $25k, 11.9% for AGIs $25k-50k, 5.3% for AGIs $50k-75k, 17.5% for AGIs $75k-100k, 14.0% for AGIs $100k-200k)
Ordinary dividends: $1,200 (reported on 7.0% of returns)
Here:
$1,200
State:
$7,743
(% of AGI for various income ranges: 5.4% for AGIs below $25k, 19.2% for AGIs $25k-50k, 14.7% for AGIs $50k-75k, 20.0% for AGIs $100k-200k)
Net capital gain/loss in AGI: +$638 (reported on 5.6% of returns)
Here:
+$638
State:
+$16,917
(% of AGI for various income ranges: 13.8% for AGIs $25k-50k, 27.5% for AGIs $75k-100k)
Profit/loss from business: +$6,354 (reported on 19.6% of returns)
Here:
+$6,354
State:
+$7,679
(% of AGI for various income ranges: 207.7% for AGIs below $25k, 200.4% for AGIs $25k-50k, 37.3% for AGIs $50k-75k, 122.0% for AGIs $100k-200k)
Taxable individual retirement arrangement distribution: $17,878 (reported on 6.3% of returns)
70377:
$17,878
Louisiana:
$20,716
(% of AGI for various income ranges: 43.3% for AGIs below $25k, 146.5% for AGIs $25k-50k, 1253.8% for AGIs $75k-100k)
Total itemized deductions: $24,433 (reported on 2.1% of returns)
Here:
$24,433
State:
$36,265
(% of AGI for various income ranges: 488.7% for AGIs $50k-75k)
Earned income credit: $2,782 (reported on 28.0% of returns)
Here:
$2,782
State:
$2,671
(% of AGI for various income ranges: 157.7% for AGIs below $25k, 112.7% for AGIs $25k-50k)
Percentage of individuals using paid preparers for their 2020 taxes: 93.0%
Here:
93%
State:
92%
(% for various income ranges: 92.5% for AGIs below $25k, 93.8% for AGIs $25k-50k, 94.4% for AGIs $50k-75k, 90.9% for AGIs $75k-100k, 93.3% for AGIs $100k-200k)
Averages for the 2012 tax year for zip code 70377, filed in 2013:
Average Adjusted Gross Income (AGI) in 2012: $46,132 (Individual Income Tax Returns)
Here:
$46,132
State:
$56,730
Salary/wage: $45,689 (reported on 84.6% of returns)
Here:
$45,689
State:
$45,545
(% of AGI for various income ranges: 72.1% for AGIs below $25k, 82.1% for AGIs $25k-50k, 88.5% for AGIs $50k-75k, 89.5% for AGIs $75k-100k, 82.7% for AGIs $100k-200k)
Taxable interest for individuals: $356 (reported on 24.2% of returns)
This zip code:
$356
Louisiana:
$1,804
(% of AGI for various income ranges: 0.7% for AGIs below $25k, 0.1% for AGIs $25k-50k, 0.2% for AGIs $50k-75k, 0.1% for AGIs $75k-100k)
Ordinary dividends: $1,018 (reported on 7.4% of returns)
Here:
$1,018
State:
$7,610
(% of AGI for various income ranges: 0.2% for AGIs below $25k, 0.3% for AGIs $25k-50k, 0.3% for AGIs $50k-75k)
Profit/loss from business: +$9,260 (reported on 23.5% of returns)
Here:
+$9,260
State:
+$12,088
(% of AGI for various income ranges: 15.3% for AGIs below $25k, 5.0% for AGIs $25k-50k, 2.0% for AGIs $50k-75k, 0.9% for AGIs $75k-100k, 4.6% for AGIs $100k-200k)
Taxable individual retirement arrangement distribution: $18,371 (reported on 4.7% of returns)
70377:
$18,371
Louisiana:
$16,085
(% of AGI for various income ranges: 2.7% for AGIs below $25k, 3.5% for AGIs $25k-50k, 4.9% for AGIs $75k-100k)
Total itemized deductions: $17,912 (20% of AGI, reported on 11.4% of returns)
Here:
$17,912
State:
$23,585
Here:
19.8% of AGI
State:
18.1% of AGI
(% of AGI for various income ranges: 4.2% for AGIs $25k-50k, 3.2% for AGIs $50k-75k, 6.0% for AGIs $75k-100k, 6.0% for AGIs $100k-200k)
Charity contributions: $4,170 (reported on 6.7% of returns)
Here:
$4,170
State:
$5,533
(% of AGI for various income ranges: 1.0% for AGIs $25k-50k, 0.5% for AGIs $75k-100k, 1.0% for AGIs $100k-200k)
Taxes paid: $3,781 (reported on 10.7% of returns)
70377:
$3,781
State:
$6,282
(% of AGI for various income ranges: 0.4% for AGIs $25k-50k, 0.4% for AGIs $50k-75k, 1.0% for AGIs $75k-100k, 1.7% for AGIs $100k-200k)
Earned income credit: $2,625 (reported on 26.8% of returns)
Here:
$2,625
State:
$2,633
(% of AGI for various income ranges: 11.0% for AGIs below $25k, 1.4% for AGIs $25k-50k)
Percentage of individuals using paid preparers for their 2012 taxes: 61.7%
Here:
62%
State:
57%
(% for various income ranges: 59.7% for AGIs below $25k, 57.1% for AGIs $25k-50k, 66.7% for AGIs $50k-75k, 66.7% for AGIs $75k-100k, 68.8% for AGIs $100k-200k)
Averages for the 2004 tax year for zip code 70377, filed in 2005:
Average Adjusted Gross Income (AGI) in 2004: $31,253 (Individual Income Tax Returns)
Here:
$31,253
State:
$39,411
Salary/wage: $31,815 (reported on 84.0% of returns)
Here:
$31,815
State:
$34,434
(% of AGI for various income ranges: 76.6% for AGIs below $10k, 71.0% for AGIs $10k-25k, 89.9% for AGIs $25k-50k, 91.9% for AGIs $50k-75k, 88.5% for AGIs $75k-100k, 69.1% for AGIs over 100k)
Taxable interest for individuals: $659 (reported on 27.9% of returns)
This zip code:
$659
Louisiana:
$1,606
(% of AGI for various income ranges: 1.6% for AGIs below $10k, 1.4% for AGIs $10k-25k, 0.4% for AGIs $25k-50k, 0.5% for AGIs $50k-75k, 0.3% for AGIs $75k-100k, 0.3% for AGIs over 100k)
Taxable dividends: $1,623 (reported on 9.5% of returns)
Here:
$1,623
State:
$3,235
(% of AGI for various income ranges: 0.9% for AGIs below $10k, 1.0% for AGIs $10k-25k, 0.2% for AGIs $25k-50k, 0.8% for AGIs $50k-75k, 0.1% for AGIs $75k-100k)
Net capital gain/loss: +$661 (reported on 6.9% of returns)
Here:
+$661
State:
+$8,531
(% of AGI for various income ranges: -1.0% for AGIs below $10k, -0.5% for AGIs $10k-25k, 0.4% for AGIs $25k-50k, -0.1% for AGIs $50k-75k, 1.2% for AGIs $75k-100k)
Profit/loss from business: +$4,331 (reported on 22.9% of returns)
Here:
+$4,331
State:
+$9,128
(% of AGI for various income ranges: 10.8% for AGIs below $10k, 13.3% for AGIs $10k-25k, 2.2% for AGIs $25k-50k, 0.3% for AGIs $50k-75k, 1.0% for AGIs $75k-100k)
IRA payment deduction: $2,571 (reported on 1.3% of returns)
70377:
$2,571
Louisiana:
$3,055
Total itemized deductions: $13,487 (22% of AGI, reported on 7.2% of returns)
Here:
$13,487
State:
$18,222
Here:
21.9% of AGI
State:
20.3% of AGI
(% of AGI for various income ranges: 1.9% for AGIs $10k-25k, 2.4% for AGIs $25k-50k, 3.9% for AGIs $50k-75k, 4.2% for AGIs $75k-100k, 4.7% for AGIs over 100k)
Charity contributions deductions: $2,568 (4% of AGI, reported on 5.5% of returns)
Here:
$2,568
State:
$4,190
Here:
4.0% of AGI
State:
4.4% of AGI
(% of AGI for various income ranges: 0.6% for AGIs $10k-25k, 0.3% for AGIs $25k-50k, 0.5% for AGIs $50k-75k, 0.5% for AGIs $75k-100k, 1.0% for AGIs over 100k)
Total tax: $3,425 (reported on 71.2% of returns)
70377:
$3,425
State:
$6,529
(% of AGI for various income ranges: 4.1% for AGIs below $10k, 4.6% for AGIs $10k-25k, 5.9% for AGIs $25k-50k, 8.1% for AGIs $50k-75k, 10.0% for AGIs $75k-100k, 17.9% for AGIs over 100k)
Earned income credit: $1,877 (reported on 27.6% of returns)
Here:
$1,877
State:
$2,103
Percentage of individuals using paid preparers for their 2004 taxes: 60.4%
Here:
60%
State:
61%
(% for various income ranges: 56.3% for AGIs below $10k, 58.0% for AGIs $10k-25k, 62.4% for AGIs $25k-50k, 62.7% for AGIs $50k-75k, 69.1% for AGIs $75k-100k, 74.1% for AGIs over 100k)
Household received Food Stamps/SNAP in the past 12 months: 279 Household did not receive Food Stamps/SNAP in the past 12 months: 1,090
Women who had a birth in the past 12 months: 26 (25 now married, 0 unmarried) Women who did not have a birth in the past 12 months: 693 (324 now married, 366 unmarried)
Housing units in zip code 70377 with a mortgage: 181 (2 second mortgage) Median monthly owner costs for units with a mortgage: $1,109 Median monthly owner costs for units without a mortgage: $300
Residents with income below the poverty level in 2022:
This zip code:
25.2%
Whole state:
18.6%
Residents with income below 50% of the poverty level in 2022:
This zip code:
12.6%
Whole state:
10.1%
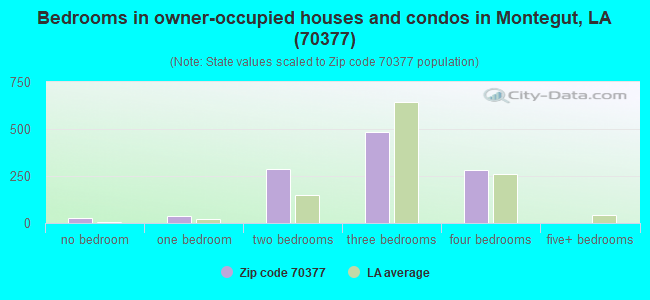
Median number of rooms in houses and condos:
Here:
6.3
State:
6.2
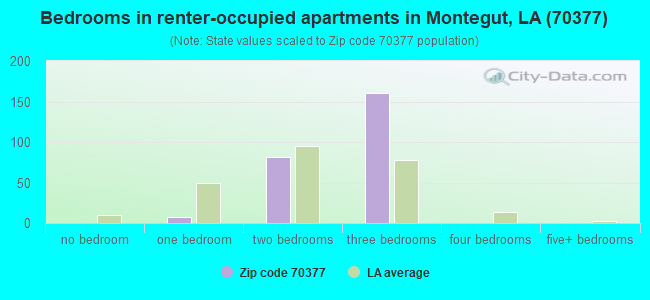
Median number of rooms in apartments:
Here:
4.8
State:
4.4
Notable locations in this zip code not listed on our city pages
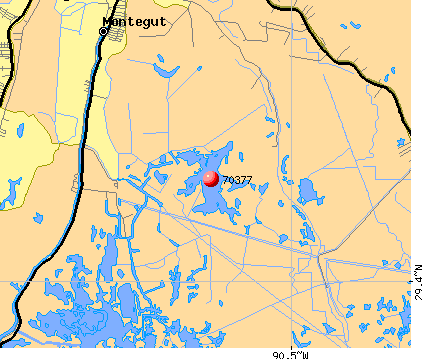
Notable locations in zip code 70377: Pointe Farms (A), Aragon Plantation (B), Terrebonne Parish Library Montegut Branch (C), Montegut / Pointe - aux - Chenes Fire Department Station 2 (D), Montegut / Pointe - aux - Chenes Fire Department (E), Montegut / Pointe - aux - Chenes Fire Department Station 4 (F), Montegut / Pointe - aux - Chenes Fire Department Station 3 (G). Display/hide their locations on the map
Churches in zip code 70377 include: New Beginning Community Outreach Center (A), Montegut Baptist Church (B), Father's House Church (C), Carpentier Mission (D), Live Oak Church (E), South Terrebonne Church of Christ (F), Sacred Heart Church (G), Saint Charles Church (H), New Life Christian Ministries (I). Display/hide their locations on the map
Lakes and swamps: Bayou Chouvere (A), Bayou Leblanc (B), Bayou Poulailler (C), Lake Billiot (D), Calm Lake (E), Madison Bay (F), Lake Barre (G), Bay la Fleur (H). Display/hide their locations on the map
Streams, rivers, and creeks: Bayou Terrebonne (A), Bayou Tambour (B), Bayou Saint Jean Charles (C), Bayou Guillaume (D), Bayou Barre (E), Bayou Barbue (F), Oyster Bayou (G), Bayou Pointe au Chien (H). Display/hide their locations on the map
Size of family households: 368 2-persons, 218 3-persons, 143 4-persons, 122 5-persons, 50 6-persons, 47 7-or-more-persons
Size of nonfamily households: 316 1-person, 69 2-persons, 15 3-persons
385 married couples with children.
67 single-parent households (24 men, 43 women).
89.7% of residents of 70377 zip code speak English at home.
0.1% of residents speak Spanish at home (100% very well).
10.1% of residents speak other Indo-European language at home (77% very well, 13% well, 1% not well, 9% not at all).
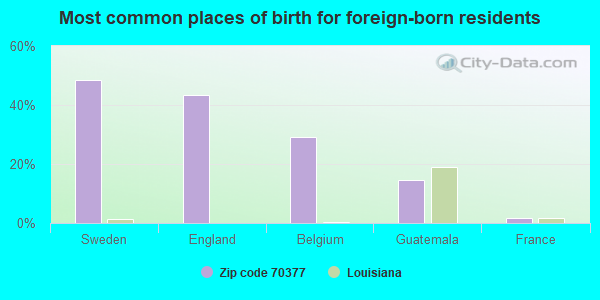
Foreign born population: 61 (1.7%) (84.6% of them are naturalized citizens)
This zip code:
1.7%
Whole state:
4.2%
48%Sweden
44%England
29%Belgium
15%Guatemala
2%France
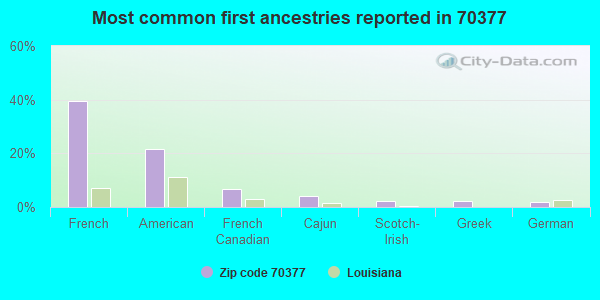
40%French
22%American
7%French Canadian
4%Cajun
2%Scotch-Irish
2%Greek
2%German
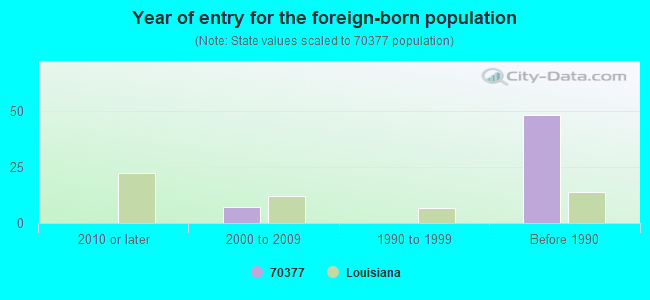
Year of entry for the foreign-born population
02010 or later
72000 to 2009
01990 to 1999
48Before 1990
Facilities with environmental interests located in this zip code:
MONTEGUT ELEMENTARY SCHOOL (1137 HIGHWAY 55 in MONTEGUT, LA)
(Geographic Names Information System) (National Center for Education Statistics) - STATE ID-055025 Organizations: TERREBONNE PARISH SCHOOL BOARD (SCHOOL DISTRICT)
MONTEGUT MIDDLE SCHOOL (138 DOLPHIN DRIVE in MONTEGUT, LA)
(Geographic Names Information System) (National Center for Education Statistics) - STATE ID-055026 Organizations: TERREBONNE PARISH SCHOOL BOARD (SCHOOL DISTRICT)
POINTE-AUX-CHENES ELEMENTARY SCHOOL (1236 HIGHWAY 665 in MONTEGUT, LA)
(National Center for Education Statistics) - STATE ID-055030 Organizations: TERREBONNE PARISH SCHOOL BOARD (SCHOOL DISTRICT)
EXXON LIRETTE GAS PLANT (S23 & 32 T19S R19E in MONTEGUT, LA)
BAYOU JEAN LACROIX FIELD PRODUCTION FACI (9.5 MI SE OF in MONTEGUT, LA)
AIR MINOR (AIRS/AFS) Business SIC classification: CRUDE PETROLEUM AND NATURAL GAS Alternative names: DESCO/BAYOU JEAN DE, DESCO OIL CO - BAYOU JEAN LACROIX FIELD, RICHARD DAVIS
MONTEGUT MIMI MART (1229 HWY 55 in MONTEGUT, LA)
National Pollutant Discharge Elimination System NON-MAJOR (Tracking pollutant discharge elimination systems) - permit Alternative names: MONTEGUT MINI MART
GULF SOUTH PIPELINE CO LP - LIRETTE SEPA (5.6 MI S OF in MONTEGUT, LA)
AIR MINOR (AIRS/AFS) Business SIC classification: CRUDE PETROLEUM AND NATURAL GAS Alternative names: DANIEL J STECKLEIN, KOCH GW/LRETTE SEPAR
H'S CORNER STOP (581 HWY 665 in MONTEGUT, LA)
National Pollutant Discharge Elimination System NON-MAJOR (Tracking pollutant discharge elimination systems) - permit Business SIC classification: GROCERY STORES Alternative names: LEBOEUF ENTERPRISES LLC
OPELOUSAS ST (HWY 3043 NORTH in OPELOUSAS, LA)
CRITERIA AND HAZARDOUS AIR POLLUTANT INVENTORY (Inventory of air pollution sources) Business SIC classification: NATURAL GAS TRANSMISSION
Housing units lacking complete plumbing facilities: 3.6% Housing units lacking complete kitchen facilities: 4.8%
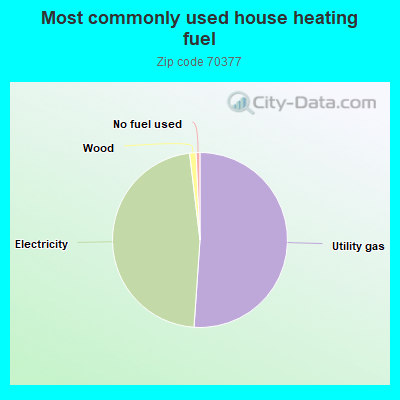
51.0%Utility gas
46.9%Electricity
1.2%Wood
0.7%No fuel used
Population in 1990: 3,892. Population change in the 1990s: +708 (+18.2%).
Place of birth for U.S.-born residents:
This state: 3,277
Northeast: 17
Midwest: 118
South: 143
West: 95
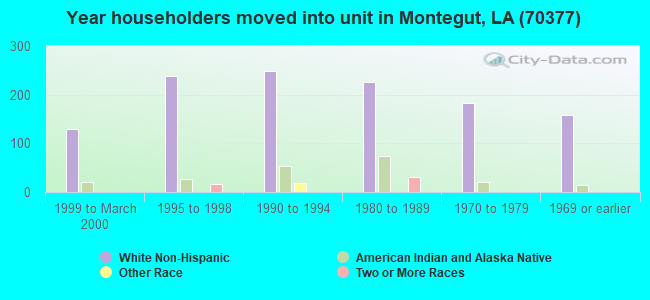
75% of the 70377 zip code residents lived in the same house 5 years ago. Out of people who lived in different houses, 70% lived in this county. Out of people who lived in different counties, 50% lived in Louisiana.
94% of the 70377 zip code residents lived in the same house 1 year ago. Out of people who lived in different houses, 99% moved from this county.
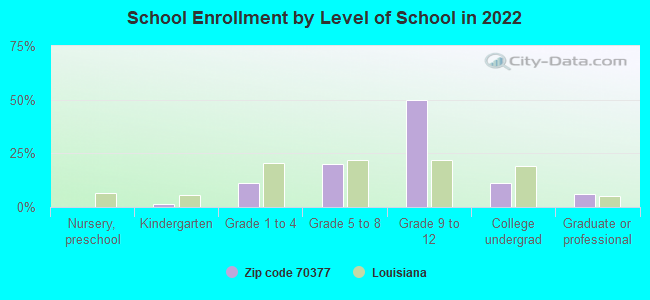
Private vs. public school enrollment:
Students in private schools in grades 1 to 8 (elementary and middle school):
Here:
0.0%
Louisiana:
19.6%
Students in private schools in grades 9 to 12 (high school): 45
Here:
13.1%
Louisiana:
18.3%
Students in private undergraduate colleges:
Here:
0.0%
Louisiana:
17.4%
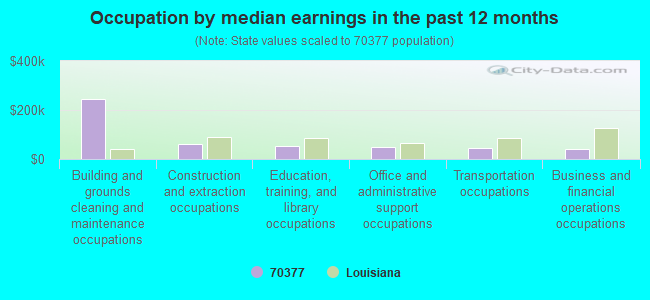
Occupation by median earnings in the past 12 months ($)
245,568Building and grounds cleaning and maintenance occupations
62,653Construction and extraction occupations
53,561Education, training, and library occupations
47,822Office and administrative support occupations
43,406Transportation occupations
42,563Business and financial operations occupations
Top industries in this zip code by the number of employees in 2005:
Other Services (except Public Administration): Religious Organizations (5-9 employees: 2 establishments, 1-4 employees: 2 establishments)
Wholesale Trade: Fish and Seafood Merchant Wholesalers (5-9: 1, 1-4: 3)
Accommodation and Food Services: Limited-Service Restaurants (5-9: 1)
Health Care and Social Assistance: Child Day Care Services (5-9: 1)
Administrative and Support and Waste Management and Remediation Services: Landscaping Services (1-4: 2)
Construction: Residential Remodelers (1-4: 1)
Arts, Entertainment, and Recreation: Agents and Managers for Artists, Athletes, Entertainers, and Other Public Figures (1-4: 1)
Fatal accident statistics in 2012:
Fatal accident count: 1
Vehicles involved in fatal accidents: 1
Fatal accidents caused by drunken drivers: 1
Fatalities: 2
Persons involved in fatal accidents: 3
Pedestrians involved in fatal accidents: 0
Home Mortgage Disclosure Act Aggregated Statistics For Year 2009 (Based on 126 partial tracts)
A) FHA, FSA/RHS & VA Home Purchase Loans
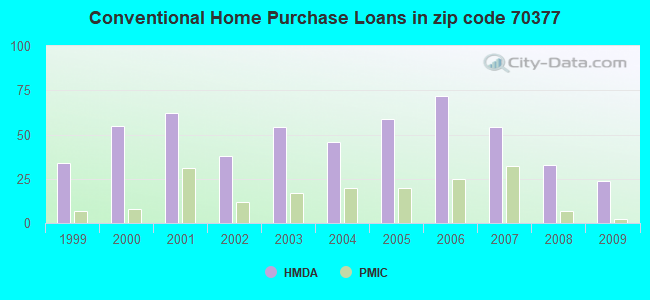
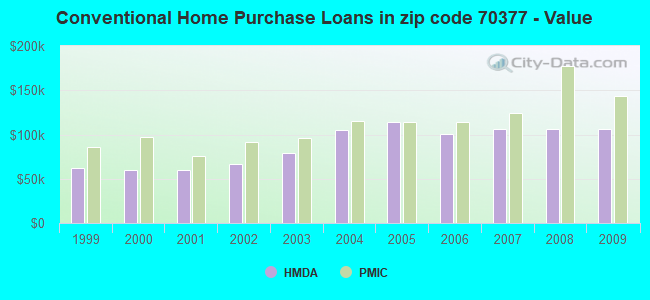
B) Conventional Home Purchase Loans
C) Refinancings
D) Home Improvement Loans
F) Non-occupant Loans on < 5 Family Dwellings (A B C & D)
G) Loans On Manufactured Home Dwelling (A B C & D)
Number
Average Value
Number
Average Value
Number
Average Value
Number
Average Value
Number
Average Value
Number
Average Value
LOANS ORIGINATED
15
$149,553
24
$106,573
74
$125,303
24
$51,580
12
$103,781
16
$52,166
APPLICATIONS APPROVED, NOT ACCEPTED
1
$203,850
7
$75,301
9
$119,500
2
$26,550
0
$0
5
$53,494
APPLICATIONS DENIED
4
$148,810
15
$81,245
55
$101,797
19
$40,757
3
$49,893
22
$69,568
APPLICATIONS WITHDRAWN
2
$153,460
4
$217,798
27
$136,541
2
$30,935
1
$103,940
1
$79,530
FILES CLOSED FOR INCOMPLETENESS
4
$157,518
3
$156,173
12
$95,808
2
$55,940
1
$395,970
2
$47,575
Aggregated Statistics For Year 2008 (Based on 126 partial tracts)
A) FHA, FSA/RHS & VA Home Purchase Loans
B) Conventional Home Purchase Loans
C) Refinancings
D) Home Improvement Loans
F) Non-occupant Loans on < 5 Family Dwellings (A B C & D)
G) Loans On Manufactured Home Dwelling (A B C & D)
Number
Average Value
Number
Average Value
Number
Average Value
Number
Average Value
Number
Average Value
Number
Average Value
LOANS ORIGINATED
12
$140,645
33
$105,983
67
$108,337
21
$33,084
9
$81,496
19
$63,073
APPLICATIONS APPROVED, NOT ACCEPTED
4
$99,360
7
$98,870
10
$111,747
3
$106,043
0
$0
7
$93,193
APPLICATIONS DENIED
7
$112,864
37
$69,003
39
$104,703
26
$40,970
1
$72,000
35
$54,732
APPLICATIONS WITHDRAWN
0
$0
5
$132,976
13
$147,890
4
$67,575
2
$149,660
3
$92,740
FILES CLOSED FOR INCOMPLETENESS
1
$207,880
3
$117,333
1
$191,450
0
$0
0
$0
0
$0
Aggregated Statistics For Year 2007 (Based on 126 partial tracts)
A) FHA, FSA/RHS & VA Home Purchase Loans
B) Conventional Home Purchase Loans
C) Refinancings
D) Home Improvement Loans
F) Non-occupant Loans on < 5 Family Dwellings (A B C & D)
G) Loans On Manufactured Home Dwelling (A B C & D)
Number
Average Value
Number
Average Value
Number
Average Value
Number
Average Value
Number
Average Value
Number
Average Value
LOANS ORIGINATED
11
$99,816
54
$105,766
73
$112,286
36
$33,382
7
$78,230
23
$70,013
APPLICATIONS APPROVED, NOT ACCEPTED
0
$0
21
$89,303
18
$100,410
6
$46,207
3
$59,523
16
$67,186
APPLICATIONS DENIED
1
$84,670
25
$75,701
75
$91,731
37
$44,820
5
$57,890
28
$62,928
APPLICATIONS WITHDRAWN
0
$0
4
$118,040
17
$139,805
6
$74,935
0
$0
2
$137,560
FILES CLOSED FOR INCOMPLETENESS
2
$41,385
1
$66,970
4
$147,572
0
$0
0
$0
0
$0
Aggregated Statistics For Year 2006 (Based on 126 partial tracts)
A) FHA, FSA/RHS & VA Home Purchase Loans
B) Conventional Home Purchase Loans
C) Refinancings
D) Home Improvement Loans
F) Non-occupant Loans on < 5 Family Dwellings (A B C & D)
G) Loans On Manufactured Home Dwelling (A B C & D)
Number
Average Value
Number
Average Value
Number
Average Value
Number
Average Value
Number
Average Value
Number
Average Value
LOANS ORIGINATED
5
$80,232
72
$100,440
74
$85,082
35
$31,006
7
$91,327
27
$49,204
APPLICATIONS APPROVED, NOT ACCEPTED
1
$93,860
17
$80,109
18
$92,659
5
$35,334
3
$63,313
13
$42,324
APPLICATIONS DENIED
4
$71,148
56
$70,452
56
$85,389
28
$49,475
2
$41,170
51
$55,302
APPLICATIONS WITHDRAWN
2
$95,635
5
$124,376
18
$125,377
5
$66,802
0
$0
2
$92,980
FILES CLOSED FOR INCOMPLETENESS
0
$0
1
$77,410
9
$97,146
0
$0
0
$0
0
$0
Aggregated Statistics For Year 2005 (Based on 126 partial tracts)
A) FHA, FSA/RHS & VA Home Purchase Loans
B) Conventional Home Purchase Loans
C) Refinancings
D) Home Improvement Loans
F) Non-occupant Loans on < 5 Family Dwellings (A B C & D)
G) Loans On Manufactured Home Dwelling (A B C & D)
Number
Average Value
Number
Average Value
Number
Average Value
Number
Average Value
Number
Average Value
Number
Average Value
LOANS ORIGINATED
7
$105,674
59
$113,689
98
$87,925
29
$41,089
10
$106,041
19
$55,837
APPLICATIONS APPROVED, NOT ACCEPTED
2
$157,770
19
$62,359
26
$81,610
9
$22,986
0
$0
13
$65,276
APPLICATIONS DENIED
8
$66,241
47
$63,079
93
$76,786
28
$39,993
4
$49,175
57
$52,491
APPLICATIONS WITHDRAWN
2
$64,815
15
$93,053
33
$100,852
6
$95,660
3
$109,777
5
$92,350
FILES CLOSED FOR INCOMPLETENESS
0
$0
3
$55,330
13
$123,293
0
$0
1
$107,650
0
$0
Aggregated Statistics For Year 2004 (Based on 126 partial tracts)
A) FHA, FSA/RHS & VA Home Purchase Loans
B) Conventional Home Purchase Loans
C) Refinancings
D) Home Improvement Loans
F) Non-occupant Loans on < 5 Family Dwellings (A B C & D)
G) Loans On Manufactured Home Dwelling (A B C & D)
Number
Average Value
Number
Average Value
Number
Average Value
Number
Average Value
Number
Average Value
Number
Average Value
LOANS ORIGINATED
12
$65,525
46
$104,927
117
$89,349
42
$24,566
5
$42,938
14
$48,354
APPLICATIONS APPROVED, NOT ACCEPTED
4
$40,342
18
$77,053
38
$93,595
13
$29,293
2
$85,380
14
$53,511
APPLICATIONS DENIED
9
$67,483
33
$56,474
122
$75,758
37
$32,363
6
$40,520
50
$51,820
APPLICATIONS WITHDRAWN
0
$0
7
$66,371
42
$90,492
4
$21,690
2
$44,320
4
$58,552
FILES CLOSED FOR INCOMPLETENESS
1
$131,160
3
$55,597
22
$103,223
1
$44,840
0
$0
2
$111,475
Aggregated Statistics For Year 2003 (Based on 126 partial tracts)
A) FHA, FSA/RHS & VA Home Purchase Loans
B) Conventional Home Purchase Loans
C) Refinancings
D) Home Improvement Loans
F) Non-occupant Loans on < 5 Family Dwellings (A B C & D)
Number
Average Value
Number
Average Value
Number
Average Value
Number
Average Value
Number
Average Value
LOANS ORIGINATED
7
$76,909
54
$79,137
213
$77,522
39
$21,751
8
$78,811
APPLICATIONS APPROVED, NOT ACCEPTED
3
$56,930
8
$66,589
52
$66,142
10
$17,787
0
$0
APPLICATIONS DENIED
4
$41,552
33
$48,653
116
$66,596
36
$16,250
3
$41,400
APPLICATIONS WITHDRAWN
0
$0
3
$72,720
30
$87,435
3
$3,477
1
$7,420
FILES CLOSED FOR INCOMPLETENESS
0
$0
0
$0
4
$131,092
0
$0
0
$0
Aggregated Statistics For Year 2002 (Based on 124 partial tracts)
A) FHA, FSA/RHS & VA Home Purchase Loans
B) Conventional Home Purchase Loans
C) Refinancings
D) Home Improvement Loans
F) Non-occupant Loans on < 5 Family Dwellings (A B C & D)
Number
Average Value
Number
Average Value
Number
Average Value
Number
Average Value
Number
Average Value
LOANS ORIGINATED
10
$76,645
38
$66,476
104
$66,508
42
$16,961
1
$15,640
APPLICATIONS APPROVED, NOT ACCEPTED
2
$78,235
8
$52,289
26
$66,149
5
$30,272
1
$22,130
APPLICATIONS DENIED
6
$56,485
50
$46,101
74
$50,274
24
$22,182
4
$30,572
APPLICATIONS WITHDRAWN
1
$90,330
4
$77,405
28
$44,030
2
$11,350
0
$0
FILES CLOSED FOR INCOMPLETENESS
0
$0
0
$0
3
$100,647
0
$0
0
$0
Aggregated Statistics For Year 2001 (Based on 124 partial tracts)
A) FHA, FSA/RHS & VA Home Purchase Loans
B) Conventional Home Purchase Loans
C) Refinancings
D) Home Improvement Loans
F) Non-occupant Loans on < 5 Family Dwellings (A B C & D)
Number
Average Value
Number
Average Value
Number
Average Value
Number
Average Value
Number
Average Value
LOANS ORIGINATED
6
$73,850
62
$60,020
106
$70,439
50
$18,585
8
$27,760
APPLICATIONS APPROVED, NOT ACCEPTED
0
$0
17
$51,154
31
$64,982
14
$29,032
1
$18,880
APPLICATIONS DENIED
0
$0
60
$37,824
79
$55,148
33
$18,751
8
$18,160
APPLICATIONS WITHDRAWN
0
$0
8
$64,236
34
$68,409
2
$3,655
1
$51,970
FILES CLOSED FOR INCOMPLETENESS
0
$0
2
$105,460
5
$62,320
0
$0
0
$0
Aggregated Statistics For Year 2000 (Based on 124 partial tracts)
A) FHA, FSA/RHS & VA Home Purchase Loans
B) Conventional Home Purchase Loans
C) Refinancings
D) Home Improvement Loans
F) Non-occupant Loans on < 5 Family Dwellings (A B C & D)
Number
Average Value
Number
Average Value
Number
Average Value
Number
Average Value
Number
Average Value
LOANS ORIGINATED
4
$54,135
55
$59,729
59
$56,725
34
$19,727
5
$44,160
APPLICATIONS APPROVED, NOT ACCEPTED
3
$61,273
16
$49,454
24
$45,942
12
$11,518
4
$10,550
APPLICATIONS DENIED
4
$53,778
51
$39,067
58
$42,169
27
$20,276
8
$24,509
APPLICATIONS WITHDRAWN
2
$52,675
2
$114,415
33
$53,689
1
$9,440
0
$0
FILES CLOSED FOR INCOMPLETENESS
0
$0
0
$0
7
$43,980
1
$12,980
0
$0
Aggregated Statistics For Year 1999 (Based on 63 partial tracts)
A) FHA, FSA/RHS & VA Home Purchase Loans
B) Conventional Home Purchase Loans
C) Refinancings
D) Home Improvement Loans
F) Non-occupant Loans on < 5 Family Dwellings (A B C & D)
2002 - 2018 National Fire Incident Reporting System (NFIRS) incidents
According to the data from the years 2002 - 2018 the average number of fires per year is 18. The highest number of reported fires - 48 took place in 2017, and the least - 0 in 2007. The data has a dropping trend.
When looking into fire subcategories, the most incidents belonged to: Outside Fires (67.5%), and Structure Fires (23.5%).
Fire incident types reported to NFIRS in Zip Code 70377


 Nearest zip codes: 70344, 70353, 70343, 70354, 70374, 70363.
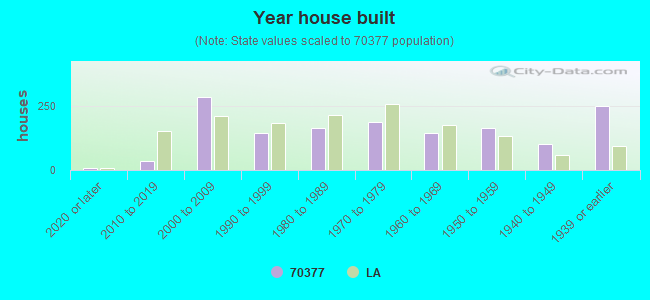


 According to the data from the years 2002 - 2018 the average number of fires per year is 18. The highest number of reported fires - 48 took place in 2017, and the least - 0 in 2007. The data has a dropping trend.
 When looking into fire subcategories, the most incidents belonged to: Outside Fires (67.5%), and Structure Fires (23.5%).