Estimated zip code population in 2022: 3,678 Zip code population in 2010: 4,096 Zip code population in 2000: 4,295
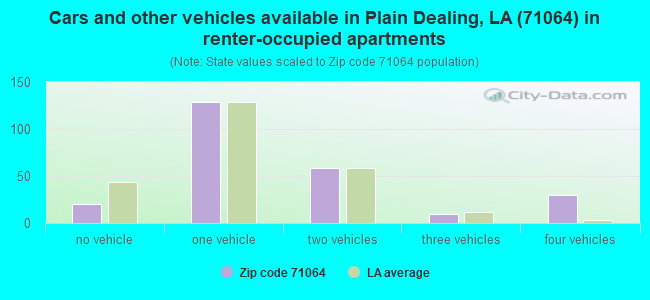
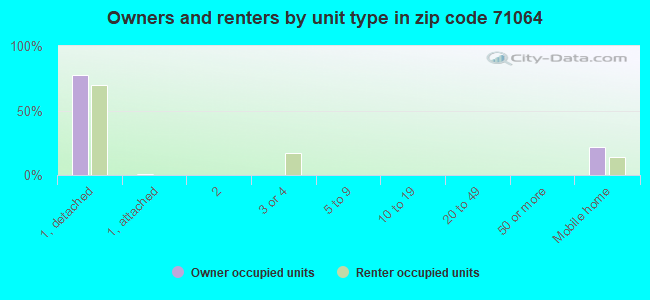
Houses and condos: 1,820 Renter-occupied apartments: 243
% of renters here:
18%
State:
32%
March 2022 cost of living index in zip code 71064: 78.8 (low, U.S. average is 100)
Land area: 214.8 sq. mi. Water area: 4.0 sq. mi.
Population density: 17 people per square mile
(very low).
OSM Map
General Map
Google Map
MSN Map
OSM Map
General Map
Google Map
MSN Map
OSM Map
General Map
Google Map
MSN Map
OSM Map
General Map
Google Map
MSN Map
Please wait while loading the map...
Real estate property taxes paid for housing units in 2022:
This zip code:
0.4% ($454)
Louisiana:
0.5% ($1,127)
Median real estate property taxes paid for housing units with mortgages in 2022: $566 (0.4%) Median real estate property taxes paid for housing units with no mortgage in 2022: $207 (0.2%)
Business Search- 14 Million verified businesses
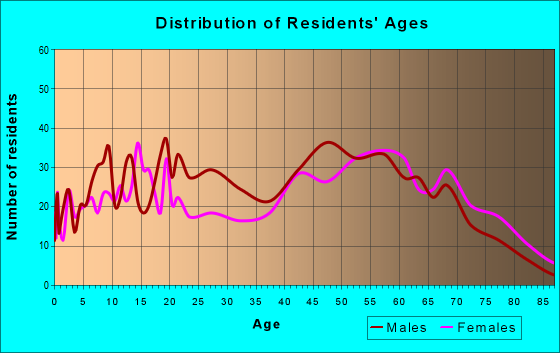
Males: 1,684
(45.8%)
Females: 1,994
(54.2%)
For population 25 years and over in 71064:
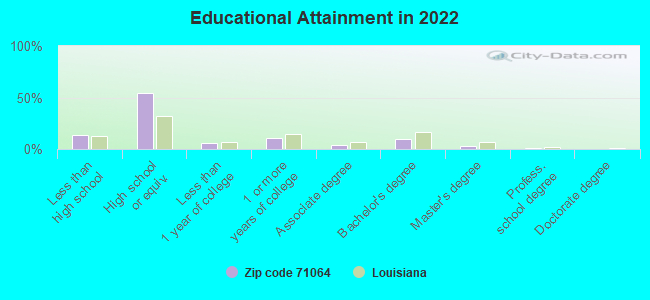
High school or higher: 85.7%
Bachelor's degree or higher: 12.7%
Graduate or professional degree: 3.5%
Unemployed: 4.5%
Mean travel time to work (commute): 32.9 minutes
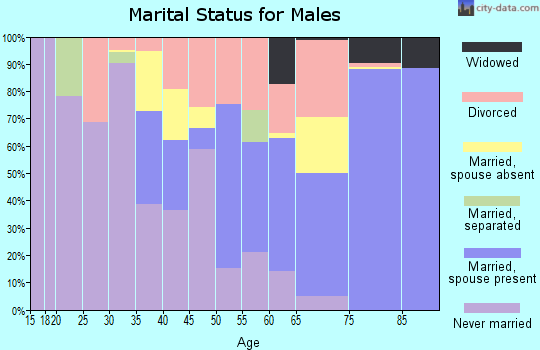
For population 15 years and over in 71064:
Never married: 36.0%
Now married: 38.4%
Separated: 0.5%
Widowed: 7.7%
Divorced: 17.4%
Zip code 71064 compared to state average:
Median house value below state average.
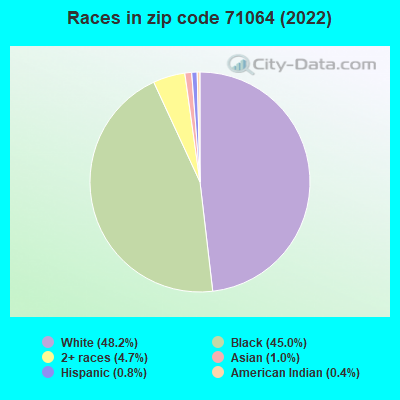
Hispanic race population percentage significantly below state average.
Median age significantly above state average.
Foreign-born population percentage significantly below state average.
Renting percentage below state average.
Length of stay since moving in significantly above state average.
Percentage of population with a bachelor's degree or higher below state average.
Averages for the 2020 tax year for zip code 71064, filed in 2021:
Average Adjusted Gross Income (AGI) in 2020: $36,659 (Individual Income Tax Returns)
Here:
$36,659
State:
$60,757
Salary/wage: $36,367 (reported on 72.5% of returns)
Here:
$36,367
State:
$50,882
(% of AGI for various income ranges: 1232.0% for AGIs below $25k, 3452.8% for AGIs $25k-50k, 6895.5% for AGIs $50k-75k, 8258.3% for AGIs $75k-100k, 20450.0% for AGIs $100k-200k)
Taxable interest for individuals: $323 (reported on 28.1% of returns)
This zip code:
$323
Louisiana:
$1,576
(% of AGI for various income ranges: 4.9% for AGIs below $25k, 13.1% for AGIs $25k-50k, 28.2% for AGIs $50k-75k, 20.0% for AGIs $75k-100k, 60.0% for AGIs $100k-200k)
Ordinary dividends: $2,220 (reported on 6.5% of returns)
Here:
$2,220
State:
$7,743
(% of AGI for various income ranges: 6.7% for AGIs below $25k, 27.2% for AGIs $25k-50k, 188.3% for AGIs $100k-200k)
Net capital gain/loss in AGI: +$1,511 (reported on 5.9% of returns)
Here:
+$1,511
State:
+$16,917
(% of AGI for various income ranges: 13.8% for AGIs $25k-50k, 163.3% for AGIs $100k-200k)
Profit/loss from business: +$1,032 (reported on 12.4% of returns)
Here:
+$1,032
State:
+$7,679
(% of AGI for various income ranges: 215.5% for AGIs $50k-75k, 123.3% for AGIs $100k-200k)
Taxable individual retirement arrangement distribution: $12,310 (reported on 6.5% of returns)
71064:
$12,310
Louisiana:
$20,716
(% of AGI for various income ranges: 41.1% for AGIs below $25k, 122.4% for AGIs $25k-50k, 1151.7% for AGIs $75k-100k)
Total itemized deductions: $30,350 (reported on 2.6% of returns)
Here:
$30,350
State:
$36,265
(% of AGI for various income ranges: 1103.6% for AGIs $50k-75k)
Charity contributions: $17,667 (reported on 2.0% of returns)
Here:
$17,667
State:
$13,106
(% of AGI for various income ranges: 481.8% for AGIs $50k-75k)
Taxes paid: $4,500 (reported on 2.6% of returns)
71064:
$4,500
State:
$6,643
(% of AGI for various income ranges: 163.6% for AGIs $50k-75k)
Earned income credit: $2,575 (reported on 23.5% of returns)
Here:
$2,575
State:
$2,671
(% of AGI for various income ranges: 151.1% for AGIs below $25k, 85.2% for AGIs $25k-50k)
Percentage of individuals using paid preparers for their 2020 taxes: 77.8%
Here:
78%
State:
92%
(% for various income ranges: 65.4% for AGIs below $25k, 89.2% for AGIs $25k-50k, 88.9% for AGIs $50k-75k, 88.9% for AGIs $75k-100k, 100.0% for AGIs $100k-200k)
Averages for the 2012 tax year for zip code 71064, filed in 2013:
Average Adjusted Gross Income (AGI) in 2012: $38,632 (Individual Income Tax Returns)
Here:
$38,632
State:
$56,730
Salary/wage: $33,987 (reported on 82.6% of returns)
Here:
$33,987
State:
$45,545
(% of AGI for various income ranges: 78.7% for AGIs below $25k, 80.5% for AGIs $25k-50k, 74.4% for AGIs $50k-75k, 77.7% for AGIs $75k-100k, 57.5% for AGIs $100k-200k)
Taxable interest for individuals: $740 (reported on 20.8% of returns)
This zip code:
$740
Louisiana:
$1,804
(% of AGI for various income ranges: 0.4% for AGIs below $25k, 0.4% for AGIs $25k-50k, 0.3% for AGIs $50k-75k, 0.3% for AGIs $75k-100k, 0.5% for AGIs $100k-200k)
Ordinary dividends: $1,300 (reported on 8.3% of returns)
Here:
$1,300
State:
$7,610
(% of AGI for various income ranges: 0.1% for AGIs below $25k, 0.5% for AGIs $25k-50k, 0.3% for AGIs $50k-75k, 0.4% for AGIs $100k-200k)
Net capital gain/loss in AGI: +$900 (reported on 5.6% of returns)
Here:
+$900
State:
+$17,096
Profit/loss from business: +$3,891 (reported on 15.3% of returns)
Here:
+$3,891
State:
+$12,088
(% of AGI for various income ranges: 5.9% for AGIs below $25k, 0.7% for AGIs $25k-50k, 0.3% for AGIs $50k-75k, 1.2% for AGIs $100k-200k)
Taxable individual retirement arrangement distribution: $10,109 (reported on 7.6% of returns)
71064:
$10,109
Louisiana:
$16,085
(% of AGI for various income ranges: 1.7% for AGIs below $25k, 1.7% for AGIs $25k-50k, 2.6% for AGIs $50k-75k, 5.3% for AGIs $75k-100k)
Total itemized deductions: $19,880 (27% of AGI, reported on 17.4% of returns)
Here:
$19,880
State:
$23,585
Here:
27.0% of AGI
State:
18.1% of AGI
(% of AGI for various income ranges: 4.3% for AGIs below $25k, 10.0% for AGIs $25k-50k, 10.9% for AGIs $50k-75k, 8.5% for AGIs $75k-100k, 9.8% for AGIs $100k-200k)
Charity contributions: $6,383 (reported on 12.5% of returns)
Here:
$6,383
State:
$5,533
(% of AGI for various income ranges: 2.6% for AGIs $25k-50k, 1.7% for AGIs $50k-75k, 1.9% for AGIs $75k-100k, 3.3% for AGIs $100k-200k)
Taxes paid: $2,900 (reported on 16.7% of returns)
71064:
$2,900
State:
$6,282
(% of AGI for various income ranges: 0.2% for AGIs below $25k, 0.9% for AGIs $25k-50k, 1.2% for AGIs $50k-75k, 1.3% for AGIs $75k-100k, 2.3% for AGIs $100k-200k)
Earned income credit: $2,690 (reported on 36.1% of returns)
Here:
$2,690
State:
$2,633
(% of AGI for various income ranges: 13.0% for AGIs below $25k, 1.4% for AGIs $25k-50k)
Percentage of individuals using paid preparers for their 2012 taxes: 61.1%
Here:
61%
State:
57%
(% for various income ranges: 57.1% for AGIs below $25k, 64.9% for AGIs $25k-50k, 64.7% for AGIs $50k-75k, 60.0% for AGIs $75k-100k, 70.0% for AGIs $100k-200k)
Averages for the 2004 tax year for zip code 71064, filed in 2005:
Average Adjusted Gross Income (AGI) in 2004: $30,101 (Individual Income Tax Returns)
Here:
$30,101
State:
$39,411
Salary/wage: $25,861 (reported on 88.7% of returns)
Here:
$25,861
State:
$34,434
(% of AGI for various income ranges: 99.3% for AGIs below $10k, 86.8% for AGIs $10k-25k, 85.3% for AGIs $25k-50k, 78.3% for AGIs $50k-75k, 73.6% for AGIs $75k-100k, 35.7% for AGIs over 100k)
Taxable interest for individuals: $1,839 (reported on 23.1% of returns)
This zip code:
$1,839
Louisiana:
$1,606
(% of AGI for various income ranges: 2.0% for AGIs below $10k, 0.9% for AGIs $10k-25k, 0.6% for AGIs $25k-50k, 0.5% for AGIs $50k-75k, 0.5% for AGIs $75k-100k, 5.7% for AGIs over 100k)
Taxable dividends: $977 (reported on 8.5% of returns)
Here:
$977
State:
$3,235
(% of AGI for various income ranges: 0.3% for AGIs below $10k, 0.2% for AGIs $10k-25k, 0.2% for AGIs $25k-50k, 0.3% for AGIs $50k-75k, 0.1% for AGIs $75k-100k, 0.7% for AGIs over 100k)
Net capital gain/loss: +$11,557 (reported on 6.8% of returns)
Here:
+$11,557
State:
+$8,531
(% of AGI for various income ranges: -0.2% for AGIs $10k-25k, 0.6% for AGIs $25k-50k, 0.6% for AGIs $50k-75k, 16.2% for AGIs over 100k)
Profit/loss from business: +$4,129 (reported on 9.9% of returns)
Here:
+$4,129
State:
+$9,128
(% of AGI for various income ranges: 10.2% for AGIs below $10k, 1.9% for AGIs $10k-25k, -0.0% for AGIs $25k-50k, 2.0% for AGIs $50k-75k, 2.1% for AGIs $75k-100k)
IRA payment deduction: $3,250 (reported on 0.8% of returns)
71064:
$3,250
Louisiana:
$3,055
Total itemized deductions: $18,255 (25% of AGI, reported on 13.3% of returns)
Here:
$18,255
State:
$18,222
Here:
25.2% of AGI
State:
20.3% of AGI
(% of AGI for various income ranges: 3.4% for AGIs $10k-25k, 6.9% for AGIs $25k-50k, 9.3% for AGIs $50k-75k, 11.1% for AGIs $75k-100k, 14.7% for AGIs over 100k)
Charity contributions deductions: $5,464 (7% of AGI, reported on 10.6% of returns)
Here:
$5,464
State:
$4,190
Here:
7.1% of AGI
State:
4.4% of AGI
(% of AGI for various income ranges: 0.8% for AGIs $10k-25k, 1.1% for AGIs $25k-50k, 2.1% for AGIs $50k-75k, 3.0% for AGIs $75k-100k, 4.6% for AGIs over 100k)
Total tax: $4,012 (reported on 59.6% of returns)
71064:
$4,012
State:
$6,529
(% of AGI for various income ranges: 2.1% for AGIs below $10k, 2.3% for AGIs $10k-25k, 6.2% for AGIs $25k-50k, 8.9% for AGIs $50k-75k, 10.7% for AGIs $75k-100k, 17.4% for AGIs over 100k)
Earned income credit: $2,243 (reported on 36.6% of returns)
Here:
$2,243
State:
$2,103
Percentage of individuals using paid preparers for their 2004 taxes: 67.3%
Here:
67%
State:
61%
(% for various income ranges: 65.9% for AGIs below $10k, 71.6% for AGIs $10k-25k, 66.0% for AGIs $25k-50k, 58.7% for AGIs $50k-75k, 63.0% for AGIs $75k-100k, 80.0% for AGIs over 100k)
Household received Food Stamps/SNAP in the past 12 months: 278 Household did not receive Food Stamps/SNAP in the past 12 months: 1,102
Women who had a birth in the past 12 months: 45 (0 now married, 46 unmarried) Women who did not have a birth in the past 12 months: 684 (125 now married, 563 unmarried)
Housing units in zip code 71064 with a mortgage: 323 (27 second mortgage) Median monthly owner costs for units with a mortgage: $936 Median monthly owner costs for units without a mortgage: $344
Residents with income below the poverty level in 2022:
This zip code:
22.4%
Whole state:
18.6%
Residents with income below 50% of the poverty level in 2022:
This zip code:
16.6%
Whole state:
10.1%
Median number of rooms in houses and condos:
Here:
6.0
State:
6.2
Median number of rooms in apartments:
Here:
4.8
State:
4.4
Notable locations in this zip code not listed on our city pages
Notable locations in zip code 71064: Missionary Ferry (A), Dogwood Boy Scout Camp (B), Plain Dealing Volunteer Fire Department (C), Benton Fire District 4 Station 5 (D), Northeast Bossier Fire District 5 (E). Display/hide their locations on the map
Churches in zip code 71064 include: Sunflower Church (A), Union Church (B), Walker Chapel (C), Bookers Chapel (D), Elizabeth Church (E), Immanuel Church (F), Israelite Church (G), Lewisville Church (H), New Bethel Church (I). Display/hide their locations on the map
Cemeteries: Salem Cemetery (1), New Egypt Hill Cemetery (2), Graham Cemetery (3), Hill Cemetery (4), Boggs Cemetery (5), Oak Hill Cemetery (6), Smith-Gilmer Cemetery (7). Display/hide their locations on the map
Lakes and reservoirs: Halfmoon Lake (A), Old River (B), Dutch Johns Lake (C), Cypress Bayou Number Two (D), Cypress Bayou Number Three (E), Ivan Lake (F), Cypress Bayou Number One (G), Ollie Holm Lake (H). Display/hide their locations on the map
Streams, rivers, and creeks: Dry Bayou (A), Hog Branch (B), Bounds Branch (C), Flat Branch (D), Bird Branch (E), Bear Creek (F), Posten Bayou (G), East Branch Caney Creek (H), Dutch John Branch (I). Display/hide their locations on the map
In group quarters: 662 (-1 institutionalized population)
Size of family households: 591 2-persons, 132 3-persons, 43 4-persons, 102 5-persons, 10 6-persons
Size of nonfamily households: 474 1-person, 25 2-persons
105 married couples with children.
262 single-parent households (17 men, 245 women).
97.8% of residents of 71064 zip code speak English at home.
0.8% of residents speak Spanish at home (89% very well, 11% not at all).
0.8% of residents speak other Indo-European language at home (15% very well, 85% well).
1.0% of residents speak Asian or Pacific Island language at home (100% not well).
0.1% of residents speak other language at home (100% very well).
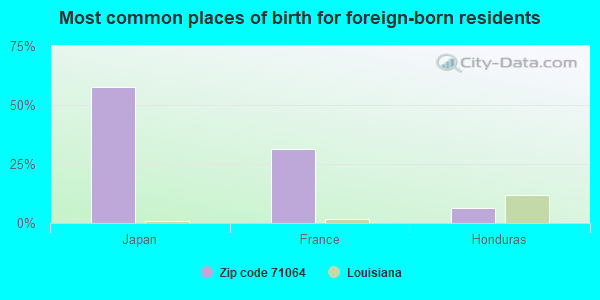
Foreign born population: 62 (1.7%) (60.5% of them are naturalized citizens)
This zip code:
1.7%
Whole state:
4.2%
58%Japan
31%France
6%Honduras
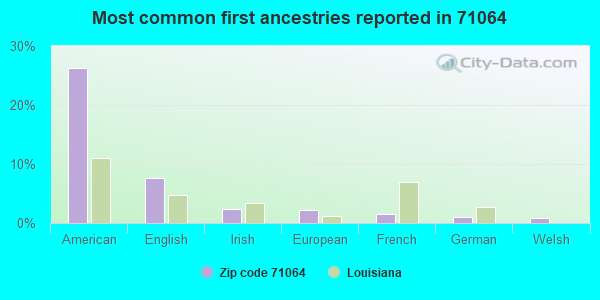
26%American
8%English
2%Irish
2%European
2%French
1%German
1%Welsh
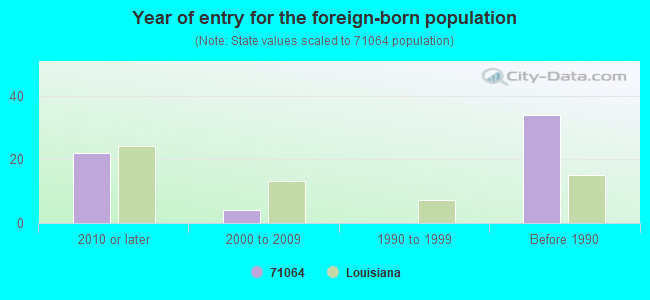
Year of entry for the foreign-born population
222010 or later
42000 to 2009
01990 to 1999
34Before 1990
Major facilities with environmental interests located in this zip code:
PLAIN DEALING ELEMENTARY SCHOOL (600 SOUTH PERRIN STREET in PLAIN DEALING, LA)
(Geographic Names Information System) (National Center for Education Statistics) - STATE ID-008021 Organizations: BOSSIER PARISH SCHOOL BOARD (SCHOOL DISTRICT)
PLAIN DEALING HIGH SCHOOL (300 EAST VANCE STREET in PLAIN DEALING, LA)
(Geographic Names Information System) (National Center for Education Statistics) - STATE ID-008022 Organizations: BOSSIER PARISH SCHOOL BOARD (SCHOOL DISTRICT)
PLAIN DEALING MIDDLE SCHOOL (300 EAST VANCE STREET in PLAIN DEALING, LA)
(National Center for Education Statistics) - STATE ID-008039 Organizations: BOSSIER PARISH SCHOOL BOARD (SCHOOL DISTRICT)
ANTHONY FOREST PRODUCTION CO (HIGHWAY 3 NORTH in PLAIN DEALING, LA)
AIR MINOR (AIRS/AFS) National Pollutant Discharge Elimination System NON-MAJOR (Tracking pollutant discharge elimination systems) - permit Business SIC classification: SAWMILLS AND PLANING MILLS, GENERAL Alternative names: JOHN B HOWELL
QUALITY PEST CONTROL (HWY 2 WEST in PLAIN DEALING, LA)
GLEASON FORD INC (HWY 3 AT E PALMETTO in PLAIN DEALING, LA)
(Resource Conservation and Recovery Act (tracking hazardous waste)) Organizations: BOBBY R JENKINS & WAYNE GLEASON (CONTACT/OWNER)
ALLEN #1 2 CENTRAL FACILITY - ROCKY MO (6 MI SE OF in PLAIN DEALING, LA)
AIR MINOR (AIRS/AFS) Business SIC classification: CRUDE PETROLEUM AND NATURAL GAS
ANTRIM ESTATE 35-1 FACILITY (6.6 MI NE OF in PLAIN DEALING, LA)
AIR MINOR (AIRS/AFS) Business SIC classification: CRUDE PETROLEUM AND NATURAL GAS Alternative names: DEVON ENERGY ANTRIM, ENSIGHT ANTRIM ESTAT
APACHE CORP - ARKANA COMPRESSOR STATION (HWY 3 & HWY 157 in PLAIN DEALING, LA)
AIR MINOR (AIRS/AFS) Business SIC classification: CRUDE PETROLEUM AND NATURAL GAS Alternative names: APACHE corporation, DAVID WOOLF
ARDIS #2 WELLSITE PRODUCTION FACILITY - (OFF BODCAU RD 1.6 MI SE OF HWY in PLAIN DEALING, LA)
AIR MINOR (AIRS/AFS) Business SIC classification: CRUDE PETROLEUM AND NATURAL GAS Alternative names: ARDIS NO 2 WELLSITE PRODUCTION FACILITY
BARRY ROCK OIL COMPANY (WALLACE #1 WELL in PLAIN DEALING, LA)
National Pollutant Discharge Elimination System NON-MAJOR (Tracking pollutant discharge elimination systems) - permit
NORTH CARTERVILLE FIELD PRODUCTION FACIL (2 MI NE OF in PLAIN DEALING, LA)
AIR MINOR (AIRS/AFS) Business SIC classification: CRUDE PETROLEUM AND NATURAL GAS Alternative names: JOHN BARNWELL, SMITH OPERATING/MGMT
PLAIN DEALING CHARCO (HWY 2 WEST OF in PLAIN DEALING, LA)
AIR MINOR (AIRS/AFS) Business SIC classification: NONCLASSIFIABLE ESTABLISHMENTS Alternative names: CHARLES C SAVOIE JR
Housing units lacking complete plumbing facilities: 9.1% Housing units lacking complete kitchen facilities: 13.1%
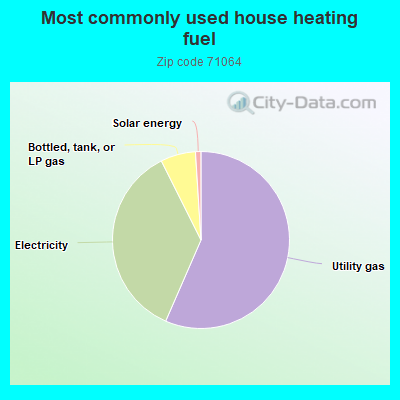
56.6%Utility gas
36.1%Electricity
6.4%Bottled, tank, or LP gas
1.0%Solar energy
Population in 1990: 4,904.
Place of birth for U.S.-born residents:
This state: 2,992
Northeast: 8
Midwest: 147
South: 416
West: 50
69% of the 71064 zip code residents lived in the same house 5 years ago. Out of people who lived in different houses, 67% lived in this county. Out of people who lived in different counties, 50% lived in Louisiana.
93% of the 71064 zip code residents lived in the same house 1 year ago. Out of people who lived in different houses, 69% moved from this county. Out of people who lived in different houses, 17% moved from different county within same state. Out of people who lived in different houses, 11% moved from different state. Out of people who lived in different houses, 3% moved from abroad.
Private vs. public school enrollment:
Students in private schools in grades 1 to 8 (elementary and middle school): 7
Here:
5.0%
Louisiana:
19.6%
Students in private schools in grades 9 to 12 (high school):
Here:
0.0%
Louisiana:
18.3%
Students in private undergraduate colleges: 10
Here:
6.2%
Louisiana:
17.4%
Occupation by median earnings in the past 12 months ($)
60,364Management occupations
59,655Health diagnosing and treating practitioners and other technical occupations
43,588Health technologists and technicians
37,462Food preparation and serving related occupations
27,957Community and social service occupations
24,920Office and administrative support occupations
Top industries in this zip code by the number of employees in 2005:
Health Care and Social Assistance: Nursing Care Facilities (50-99 employees: 1 establishment)
Administrative and Support and Waste Management and Remediation Services: Temporary Help Services (20-49: 1)
Educational Services: Elementary and Secondary Schools (10-19: 1)
Construction: All Other Specialty Trade Contractors (10-19: 1)
Finance and Insurance: Insurance Agencies and Brokerages (5-9: 1, 1-4: 1)
People in group quarters in 2010:
250 people in local jails and other municipal confinement facilities
76 people in nursing facilities/skilled-nursing facilities
People in group quarters in 2000:
190 people in local jails and other confinement facilities (including police lockups)
66 people in nursing homes
11 people in homes for the mentally retarded
Fatal accident statistics in 2014:
Fatal accident count: 1
Vehicles involved in fatal accidents: 1
Fatal accidents caused by drunken drivers: 0
Fatalities: 1
Persons involved in fatal accidents: 1
Pedestrians involved in fatal accidents: 0
Fatal accident statistics in 2012:
Fatal accident count: 1
Vehicles involved in fatal accidents: 1
Fatal accidents caused by drunken drivers: 0
Fatalities: 1
Persons involved in fatal accidents: 1
Pedestrians involved in fatal accidents: 0
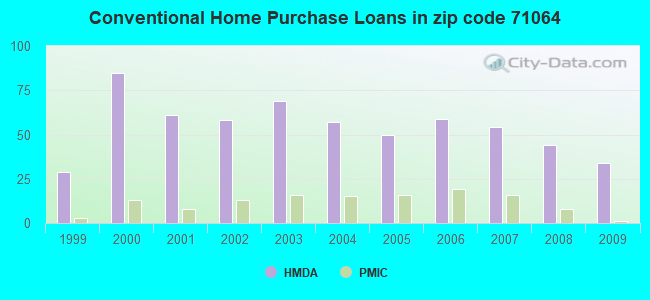
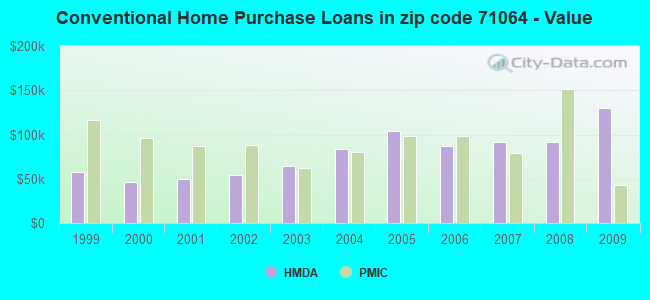
Home Mortgage Disclosure Act Aggregated Statistics For Year 2009 (Based on 2 partial tracts)
A) FHA, FSA/RHS & VA Home Purchase Loans
B) Conventional Home Purchase Loans
C) Refinancings
D) Home Improvement Loans
F) Non-occupant Loans on < 5 Family Dwellings (A B C & D)
G) Loans On Manufactured Home Dwelling (A B C & D)
Number
Average Value
Number
Average Value
Number
Average Value
Number
Average Value
Number
Average Value
Number
Average Value
LOANS ORIGINATED
32
$141,140
34
$129,784
117
$163,144
11
$22,919
8
$98,924
30
$61,882
APPLICATIONS APPROVED, NOT ACCEPTED
4
$195,152
3
$112,800
12
$87,183
4
$43,142
0
$0
5
$59,052
APPLICATIONS DENIED
8
$153,526
15
$90,329
71
$134,326
8
$46,344
5
$55,006
19
$82,737
APPLICATIONS WITHDRAWN
4
$115,608
4
$271,325
32
$161,784
1
$26,960
1
$56,620
3
$49,433
FILES CLOSED FOR INCOMPLETENESS
1
$233,240
3
$47,637
4
$99,092
1
$43,140
0
$0
4
$82,915
Aggregated Statistics For Year 2008 (Based on 2 partial tracts)
A) FHA, FSA/RHS & VA Home Purchase Loans
B) Conventional Home Purchase Loans
C) Refinancings
D) Home Improvement Loans
F) Non-occupant Loans on < 5 Family Dwellings (A B C & D)
G) Loans On Manufactured Home Dwelling (A B C & D)
Number
Average Value
Number
Average Value
Number
Average Value
Number
Average Value
Number
Average Value
Number
Average Value
LOANS ORIGINATED
15
$114,058
44
$91,616
89
$129,609
20
$34,379
15
$42,963
34
$58,686
APPLICATIONS APPROVED, NOT ACCEPTED
1
$60,670
8
$79,206
13
$79,232
7
$26,579
0
$0
5
$41,524
APPLICATIONS DENIED
7
$93,411
34
$59,479
53
$98,851
35
$34,167
11
$33,705
31
$58,842
APPLICATIONS WITHDRAWN
4
$165,155
8
$125,551
19
$109,914
3
$17,077
1
$51,230
4
$47,188
FILES CLOSED FOR INCOMPLETENESS
1
$102,460
4
$117,968
5
$124,574
0
$0
0
$0
1
$64,710
Aggregated Statistics For Year 2007 (Based on 2 partial tracts)
A) FHA, FSA/RHS & VA Home Purchase Loans
B) Conventional Home Purchase Loans
C) Refinancings
D) Home Improvement Loans
F) Non-occupant Loans on < 5 Family Dwellings (A B C & D)
G) Loans On Manufactured Home Dwelling (A B C & D)
Number
Average Value
Number
Average Value
Number
Average Value
Number
Average Value
Number
Average Value
Number
Average Value
LOANS ORIGINATED
34
$117,016
54
$91,802
89
$90,693
46
$34,702
20
$49,344
54
$62,516
APPLICATIONS APPROVED, NOT ACCEPTED
0
$0
20
$105,160
23
$126,203
5
$46,108
0
$0
11
$56,502
APPLICATIONS DENIED
7
$106,123
44
$66,736
57
$84,464
32
$26,206
4
$21,235
44
$48,229
APPLICATIONS WITHDRAWN
5
$85,206
12
$163,694
42
$121,242
3
$44,040
0
$0
9
$81,791
FILES CLOSED FOR INCOMPLETENESS
1
$78,200
0
$0
4
$159,762
0
$0
0
$0
1
$78,200
Aggregated Statistics For Year 2006 (Based on 2 partial tracts)
A) FHA, FSA/RHS & VA Home Purchase Loans
B) Conventional Home Purchase Loans
C) Refinancings
D) Home Improvement Loans
F) Non-occupant Loans on < 5 Family Dwellings (A B C & D)
G) Loans On Manufactured Home Dwelling (A B C & D)
Number
Average Value
Number
Average Value
Number
Average Value
Number
Average Value
Number
Average Value
Number
Average Value
LOANS ORIGINATED
16
$122,012
59
$87,359
104
$109,839
42
$34,283
13
$35,987
36
$67,934
APPLICATIONS APPROVED, NOT ACCEPTED
0
$0
12
$93,812
31
$94,678
4
$64,713
0
$0
7
$46,994
APPLICATIONS DENIED
7
$39,097
46
$58,940
69
$95,234
43
$41,543
9
$51,231
46
$47,040
APPLICATIONS WITHDRAWN
3
$98,420
8
$92,351
27
$136,168
3
$94,823
0
$0
7
$91,484
FILES CLOSED FOR INCOMPLETENESS
0
$0
1
$168,520
8
$114,260
0
$0
1
$91,680
1
$161,780
Aggregated Statistics For Year 2005 (Based on 2 partial tracts)
A) FHA, FSA/RHS & VA Home Purchase Loans
B) Conventional Home Purchase Loans
C) Refinancings
D) Home Improvement Loans
F) Non-occupant Loans on < 5 Family Dwellings (A B C & D)
G) Loans On Manufactured Home Dwelling (A B C & D)
Number
Average Value
Number
Average Value
Number
Average Value
Number
Average Value
Number
Average Value
Number
Average Value
LOANS ORIGINATED
18
$111,601
50
$104,512
96
$73,463
40
$31,986
12
$87,633
36
$56,362
APPLICATIONS APPROVED, NOT ACCEPTED
5
$96,262
20
$56,288
35
$65,599
8
$19,044
1
$36,400
23
$56,624
APPLICATIONS DENIED
8
$62,522
42
$52,612
101
$71,668
43
$40,446
3
$48,087
46
$47,744
APPLICATIONS WITHDRAWN
0
$0
8
$79,375
42
$94,823
9
$46,438
1
$33,700
5
$68,488
FILES CLOSED FOR INCOMPLETENESS
1
$136,170
3
$90,780
7
$82,819
0
$0
0
$0
1
$107,860
Aggregated Statistics For Year 2004 (Based on 2 partial tracts)
A) FHA, FSA/RHS & VA Home Purchase Loans
B) Conventional Home Purchase Loans
C) Refinancings
D) Home Improvement Loans
F) Non-occupant Loans on < 5 Family Dwellings (A B C & D)
G) Loans On Manufactured Home Dwelling (A B C & D)
Number
Average Value
Number
Average Value
Number
Average Value
Number
Average Value
Number
Average Value
Number
Average Value
LOANS ORIGINATED
23
$90,974
57
$83,825
131
$85,441
38
$17,207
4
$87,970
38
$50,238
APPLICATIONS APPROVED, NOT ACCEPTED
4
$124,035
19
$68,545
30
$68,938
3
$11,233
3
$50,783
8
$48,535
APPLICATIONS DENIED
4
$64,713
35
$45,608
136
$76,342
38
$21,323
5
$22,380
54
$43,217
APPLICATIONS WITHDRAWN
3
$80,443
12
$87,521
67
$91,497
7
$54,506
0
$0
12
$63,815
FILES CLOSED FOR INCOMPLETENESS
0
$0
4
$39,098
5
$81,700
3
$53,927
0
$0
0
$0
Aggregated Statistics For Year 2003 (Based on 2 partial tracts)
A) FHA, FSA/RHS & VA Home Purchase Loans
B) Conventional Home Purchase Loans
C) Refinancings
D) Home Improvement Loans
F) Non-occupant Loans on < 5 Family Dwellings (A B C & D)
Number
Average Value
Number
Average Value
Number
Average Value
Number
Average Value
Number
Average Value
LOANS ORIGINATED
7
$130,197
69
$64,538
155
$86,459
38
$12,347
8
$42,300
APPLICATIONS APPROVED, NOT ACCEPTED
0
$0
20
$66,938
31
$73,760
9
$10,337
3
$22,470
APPLICATIONS DENIED
3
$88,083
38
$45,271
97
$64,005
23
$10,258
4
$32,020
APPLICATIONS WITHDRAWN
0
$0
9
$102,463
42
$71,744
3
$9,437
1
$17,530
FILES CLOSED FOR INCOMPLETENESS
0
$0
0
$0
3
$55,277
0
$0
0
$0
Aggregated Statistics For Year 2002 (Based on 2 partial tracts)
A) FHA, FSA/RHS & VA Home Purchase Loans
B) Conventional Home Purchase Loans
C) Refinancings
D) Home Improvement Loans
F) Non-occupant Loans on < 5 Family Dwellings (A B C & D)
Number
Average Value
Number
Average Value
Number
Average Value
Number
Average Value
Number
Average Value
LOANS ORIGINATED
7
$91,484
58
$54,486
120
$64,961
42
$15,761
11
$31,622
APPLICATIONS APPROVED, NOT ACCEPTED
1
$47,190
11
$85,672
23
$88,160
1
$20,220
0
$0
APPLICATIONS DENIED
0
$0
43
$48,316
116
$55,509
16
$18,959
5
$19,414
APPLICATIONS WITHDRAWN
1
$141,560
3
$26,963
24
$80,555
1
$53,930
1
$26,960
FILES CLOSED FOR INCOMPLETENESS
1
$47,190
0
$0
15
$64,354
1
$230,540
0
$0
Aggregated Statistics For Year 2001 (Based on 2 partial tracts)
A) FHA, FSA/RHS & VA Home Purchase Loans
B) Conventional Home Purchase Loans
C) Refinancings
D) Home Improvement Loans
F) Non-occupant Loans on < 5 Family Dwellings (A B C & D)
Number
Average Value
Number
Average Value
Number
Average Value
Number
Average Value
Number
Average Value
LOANS ORIGINATED
11
$64,101
61
$49,265
143
$63,469
39
$16,386
11
$28,190
APPLICATIONS APPROVED, NOT ACCEPTED
5
$63,096
15
$38,199
19
$83,731
4
$12,135
1
$6,740
APPLICATIONS DENIED
3
$55,727
70
$41,621
97
$57,986
46
$11,636
7
$27,157
APPLICATIONS WITHDRAWN
3
$22,470
15
$44,131
54
$56,699
4
$3,032
1
$25,620
FILES CLOSED FOR INCOMPLETENESS
0
$0
3
$139,313
5
$115,676
0
$0
0
$0
Aggregated Statistics For Year 2000 (Based on 2 partial tracts)
A) FHA, FSA/RHS & VA Home Purchase Loans
B) Conventional Home Purchase Loans
C) Refinancings
D) Home Improvement Loans
F) Non-occupant Loans on < 5 Family Dwellings (A B C & D)
Number
Average Value
Number
Average Value
Number
Average Value
Number
Average Value
Number
Average Value
LOANS ORIGINATED
7
$64,521
85
$45,791
100
$52,189
50
$15,450
11
$19,733
APPLICATIONS APPROVED, NOT ACCEPTED
5
$65,522
27
$42,643
23
$49,121
8
$9,438
1
$17,530
APPLICATIONS DENIED
7
$52,387
88
$33,169
84
$47,941
36
$8,614
9
$27,563
APPLICATIONS WITHDRAWN
0
$0
7
$57,394
47
$61,759
7
$21,571
0
$0
FILES CLOSED FOR INCOMPLETENESS
0
$0
0
$0
4
$56,625
1
$35,050
0
$0
Aggregated Statistics For Year 1999 (Based on 1 full and 1 partial tracts)
A) FHA, FSA/RHS & VA Home Purchase Loans
B) Conventional Home Purchase Loans
C) Refinancings
D) Home Improvement Loans
F) Non-occupant Loans on < 5 Family Dwellings (A B C & D)
Detailed PMIC statistics for the following Tracts:0112.00
2004 - 2018 National Fire Incident Reporting System (NFIRS) incidents
According to the data from the years 2004 - 2018 the average number of fires per year is 57. The highest number of reported fire incidents - 127 took place in 2010, and the least - 0 in 2006. The data has a growing trend.
When looking into fire subcategories, the most reports belonged to: Outside Fires (62.7%), and Structure Fires (28.5%).
Fire incident types reported to NFIRS in Zip Code 71064


 Nearest zip codes: 71029, 71826, 71075, 71006, 71044, 71043.


 According to the data from the years 2004 - 2018 the average number of fires per year is 57. The highest number of reported fire incidents - 127 took place in 2010, and the least - 0 in 2006. The data has a growing trend.
 When looking into fire subcategories, the most reports belonged to: Outside Fires (62.7%), and Structure Fires (28.5%).