Estimated zip code population in 2022: 4,709 Zip code population in 2010: 4,717 Zip code population in 2000: 4,180
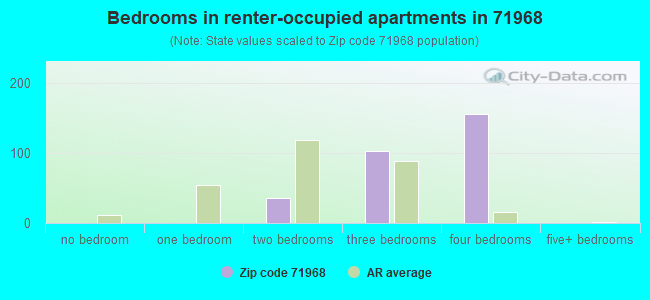
Houses and condos: 2,289 Renter-occupied apartments: 299
% of renters here:
17%
State:
34%
March 2022 cost of living index in zip code 71968: 80.3 (low, U.S. average is 100)
Land area: 98.3 sq. mi. Water area: 14.3 sq. mi.
Population density: 48 people per square mile
(very low).
OSM Map
General Map
Google Map
MSN Map
OSM Map
General Map
Google Map
MSN Map
OSM Map
General Map
Google Map
MSN Map
OSM Map
General Map
Google Map
MSN Map
Please wait while loading the map...
Real estate property taxes paid for housing units in 2022:
This zip code:
0.5% ($988)
Arkansas:
0.5% ($977)
Median real estate property taxes paid for housing units with mortgages in 2022: $1,000 (0.4%) Median real estate property taxes paid for housing units with no mortgage in 2022: $997 (0.4%)
Business Search- 14 Million verified businesses
Males: 2,469
(52.4%)
Females: 2,240
(47.6%)
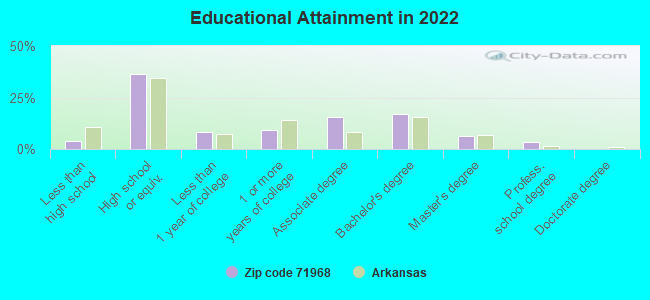
For population 25 years and over in 71968:
High school or higher: 96.8%
Bachelor's degree or higher: 26.9%
Graduate or professional degree: 9.9%
Unemployed: 15.7%
Mean travel time to work (commute): 29.4 minutes
For population 15 years and over in 71968:
Never married: 21.4%
Now married: 59.8%
Separated: 0.2%
Widowed: 3.1%
Divorced: 15.5%
Zip code 71968 compared to state average:
Unemployed percentage significantly above state average.
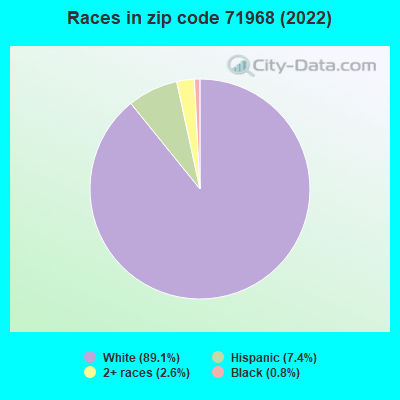
Black race population percentage significantly below state average.
Median age significantly above state average.
Foreign-born population percentage significantly below state average.
Renting percentage below state average.
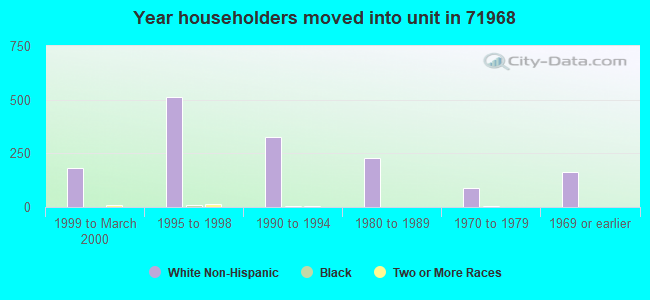
Length of stay since moving in significantly above state average.
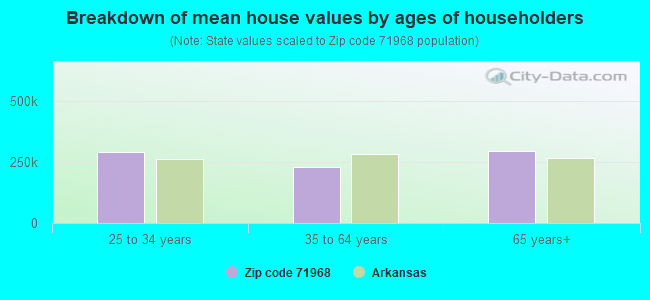
Estimated median house/condo value in 2022: $218,218
71968:
$218,218
Arkansas:
$179,800
According to our research of Arkansas and other state lists, there were 8 registered sex offenders living in 71968 zip code as of May 02, 2024. The ratio of all residents to sex offenders in zip code 71968 is 466 to 1. The ratio of registered sex offenders to all residents in this zip code is near the state average.
Median resident age:
This zip code:
48.9 years
Arkansas median age:
38.9 years
Average household size:
This zip code:
2.6 people
Arkansas:
2.4 people
Averages for the 2020 tax year for zip code 71968, filed in 2021:
Average Adjusted Gross Income (AGI) in 2020: $57,075 (Individual Income Tax Returns)
Here:
$57,075
State:
$64,872
Salary/wage: $47,838 (reported on 77.9% of returns)
Here:
$47,838
State:
$50,644
(% of AGI for various income ranges: 1124.2% for AGIs below $25k, 3209.3% for AGIs $25k-50k, 5685.0% for AGIs $50k-75k, 9153.6% for AGIs $75k-100k, 14975.0% for AGIs $100k-200k)
Taxable interest for individuals: $1,215 (reported on 24.6% of returns)
This zip code:
$1,215
Arkansas:
$1,857
(% of AGI for various income ranges: 13.3% for AGIs below $25k, 13.9% for AGIs $25k-50k, 49.5% for AGIs $50k-75k, 68.2% for AGIs $75k-100k, 75.7% for AGIs $100k-200k)
Ordinary dividends: $3,467 (reported on 12.3% of returns)
Here:
$3,467
State:
$21,681
(% of AGI for various income ranges: 8.8% for AGIs below $25k, 19.5% for AGIs $25k-50k, 67.7% for AGIs $50k-75k, 141.8% for AGIs $75k-100k, 156.4% for AGIs $100k-200k)
Net capital gain/loss in AGI: +$13,091 (reported on 11.8% of returns)
Here:
+$13,091
State:
+$22,815
(% of AGI for various income ranges: 18.5% for AGIs $25k-50k, 104.1% for AGIs $50k-75k, 150.0% for AGIs $75k-100k, 667.1% for AGIs $100k-200k)
Profit/loss from business: +$11,094 (reported on 18.5% of returns)
Here:
+$11,094
State:
+$9,743
(% of AGI for various income ranges: 148.3% for AGIs below $25k, 235.9% for AGIs $25k-50k, 269.5% for AGIs $50k-75k, 303.6% for AGIs $75k-100k, 949.3% for AGIs $100k-200k)
Taxable individual retirement arrangement distribution: $24,869 (reported on 8.2% of returns)
71968:
$24,869
Arkansas:
$18,502
(% of AGI for various income ranges: 37.1% for AGIs below $25k, 101.5% for AGIs $25k-50k, 217.3% for AGIs $50k-75k, 360.0% for AGIs $75k-100k, 1782.9% for AGIs $100k-200k)
Total itemized deductions: $34,940 (reported on 5.1% of returns)
Here:
$34,940
State:
$52,840
(% of AGI for various income ranges: 429.1% for AGIs $50k-75k, 1039.3% for AGIs $100k-200k)
Charity contributions: $14,111 (reported on 4.6% of returns)
Here:
$14,111
State:
$35,735
(% of AGI for various income ranges: 34.6% for AGIs $25k-50k, 457.1% for AGIs $100k-200k)
Taxes paid: $6,164 (reported on 5.6% of returns)
71968:
$6,164
State:
$7,196
(% of AGI for various income ranges: 58.2% for AGIs $50k-75k, 218.6% for AGIs $100k-200k)
Earned income credit: $2,178 (reported on 21.0% of returns)
Here:
$2,178
State:
$2,546
(% of AGI for various income ranges: 105.8% for AGIs below $25k, 83.7% for AGIs $25k-50k)
Percentage of individuals using paid preparers for their 2020 taxes: 93.8%
Here:
94%
State:
94%
(% for various income ranges: 92.8% for AGIs below $25k, 94.0% for AGIs $25k-50k, 93.3% for AGIs $50k-75k, 94.1% for AGIs $75k-100k, 95.7% for AGIs $100k-200k, 100.0% for AGIs over 200k)
Averages for the 2012 tax year for zip code 71968, filed in 2013:
Average Adjusted Gross Income (AGI) in 2012: $52,898 (Individual Income Tax Returns)
Here:
$52,898
State:
$52,148
Salary/wage: $39,489 (reported on 82.7% of returns)
Here:
$39,489
State:
$41,669
(% of AGI for various income ranges: 71.8% for AGIs below $25k, 79.2% for AGIs $25k-50k, 74.9% for AGIs $50k-75k, 74.7% for AGIs $75k-100k, 72.3% for AGIs $100k-200k, 20.4% for AGIs over 200k)
Taxable interest for individuals: $1,525 (reported on 27.6% of returns)
This zip code:
$1,525
Arkansas:
$1,648
(% of AGI for various income ranges: 1.2% for AGIs below $25k, 0.9% for AGIs $25k-50k, 0.4% for AGIs $50k-75k, 0.1% for AGIs $75k-100k, 0.4% for AGIs $100k-200k, 1.5% for AGIs over 200k)
Ordinary dividends: $2,835 (reported on 12.4% of returns)
Here:
$2,835
State:
$20,675
(% of AGI for various income ranges: 0.5% for AGIs below $25k, 0.8% for AGIs $25k-50k, 0.6% for AGIs $50k-75k, 0.4% for AGIs $75k-100k, 1.7% for AGIs $100k-200k)
Net capital gain/loss in AGI: +$9,274 (reported on 10.3% of returns)
Here:
+$9,274
State:
+$15,222
(% of AGI for various income ranges: 0.5% for AGIs $50k-75k, 1.1% for AGIs $75k-100k, 8.6% for AGIs $100k-200k)
Profit/loss from business: +$8,292 (reported on 19.5% of returns)
Here:
+$8,292
State:
+$9,665
(% of AGI for various income ranges: 9.6% for AGIs below $25k, 5.0% for AGIs $25k-50k, 1.5% for AGIs $50k-75k, 3.7% for AGIs $75k-100k, 2.5% for AGIs $100k-200k)
Taxable individual retirement arrangement distribution: $13,969 (reported on 8.6% of returns)
71968:
$13,969
Arkansas:
$13,644
(% of AGI for various income ranges: 2.3% for AGIs below $25k, 1.9% for AGIs $25k-50k, 3.1% for AGIs $50k-75k, 2.4% for AGIs $75k-100k, 4.7% for AGIs $100k-200k)
Total itemized deductions: $24,609 (20% of AGI, reported on 23.8% of returns)
Here:
$24,609
State:
$23,276
Here:
20.4% of AGI
State:
19.1% of AGI
(% of AGI for various income ranges: 8.2% for AGIs below $25k, 7.8% for AGIs $25k-50k, 8.7% for AGIs $50k-75k, 13.1% for AGIs $75k-100k, 15.4% for AGIs $100k-200k, 11.7% for AGIs over 200k)
Charity contributions: $5,057 (reported on 18.9% of returns)
Here:
$5,057
State:
$5,996
(% of AGI for various income ranges: 0.8% for AGIs below $25k, 1.0% for AGIs $25k-50k, 1.1% for AGIs $50k-75k, 2.8% for AGIs $75k-100k, 3.0% for AGIs $100k-200k, 1.8% for AGIs over 200k)
Taxes paid: $9,170 (reported on 23.8% of returns)
71968:
$9,170
State:
$7,941
(% of AGI for various income ranges: 0.9% for AGIs below $25k, 1.2% for AGIs $25k-50k, 2.0% for AGIs $50k-75k, 4.0% for AGIs $75k-100k, 5.0% for AGIs $100k-200k, 8.4% for AGIs over 200k)
Earned income credit: $2,276 (reported on 22.7% of returns)
Here:
$2,276
State:
$2,455
(% of AGI for various income ranges: 6.7% for AGIs below $25k, 1.6% for AGIs $25k-50k)
Percentage of individuals using paid preparers for their 2012 taxes: 60.0%
Here:
60%
State:
61%
(% for various income ranges: 55.6% for AGIs below $25k, 60.0% for AGIs $25k-50k, 59.3% for AGIs $50k-75k, 66.7% for AGIs $75k-100k, 71.4% for AGIs $100k-200k, 100.0% for AGIs over 200k)
Averages for the 2004 tax year for zip code 71968, filed in 2005:
Average Adjusted Gross Income (AGI) in 2004: $36,009 (Individual Income Tax Returns)
Here:
$36,009
State:
$39,270
Salary/wage: $32,240 (reported on 81.9% of returns)
Here:
$32,240
State:
$34,079
(% of AGI for various income ranges: 81.2% for AGIs below $10k, 70.8% for AGIs $10k-25k, 80.4% for AGIs $25k-50k, 81.6% for AGIs $50k-75k, 74.1% for AGIs $75k-100k, 56.8% for AGIs over 100k)
Taxable interest for individuals: $1,806 (reported on 35.0% of returns)
This zip code:
$1,806
Arkansas:
$1,904
(% of AGI for various income ranges: 6.1% for AGIs below $10k, 2.4% for AGIs $10k-25k, 0.9% for AGIs $25k-50k, 0.4% for AGIs $50k-75k, 1.3% for AGIs $75k-100k, 3.4% for AGIs over 100k)
Taxable dividends: $1,209 (reported on 15.8% of returns)
Here:
$1,209
State:
$5,995
(% of AGI for various income ranges: 1.1% for AGIs below $10k, 1.2% for AGIs $10k-25k, 0.6% for AGIs $25k-50k, 0.1% for AGIs $50k-75k, 0.3% for AGIs $75k-100k, 0.6% for AGIs over 100k)
Net capital gain/loss: +$6,294 (reported on 13.7% of returns)
Here:
+$6,294
State:
+$10,430
(% of AGI for various income ranges: 3.5% for AGIs below $10k, 0.1% for AGIs $10k-25k, 0.5% for AGIs $25k-50k, 0.9% for AGIs $50k-75k, 3.4% for AGIs $75k-100k, 6.8% for AGIs over 100k)
Profit/loss from business: +$8,086 (reported on 22.0% of returns)
Here:
+$8,086
State:
+$7,823
(% of AGI for various income ranges: 12.5% for AGIs below $10k, 11.3% for AGIs $10k-25k, 4.2% for AGIs $25k-50k, 3.2% for AGIs $50k-75k, 2.4% for AGIs $75k-100k, 4.3% for AGIs over 100k)
IRA payment deduction: $3,800 (reported on 2.7% of returns)
71968:
$3,800
Arkansas:
$3,204
Total itemized deductions: $16,388 (23% of AGI, reported on 22.9% of returns)
Here:
$16,388
State:
$18,389
Here:
22.9% of AGI
State:
21.0% of AGI
(% of AGI for various income ranges: 9.8% for AGIs below $10k, 7.8% for AGIs $10k-25k, 9.3% for AGIs $25k-50k, 9.6% for AGIs $50k-75k, 13.3% for AGIs $75k-100k, 12.5% for AGIs over 100k)
Charity contributions deductions: $3,656 (5% of AGI, reported on 18.9% of returns)
Here:
$3,656
State:
$4,725
Here:
4.9% of AGI
State:
5.1% of AGI
(% of AGI for various income ranges: 0.7% for AGIs below $10k, 1.2% for AGIs $10k-25k, 1.5% for AGIs $25k-50k, 1.5% for AGIs $50k-75k, 3.3% for AGIs $75k-100k, 2.6% for AGIs over 100k)
Total tax: $4,913 (reported on 72.1% of returns)
71968:
$4,913
State:
$6,047
(% of AGI for various income ranges: 4.0% for AGIs below $10k, 4.3% for AGIs $10k-25k, 6.2% for AGIs $25k-50k, 8.5% for AGIs $50k-75k, 10.8% for AGIs $75k-100k, 19.1% for AGIs over 100k)
Earned income credit: $1,735 (reported on 22.3% of returns)
Here:
$1,735
State:
$1,909
Percentage of individuals using paid preparers for their 2004 taxes: 66.7%
Here:
67%
State:
67%
(% for various income ranges: 60.8% for AGIs below $10k, 66.2% for AGIs $10k-25k, 67.2% for AGIs $25k-50k, 69.2% for AGIs $50k-75k, 73.4% for AGIs $75k-100k, 81.1% for AGIs over 100k)
Household received Food Stamps/SNAP in the past 12 months: 64 Household did not receive Food Stamps/SNAP in the past 12 months: 1,720
Women who had a birth in the past 12 months: 22 (0 now married, 21 unmarried) Women who did not have a birth in the past 12 months: 780 (290 now married, 489 unmarried)
Housing units in zip code 71968 with a mortgage: 738 (123 second mortgage, 114 both second mortgage and home equity loan) Houses without a mortgage: 12
Median monthly owner costs for units with a mortgage: $1,294 Median monthly owner costs for units without a mortgage: $412
Residents with income below the poverty level in 2022:
This zip code:
6.0%
Whole state:
16.8%
Residents with income below 50% of the poverty level in 2022:
This zip code:
3.5%
Whole state:
8.5%
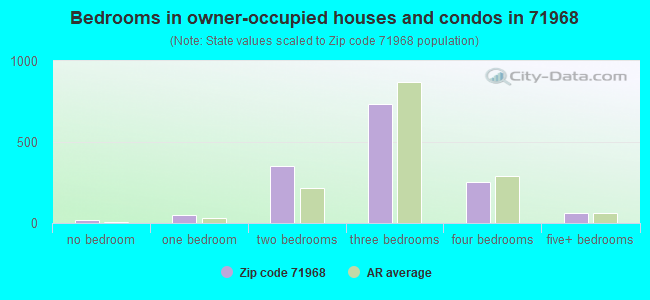
Median number of rooms in houses and condos:
Here:
5.9
State:
6.1
Median number of rooms in apartments:
Here:
5.5
State:
4.3
Notable locations in this zip code not listed on our city pages
Notable locations in zip code 71968: Camp Clearfork (A), Crystal Springs Recreation Site (B), Spillway Recreation Site (C), Ouachita Job Corps Conservation Center (D), Spillway Landing (E), Seventy West Fire Department Station 3 (F), Piney Fire Department Station 2 (G), Piney Fire Department Station 3 (H). Display/hide their locations on the map
Churches in zip code 71968 include: New Home Church (A), Meyers Creek Church (B), Church of God (C), Peak Church (D), Antioch Baptist Church (E), Social Hill Church (F), Royal Church (G). Display/hide their locations on the map
Streams, rivers, and creeks: Crudington Creek (A), Cearley Creek (B), Caney Creek (C), Bear Creek (D), Steep Shoals Creek (E), Rouse Creek (F), Rocky Branch (G), Red Branch (H), Pollard Creek (I). Display/hide their locations on the map
Parks in zip code 71968 include: Brady Mountain Public Use Area (1), Spillway Public Use Area (2), Charlton Public Use Area (3), Crystal Springs Public Use Area (4). Display/hide their locations on the map
In group quarters: 18 (-1 institutionalized population)
Size of family households: 674 2-persons, 211 3-persons, 172 4-persons, 116 5-persons, 38 6-persons, 40 7-or-more-persons
Size of nonfamily households: 269 1-person, 85 2-persons, 136 4-persons
464 married couples with children.
124 single-parent households (32 men, 92 women).
96.7% of residents of 71968 zip code speak English at home.
1.8% of residents speak Spanish at home (68% very well, 25% well, 7% not well).
1.7% of residents speak other Indo-European language at home (100% very well).
Foreign born population: 10 (0.2%) (30.7% of them are naturalized citizens)
This zip code:
0.2%
Whole state:
5.1%
60%Honduras
30%Bhutan
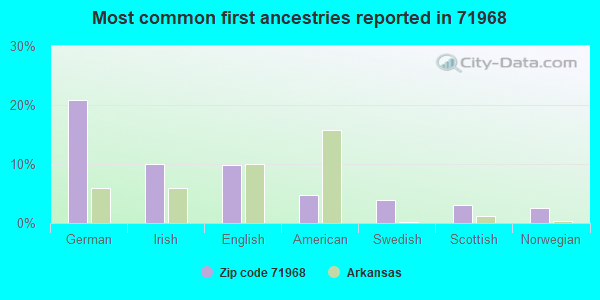
21%German
10%Irish
10%English
5%American
4%Swedish
3%Scottish
3%Norwegian
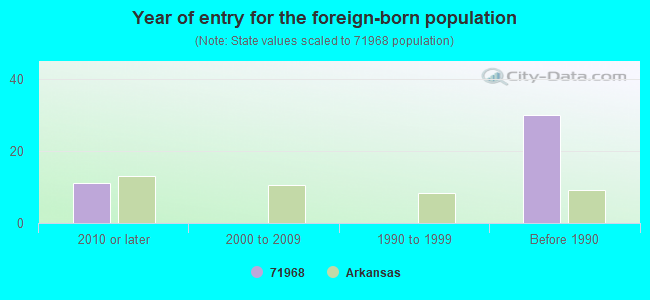
Year of entry for the foreign-born population
112010 or later
02000 to 2009
01990 to 1999
30Before 1990
Facilities with environmental interests located in this zip code:
AHTD JOB# 060984 (MAZARN CREEK ST./HWY. 227 in SUNSHINE, AR)
National Pollutant Discharge Elimination System NON-MAJOR (Tracking pollutant discharge elimination systems) - permit Business SIC classification: MANAGEMENT SERVICES
IDEAL SELF STORAGE (6061 ALBERT PIKE RD. in ROYAL, AR)
National Pollutant Discharge Elimination System NON-MAJOR (Tracking pollutant discharge elimination systems) - permit Business SIC classification: MANAGEMENT SERVICES
Housing units lacking complete plumbing facilities: 0.7% Housing units lacking complete kitchen facilities: 0.7%
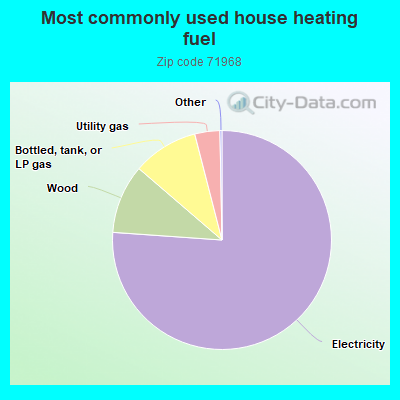
76.2%Electricity
10.2%Wood
9.7%Bottled, tank, or LP gas
3.7%Utility gas
Population in 1990: 1,099. Population change in the 1990s: +3,081 (+280.3%).
Place of birth for U.S.-born residents:
This state: 2,886
Northeast: 137
Midwest: 438
South: 707
West: 502
59% of the 71968 zip code residents lived in the same house 5 years ago. Out of people who lived in different houses, 54% lived in this county. Out of people who lived in different counties, 50% lived in Arkansas.
92% of the 71968 zip code residents lived in the same house 1 year ago. Out of people who lived in different houses, 43% moved from this county. Out of people who lived in different houses, 10% moved from different county within same state. Out of people who lived in different houses, 53% moved from different state.
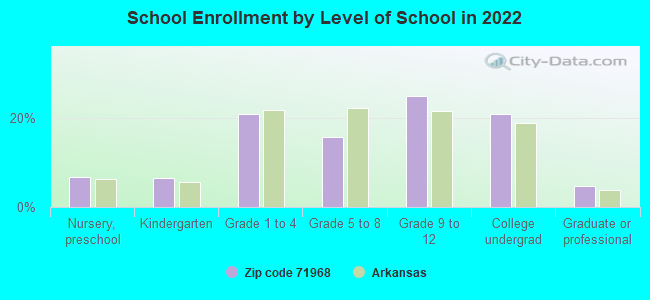
Private vs. public school enrollment:
Students in private schools in grades 1 to 8 (elementary and middle school):
Here:
0.0%
Arkansas:
10.5%
Students in private schools in grades 9 to 12 (high school):
Here:
0.0%
Arkansas:
8.7%
Students in private undergraduate colleges: 92
Here:
48.4%
Arkansas:
19.4%
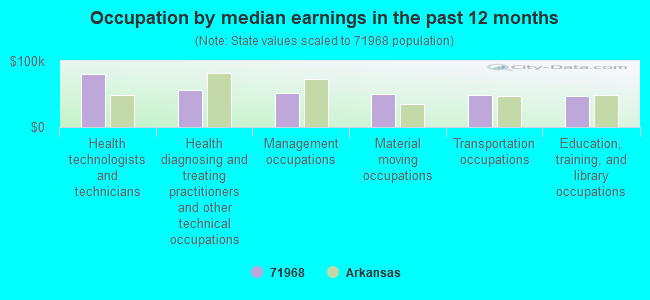
Occupation by median earnings in the past 12 months ($)
79,809Health technologists and technicians
56,337Health diagnosing and treating practitioners and other technical occupations
51,698Management occupations
50,729Material moving occupations
48,455Transportation occupations
46,775Education, training, and library occupations
Companies with federal contracts located in this zip code:
J A JACKSON CONSTRUCTION INC (6435 ALBERT PIKE ROAD in ROYAL, AR; small business) : $1,659,099 in 14 contractsfrom 2000 to 2005
Contracts for Maintenance, Repair or Alteration of Real Property -- Water Supply Facilities, Construction of Structures and Facilities -- Office Buildings, Construction of Structures and Facilities -- Sewage and Waste Facilities, Construction of Structures and Facilities -- Water Supply Facilities, and moreby National Park Service, U.S. Army Corps of Engineers - civil program financing only, Army, Public Buildings Service, and others Signed by year:2000: $755,754; 2001: $905,347; 2002: $4,000; 2003: $0; 2004: $0; 2005: -$6,002; 2006: $0.
Biggest contracts:
$477,000 with National Park Service for Maintenance, Repair or Alteration of Real Property -- Water Supply Facilities. Signed on 2000-08-15. Completion date: 2000-12-15.
$383,347 with U.S. Army Corps of Engineers - civil program financing only for Construction of Structures and Facilities -- Office Buildings. Signed on 2001-09-27. Completion date: 2001-12-27.
$350,000, same as above.Signed on 2001-05-07. Completion date: 2002-05-07.
$131,377 with U.S. Army Corps of Engineers - civil program financing only for Construction of Structures and Facilities -- Sewage and Waste Facilities. Signed on 2000-11-01. Completion date: 2001-02-03.
FRYARS, JIM REFRIGERATION INC (1207 S CRYSTAL SPRINGS RD in ROYAL, AR; small business) : $16,819 in 3 contractsin 2004
$8,694 with Army for Air Conditioning Equipment. Signed on 2004-09-10. Completion date: 2004-11-10.
$8,694 with U.S. Army Corps of Engineers - civil program financing only for Air Conditioning Equipment. Signed on 2004-09-10. Completion date: 2004-11-10.
-$569 with Army for Air Conditioning Equipment. Signed on 2004-09-20. Completion date: 2004-11-10.
Top industries in this zip code by the number of employees in 2005:
Administrative and Support and Waste Management and Remediation Services: Professional Employer Organizations (250-499 employees: 1 establishment)
Administrative and Support and Waste Management and Remediation Services: Facilities Support Services (20-49: 2)
Construction: Site Preparation Contractors (20-49: 1, 1-4: 1)
Construction: Plumbing, Heating, and Air-Conditioning Contractors (5-9: 2, 1-4: 8)
Accommodation and Food Services: Recreational and Vacation Camps (except Campgrounds) (10-19: 1)
Construction: Siding Contractors (10-19: 1)
Real Estate and Rental and Leasing: Recreational Goods Rental (10-19: 1)
Construction: Water and Sewer Line and Related Structures Construction (10-19: 1)
Other Services (except Public Administration): Religious Organizations (5-9: 2)
People in group quarters in 2010:
175 people in workers' group living quarters and job corps centers
People in group quarters in 2000:
205 people in unknown juvenile institutions
Fatal accident statistics in 2014:
Fatal accident count: 2
Vehicles involved in fatal accidents: 2
Fatal accidents caused by drunken drivers: 1
Fatalities: 2
Persons involved in fatal accidents: 2
Pedestrians involved in fatal accidents: 0
Fatal accident statistics in 2012:
Fatal accident count: 1
Vehicles involved in fatal accidents: 1
Fatal accidents caused by drunken drivers: 0
Fatalities: 1
Persons involved in fatal accidents: 1
Pedestrians involved in fatal accidents: 1
Home Mortgage Disclosure Act Aggregated Statistics For Year 2009 (Based on 4 partial tracts)
A) FHA, FSA/RHS & VA Home Purchase Loans
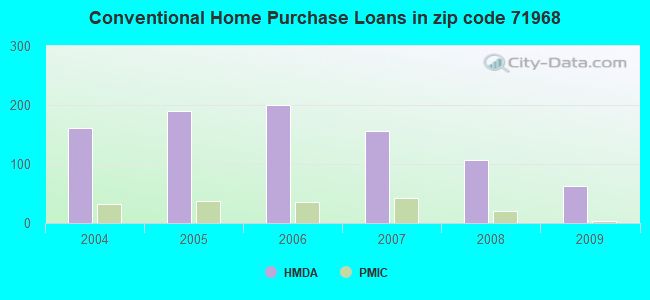
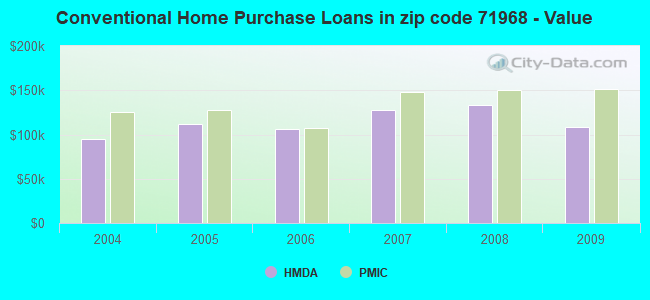
B) Conventional Home Purchase Loans
C) Refinancings
D) Home Improvement Loans
F) Non-occupant Loans on < 5 Family Dwellings (A B C & D)
G) Loans On Manufactured Home Dwelling (A B C & D)
Number
Average Value
Number
Average Value
Number
Average Value
Number
Average Value
Number
Average Value
Number
Average Value
LOANS ORIGINATED
37
$127,006
63
$108,282
220
$148,228
18
$51,403
53
$119,270
42
$49,538
APPLICATIONS APPROVED, NOT ACCEPTED
3
$41,153
5
$79,266
12
$158,690
3
$100,950
1
$164,740
6
$42,392
APPLICATIONS DENIED
14
$109,405
29
$85,768
110
$131,627
15
$57,019
22
$84,070
19
$55,932
APPLICATIONS WITHDRAWN
8
$127,489
8
$58,271
58
$140,506
1
$1,660
9
$150,469
4
$64,550
FILES CLOSED FOR INCOMPLETENESS
3
$62,050
3
$143,037
9
$129,642
0
$0
1
$139,780
2
$98,075
Aggregated Statistics For Year 2008 (Based on 4 partial tracts)
A) FHA, FSA/RHS & VA Home Purchase Loans
B) Conventional Home Purchase Loans
C) Refinancings
D) Home Improvement Loans
F) Non-occupant Loans on < 5 Family Dwellings (A B C & D)
G) Loans On Manufactured Home Dwelling (A B C & D)
Number
Average Value
Number
Average Value
Number
Average Value
Number
Average Value
Number
Average Value
Number
Average Value
LOANS ORIGINATED
35
$121,829
107
$132,818
172
$145,777
38
$49,769
46
$120,153
47
$56,870
APPLICATIONS APPROVED, NOT ACCEPTED
6
$82,472
12
$76,362
10
$120,300
4
$31,802
6
$94,750
11
$47,479
APPLICATIONS DENIED
10
$102,954
30
$101,936
97
$131,724
22
$40,892
16
$96,544
32
$84,960
APPLICATIONS WITHDRAWN
8
$116,815
15
$111,982
46
$151,259
0
$0
11
$135,751
6
$41,352
FILES CLOSED FOR INCOMPLETENESS
2
$91,455
3
$101,227
13
$100,821
2
$169,310
2
$125,145
2
$43,680
Aggregated Statistics For Year 2007 (Based on 4 partial tracts)
A) FHA, FSA/RHS & VA Home Purchase Loans
B) Conventional Home Purchase Loans
C) Refinancings
D) Home Improvement Loans
F) Non-occupant Loans on < 5 Family Dwellings (A B C & D)
G) Loans On Manufactured Home Dwelling (A B C & D)
Number
Average Value
Number
Average Value
Number
Average Value
Number
Average Value
Number
Average Value
Number
Average Value
LOANS ORIGINATED
17
$120,116
156
$127,399
167
$140,496
42
$61,247
51
$151,514
65
$59,478
APPLICATIONS APPROVED, NOT ACCEPTED
3
$94,090
27
$86,962
30
$135,605
9
$47,204
7
$111,534
19
$50,776
APPLICATIONS DENIED
5
$81,960
65
$110,814
109
$128,574
26
$46,078
13
$120,517
50
$56,611
APPLICATIONS WITHDRAWN
1
$151,420
21
$154,653
45
$147,550
2
$139,775
6
$152,363
6
$64,287
FILES CLOSED FOR INCOMPLETENESS
0
$0
6
$161,170
16
$166,158
2
$61,460
2
$179,415
2
$67,570
Aggregated Statistics For Year 2006 (Based on 4 partial tracts)
A) FHA, FSA/RHS & VA Home Purchase Loans
B) Conventional Home Purchase Loans
C) Refinancings
D) Home Improvement Loans
F) Non-occupant Loans on < 5 Family Dwellings (A B C & D)
G) Loans On Manufactured Home Dwelling (A B C & D)
Number
Average Value
Number
Average Value
Number
Average Value
Number
Average Value
Number
Average Value
Number
Average Value
LOANS ORIGINATED
20
$108,738
200
$106,643
179
$122,338
35
$44,328
60
$96,573
70
$56,135
APPLICATIONS APPROVED, NOT ACCEPTED
1
$74,050
50
$80,257
26
$90,975
5
$31,634
2
$94,160
35
$50,352
APPLICATIONS DENIED
0
$0
98
$67,137
77
$103,763
26
$34,793
14
$92,905
78
$48,379
APPLICATIONS WITHDRAWN
1
$74,050
19
$113,479
43
$132,831
2
$51,920
4
$109,140
5
$70,722
FILES CLOSED FOR INCOMPLETENESS
0
$0
4
$135,570
9
$104,049
0
$0
1
$49,610
1
$74,880
Aggregated Statistics For Year 2005 (Based on 4 partial tracts)
A) FHA, FSA/RHS & VA Home Purchase Loans
B) Conventional Home Purchase Loans
C) Refinancings
D) Home Improvement Loans
F) Non-occupant Loans on < 5 Family Dwellings (A B C & D)
G) Loans On Manufactured Home Dwelling (A B C & D)
Number
Average Value
Number
Average Value
Number
Average Value
Number
Average Value
Number
Average Value
Number
Average Value
LOANS ORIGINATED
24
$101,683
190
$111,431
214
$89,350
29
$38,478
56
$97,221
85
$54,513
APPLICATIONS APPROVED, NOT ACCEPTED
1
$72,380
42
$101,827
31
$123,842
2
$88,190
5
$93,570
26
$62,912
APPLICATIONS DENIED
4
$91,910
107
$70,216
125
$106,126
32
$35,654
14
$120,514
83
$49,104
APPLICATIONS WITHDRAWN
1
$74,050
21
$80,639
59
$132,626
6
$87,630
6
$112,103
10
$61,585
FILES CLOSED FOR INCOMPLETENESS
0
$0
5
$62,272
8
$127,442
0
$0
2
$87,270
2
$99,840
Aggregated Statistics For Year 2004 (Based on 4 partial tracts)
A) FHA, FSA/RHS & VA Home Purchase Loans
B) Conventional Home Purchase Loans
C) Refinancings
D) Home Improvement Loans
F) Non-occupant Loans on < 5 Family Dwellings (A B C & D)
G) Loans On Manufactured Home Dwelling (A B C & D)
Detailed PMIC statistics for the following Tracts:0103.00
, 0111.00
2002 - 2018 National Fire Incident Reporting System (NFIRS) incidents
According to the data from the years 2002 - 2018 the average number of fire incidents per year is 22. The highest number of fires - 39 took place in 2015, and the least - 5 in 2006. The data has a dropping trend.
When looking into fire subcategories, the most reports belonged to: Structure Fires (43.5%), and Outside Fires (41.3%).
Fire incident types reported to NFIRS in Zip Code 71968

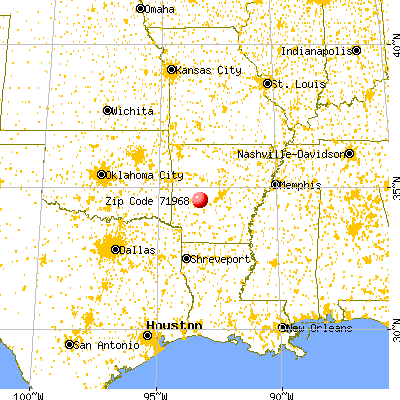


 Nearest zip codes: 71933, 71964, 71956, 71949, 71913, 71970.


 According to the data from the years 2002 - 2018 the average number of fire incidents per year is 22. The highest number of fires - 39 took place in 2015, and the least - 5 in 2006. The data has a dropping trend.
 When looking into fire subcategories, the most reports belonged to: Structure Fires (43.5%), and Outside Fires (41.3%).