Estimated zip code population in 2022: 314 Zip code population in 2010: 443 Zip code population in 2000: 383
Houses and condos: 154 Renter-occupied apartments: 47
% of renters here:
34%
State:
34%
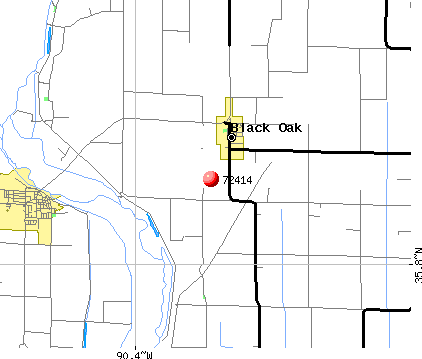
March 2022 cost of living index in zip code 72414: 76.4 (low, U.S. average is 100)
Land area: 17.3 sq. mi. Water area: 0.4 sq. mi.
Population density: 18 people per square mile
(very low).
OSM Map
General Map
Google Map
MSN Map
OSM Map
General Map
Google Map
MSN Map
OSM Map
General Map
Google Map
MSN Map
OSM Map
General Map
Google Map
MSN Map
Please wait while loading the map...
Real estate property taxes paid for housing units in 2022:
This zip code:
0.6% ($455)
Arkansas:
0.5% ($977)
Median real estate property taxes paid for housing units with mortgages in 2022: $886 (0.6%) Median real estate property taxes paid for housing units with no mortgage in 2022: $391 (0.5%)
Business Search- 14 Million verified businesses
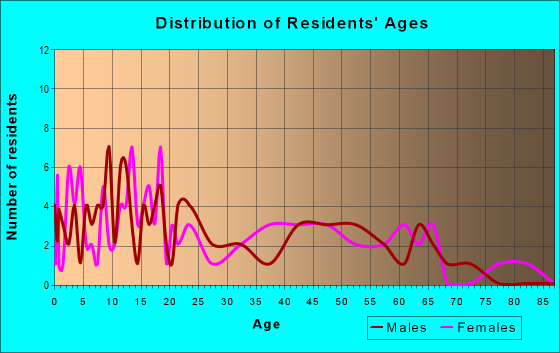
Males: 157
(50.0%)
Females: 157
(50.0%)
For population 25 years and over in 72414:
High school or higher: 71.2%
Bachelor's degree or higher: 21.0%
Graduate or professional degree: 13.9%
Mean travel time to work (commute): 20.9 minutes
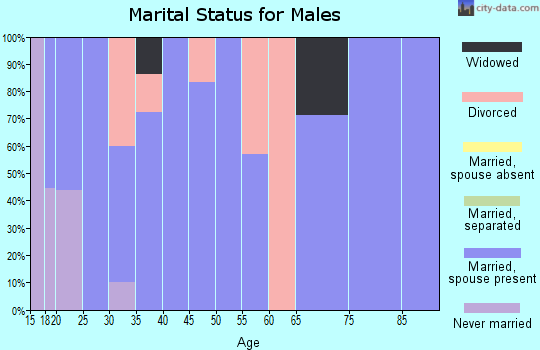
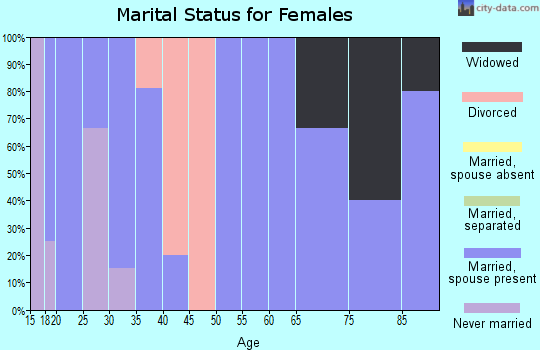
For population 15 years and over in 72414:
Never married: 20.2%
Now married: 42.6%
Separated: 1.7%
Widowed: 6.9%
Divorced: 28.6%
Zip code 72414 compared to state average:
Median house value significantly below state average.
Unemployed percentage significantly below state average.
Black race population percentage significantly below state average.
Hispanic race population percentage above state average.
Median age above state average.
Length of stay since moving in above state average.
Estimated median house/condo value in 2022: $74,400
72414:
$74,400
Arkansas:
$179,800
According to our research of Arkansas and other state lists, there was 1 registered sex offender living in 72414 zip code as of May 05, 2024. The ratio of all residents to sex offenders in zip code 72414 is 459 to 1. The ratio of registered sex offenders to all residents in this zip code is near the state average.
Median resident age:
This zip code:
44.0 years
Arkansas median age:
38.9 years
Average household size:
This zip code:
2.2 people
Arkansas:
2.4 people
Averages for the 2020 tax year for zip code 72414, filed in 2021:
Average Adjusted Gross Income (AGI) in 2020: $55,453 (Individual Income Tax Returns)
Here:
$55,453
State:
$64,872
Salary/wage: $43,762 (reported on 86.7% of returns)
Here:
$43,762
State:
$50,644
(% of AGI for various income ranges: 1287.5% for AGIs below $25k, 4576.7% for AGIs $25k-50k, 12670.0% for AGIs $50k-75k)
Taxable interest for individuals: $433 (reported on 20.0% of returns)
This zip code:
$433
Arkansas:
$1,857
(% of AGI for various income ranges: 43.3% for AGIs $25k-50k)
Earned income credit: $2,200 (reported on 20.0% of returns)
Here:
$2,200
State:
$2,546
(% of AGI for various income ranges: 165.0% for AGIs below $25k)
Percentage of individuals using paid preparers for their 2020 taxes: 100.0%
Here:
100%
State:
94%
(% for various income ranges: 100.0% for AGIs below $25k, 100.0% for AGIs $25k-50k, 100.0% for AGIs $50k-75k, 100.0% for AGIs $100k-200k)
Averages for the 2012 tax year for zip code 72414, filed in 2013:
Average Adjusted Gross Income (AGI) in 2012: $43,807 (Individual Income Tax Returns)
Here:
$43,807
State:
$52,148
Salary/wage: $39,433 (reported on 80.0% of returns)
Here:
$39,433
State:
$41,669
(% of AGI for various income ranges: 75.0% for AGIs below $25k, 77.8% for AGIs $25k-50k, 84.3% for AGIs $50k-75k, 60.5% for AGIs $75k-100k)
Taxable interest for individuals: $475 (reported on 26.7% of returns)
This zip code:
$475
Arkansas:
$1,648
Total itemized deductions: $15,850 (19% of AGI, reported on 13.3% of returns)
Here:
$15,850
State:
$23,276
Here:
18.9% of AGI
State:
19.1% of AGI
Taxes paid: $3,600 (reported on 13.3% of returns)
72414:
$3,600
State:
$7,941
Earned income credit: $2,200 (reported on 20.0% of returns)
Here:
$2,200
State:
$2,455
(% of AGI for various income ranges: 10.5% for AGIs below $25k)
Percentage of individuals using paid preparers for their 2012 taxes: 80.0%
Here:
80%
State:
61%
(% for various income ranges: 80.0% for AGIs below $25k, 60.0% for AGIs $25k-50k, 100.0% for AGIs $50k-75k, 100.0% for AGIs $75k-100k)
Averages for the 2004 tax year for zip code 72414, filed in 2005:
Average Adjusted Gross Income (AGI) in 2004: $30,726 (Individual Income Tax Returns)
Here:
$30,726
State:
$39,270
Salary/wage: $27,354 (reported on 83.2% of returns)
Here:
$27,354
State:
$34,079
(% of AGI for various income ranges: 72.0% for AGIs below $10k, 80.7% for AGIs $10k-25k, 88.4% for AGIs $25k-50k, 62.9% for AGIs $50k-75k, 63.8% for AGIs $75k-100k)
Taxable interest for individuals: $583 (reported on 31.6% of returns)
This zip code:
$583
Arkansas:
$1,904
Profit/loss from business: +$2,741 (reported on 14.2% of returns)
Here:
+$2,741
State:
+$7,823
Total itemized deductions: $14,267 (21% of AGI, reported on 15.8% of returns)
Here:
$14,267
State:
$18,389
Here:
20.5% of AGI
State:
21.0% of AGI
Charity contributions deductions: $1,889 (3% of AGI, reported on 9.5% of returns)
Here:
$1,889
State:
$4,725
Here:
2.8% of AGI
State:
5.1% of AGI
Total tax: $3,712 (reported on 73.2% of returns)
72414:
$3,712
State:
$6,047
(% of AGI for various income ranges: 2.1% for AGIs below $10k, 5.2% for AGIs $10k-25k, 5.8% for AGIs $25k-50k, 9.9% for AGIs $50k-75k, 14.8% for AGIs $75k-100k)
Earned income credit: $1,705 (reported on 23.2% of returns)
Here:
$1,705
State:
$1,909
Percentage of individuals using paid preparers for their 2004 taxes: 84.7%
Here:
85%
State:
67%
(% for various income ranges: 89.2% for AGIs below $10k, 78.7% for AGIs $10k-25k, 85.4% for AGIs $25k-50k, 95.2% for AGIs $50k-75k, 87.5% for AGIs $75k-100k)
Household received Food Stamps/SNAP in the past 12 months: 32 Household did not receive Food Stamps/SNAP in the past 12 months: 105
Women who had a birth in the past 12 months: 1 (0 now married, 1 unmarried) Women who did not have a birth in the past 12 months: 97 (40 now married, 57 unmarried)
Housing units in zip code 72414 with a mortgage: 34 (2 second mortgage, 1 both second mortgage and home equity loan) Median monthly owner costs for units with a mortgage: $902 Median monthly owner costs for units without a mortgage: $319
Residents with income below the poverty level in 2022:
This zip code:
37.9%
Whole state:
16.8%
Residents with income below 50% of the poverty level in 2022:
This zip code:
11.2%
Whole state:
8.5%
Median number of rooms in houses and condos:
Here:
6.4
State:
6.1
Median number of rooms in apartments:
Here:
5.7
State:
4.3
Notable locations in this zip code not listed on our city pages
Size of family households: 25 2-persons, 21 3-persons, 10 4-persons, 8 6-persons
Size of nonfamily households: 51 1-person, 23 2-persons
33 married couples with children.
38 single-parent households (23 men, 15 women).
91.0% of residents of 72414 zip code speak English at home.
8.0% of residents speak Spanish at home (50% very well, 50% well).
Foreign born population: 14 (4.6%) (22.0% of them are naturalized citizens)
This zip code:
4.6%
Whole state:
5.1%
93%Honduras
28%American
9%English
4%German
1%European
1%Irish
Year of entry for the foreign-born population
42010 or later
02000 to 2009
91990 to 1999
0Before 1990
Facilities with environmental interests located in this zip code:
BLACK OAK GIN COMPANY INCORPORATED (200 RODGERS AVENUE in BLACK OAK, AR)
AIR SYNTHETIC MINOR (AIRS/AFS) (Integrated Compliance Information System) - ICIS-06-2002-0323, FORMAL ENFORCEMENT ACTION, STATE MASTER (PDS) - AIR-1927-AGP-039, AIR MINOR Business SIC classification: COTTON GINNING; CHEMICALS AND CHEMICAL PREPARATIONS
Housing units lacking complete plumbing facilities: 4.7% Housing units lacking complete kitchen facilities: 3.4%
76.9%Utility gas
23.9%Electricity
Population in 1990: 518.
Place of birth for U.S.-born residents:
This state: 245
Midwest: 15
South: 29
West: 7
57% of the 72414 zip code residents lived in the same house 5 years ago. Out of people who lived in different houses, 65% lived in this county. Out of people who lived in different counties, 50% lived in Arkansas.
89% of the 72414 zip code residents lived in the same house 1 year ago. Out of people who lived in different houses, 64% moved from this county. Out of people who lived in different houses, 16% moved from different county within same state. Out of people who lived in different houses, 8% moved from different state.
Private vs. public school enrollment:
Students in private schools in grades 1 to 8 (elementary and middle school):
Here:
0.0%
Arkansas:
10.5%
Students in private schools in grades 9 to 12 (high school):
Here:
0.0%
Arkansas:
8.7%
Students in private undergraduate colleges:
Here:
0.0%
Arkansas:
19.4%
Occupation by median earnings in the past 12 months ($)
52,890Sales and related occupations
51,710Education, training, and library occupations
37,776Material moving occupations
35,915Construction and extraction occupations
22,614Farming, fishing, and forestry occupations
7,004Production occupations
Top industries in this zip code by the number of employees in 2005:
Other Services (except Public Administration): Religious Organizations (1-4 employees: 1 establishment)
Professional, Scientific, and Technical Services: Other Scientific and Technical Consulting Services (1-4: 1)
Other Services (except Public Administration): Commercial and Industrial Machinery and Equipment (except Automotive and Electronic) Repair and Maintenance (1-4: 1)
Fatal accident statistics in 2013:
Fatal accident count: 1
Vehicles involved in fatal accidents: 1
Fatal accidents caused by drunken drivers: 0
Fatalities: 1
Persons involved in fatal accidents: 1
Pedestrians involved in fatal accidents: 0
Fatal accident statistics in 2012:
Fatal accident count: 1
Vehicles involved in fatal accidents: 1
Fatal accidents caused by drunken drivers: 0
Fatalities: 1
Persons involved in fatal accidents: 1
Pedestrians involved in fatal accidents: 0
Home Mortgage Disclosure Act Aggregated Statistics For Year 2009 (Based on 2 partial tracts)
A) FHA, FSA/RHS & VA Home Purchase Loans
B) Conventional Home Purchase Loans
C) Refinancings
D) Home Improvement Loans
F) Non-occupant Loans on < 5 Family Dwellings (A B C & D)
G) Loans On Manufactured Home Dwelling (A B C & D)
Number
Average Value
Number
Average Value
Number
Average Value
Number
Average Value
Number
Average Value
Number
Average Value
LOANS ORIGINATED
2
$62,365
3
$65,817
7
$56,233
2
$52,215
2
$21,565
1
$17,120
APPLICATIONS APPROVED, NOT ACCEPTED
0
$0
0
$0
0
$0
0
$0
0
$0
0
$0
APPLICATIONS DENIED
0
$0
1
$28,750
2
$101,050
1
$7,820
0
$0
0
$0
APPLICATIONS WITHDRAWN
0
$0
1
$47,780
2
$87,625
0
$0
0
$0
0
$0
FILES CLOSED FOR INCOMPLETENESS
0
$0
0
$0
0
$0
0
$0
0
$0
0
$0
Aggregated Statistics For Year 2008 (Based on 2 partial tracts)
A) FHA, FSA/RHS & VA Home Purchase Loans
B) Conventional Home Purchase Loans
C) Refinancings
D) Home Improvement Loans
G) Loans On Manufactured Home Dwelling (A B C & D)
Number
Average Value
Number
Average Value
Number
Average Value
Number
Average Value
Number
Average Value
LOANS ORIGINATED
4
$55,175
4
$51,740
7
$49,256
3
$13,247
0
$0
APPLICATIONS APPROVED, NOT ACCEPTED
0
$0
0
$0
0
$0
0
$0
0
$0
APPLICATIONS DENIED
0
$0
2
$49,045
3
$77,160
2
$9,725
1
$36,150
APPLICATIONS WITHDRAWN
0
$0
1
$29,810
0
$0
0
$0
0
$0
FILES CLOSED FOR INCOMPLETENESS
0
$0
0
$0
0
$0
0
$0
0
$0
Aggregated Statistics For Year 2007 (Based on 2 partial tracts)
A) FHA, FSA/RHS & VA Home Purchase Loans
B) Conventional Home Purchase Loans
C) Refinancings
D) Home Improvement Loans
F) Non-occupant Loans on < 5 Family Dwellings (A B C & D)
G) Loans On Manufactured Home Dwelling (A B C & D)
Number
Average Value
Number
Average Value
Number
Average Value
Number
Average Value
Number
Average Value
Number
Average Value
LOANS ORIGINATED
1
$76,320
5
$54,542
10
$56,359
3
$34,600
2
$28,645
1
$17,760
APPLICATIONS APPROVED, NOT ACCEPTED
0
$0
0
$0
1
$66,380
0
$0
0
$0
0
$0
APPLICATIONS DENIED
0
$0
3
$47,493
4
$77,160
2
$18,075
0
$0
0
$0
APPLICATIONS WITHDRAWN
0
$0
0
$0
1
$58,980
0
$0
0
$0
0
$0
FILES CLOSED FOR INCOMPLETENESS
0
$0
0
$0
1
$65,750
0
$0
0
$0
0
$0
Aggregated Statistics For Year 2006 (Based on 2 partial tracts)
A) FHA, FSA/RHS & VA Home Purchase Loans
B) Conventional Home Purchase Loans
C) Refinancings
D) Home Improvement Loans
F) Non-occupant Loans on < 5 Family Dwellings (A B C & D)
G) Loans On Manufactured Home Dwelling (A B C & D)
Number
Average Value
Number
Average Value
Number
Average Value
Number
Average Value
Number
Average Value
Number
Average Value
LOANS ORIGINATED
3
$66,660
6
$58,663
10
$51,624
4
$24,205
2
$16,910
2
$21,245
APPLICATIONS APPROVED, NOT ACCEPTED
0
$0
1
$44,390
1
$35,520
0
$0
0
$0
0
$0
APPLICATIONS DENIED
0
$0
4
$33,718
4
$59,140
0
$0
0
$0
1
$40,590
APPLICATIONS WITHDRAWN
0
$0
1
$64,480
2
$54,330
0
$0
0
$0
0
$0
FILES CLOSED FOR INCOMPLETENESS
0
$0
0
$0
0
$0
0
$0
0
$0
0
$0
Aggregated Statistics For Year 2005 (Based on 2 partial tracts)
A) FHA, FSA/RHS & VA Home Purchase Loans
B) Conventional Home Purchase Loans
C) Refinancings
D) Home Improvement Loans
F) Non-occupant Loans on < 5 Family Dwellings (A B C & D)
G) Loans On Manufactured Home Dwelling (A B C & D)
Number
Average Value
Number
Average Value
Number
Average Value
Number
Average Value
Number
Average Value
Number
Average Value
LOANS ORIGINATED
2
$57,820
11
$51,140
8
$53,538
3
$13,530
2
$43,550
1
$15,860
APPLICATIONS APPROVED, NOT ACCEPTED
0
$0
2
$40,590
1
$74,200
0
$0
0
$0
1
$49,680
APPLICATIONS DENIED
0
$0
4
$35,885
4
$61,782
1
$23,470
1
$13,110
1
$37,840
APPLICATIONS WITHDRAWN
0
$0
2
$45,450
2
$65,325
1
$45,030
0
$0
0
$0
FILES CLOSED FOR INCOMPLETENESS
0
$0
0
$0
0
$0
0
$0
0
$0
0
$0
Aggregated Statistics For Year 2004 (Based on 2 partial tracts)
A) FHA, FSA/RHS & VA Home Purchase Loans
B) Conventional Home Purchase Loans
C) Refinancings
D) Home Improvement Loans
F) Non-occupant Loans on < 5 Family Dwellings (A B C & D)
G) Loans On Manufactured Home Dwelling (A B C & D)
Number
Average Value
Number
Average Value
Number
Average Value
Number
Average Value
Number
Average Value
Number
Average Value
LOANS ORIGINATED
3
$52,780
8
$42,016
12
$48,604
3
$19,377
4
$23,465
1
$18,810
APPLICATIONS APPROVED, NOT ACCEPTED
0
$0
0
$0
0
$0
0
$0
0
$0
0
$0
APPLICATIONS DENIED
1
$35,090
5
$39,194
7
$51,250
1
$8,030
1
$15,430
1
$42,280
APPLICATIONS WITHDRAWN
0
$0
1
$64,270
0
$0
0
$0
0
$0
0
$0
FILES CLOSED FOR INCOMPLETENESS
0
$0
0
$0
1
$67,860
0
$0
0
$0
0
$0
Aggregated Statistics For Year 2003 (Based on 2 partial tracts)
A) FHA, FSA/RHS & VA Home Purchase Loans
B) Conventional Home Purchase Loans
C) Refinancings
D) Home Improvement Loans
F) Non-occupant Loans on < 5 Family Dwellings (A B C & D)
Number
Average Value
Number
Average Value
Number
Average Value
Number
Average Value
Number
Average Value
LOANS ORIGINATED
1
$69,130
6
$40,483
19
$49,924
2
$14,800
3
$34,530
APPLICATIONS APPROVED, NOT ACCEPTED
0
$0
1
$51,160
2
$55,070
0
$0
0
$0
APPLICATIONS DENIED
0
$0
3
$45,170
7
$59,191
1
$8,460
1
$9,300
APPLICATIONS WITHDRAWN
0
$0
0
$0
3
$77,723
0
$0
0
$0
FILES CLOSED FOR INCOMPLETENESS
0
$0
0
$0
1
$83,930
0
$0
0
$0
Aggregated Statistics For Year 2002 (Based on 2 partial tracts)
A) FHA, FSA/RHS & VA Home Purchase Loans
B) Conventional Home Purchase Loans
C) Refinancings
D) Home Improvement Loans
F) Non-occupant Loans on < 5 Family Dwellings (A B C & D)
Number
Average Value
Number
Average Value
Number
Average Value
Number
Average Value
Number
Average Value
LOANS ORIGINATED
2
$46,615
8
$29,675
14
$57,259
5
$17,208
3
$20,717
APPLICATIONS APPROVED, NOT ACCEPTED
0
$0
1
$42,070
1
$38,690
0
$0
0
$0
APPLICATIONS DENIED
0
$0
3
$31,780
5
$45,494
1
$12,050
0
$0
APPLICATIONS WITHDRAWN
0
$0
0
$0
2
$43,970
0
$0
0
$0
FILES CLOSED FOR INCOMPLETENESS
0
$0
0
$0
0
$0
0
$0
0
$0
Aggregated Statistics For Year 2001 (Based on 2 partial tracts)
A) FHA, FSA/RHS & VA Home Purchase Loans
B) Conventional Home Purchase Loans
C) Refinancings
D) Home Improvement Loans
F) Non-occupant Loans on < 5 Family Dwellings (A B C & D)
Number
Average Value
Number
Average Value
Number
Average Value
Number
Average Value
Number
Average Value
LOANS ORIGINATED
3
$64,830
9
$35,727
14
$47,203
3
$13,953
2
$14,690
APPLICATIONS APPROVED, NOT ACCEPTED
0
$0
2
$29,915
1
$28,540
0
$0
0
$0
APPLICATIONS DENIED
0
$0
3
$34,740
6
$58,663
1
$8,460
0
$0
APPLICATIONS WITHDRAWN
0
$0
0
$0
2
$70,715
0
$0
0
$0
FILES CLOSED FOR INCOMPLETENESS
0
$0
0
$0
0
$0
0
$0
0
$0
Aggregated Statistics For Year 2000 (Based on 2 partial tracts)
A) FHA, FSA/RHS & VA Home Purchase Loans
B) Conventional Home Purchase Loans
C) Refinancings
D) Home Improvement Loans
F) Non-occupant Loans on < 5 Family Dwellings (A B C & D)
Number
Average Value
Number
Average Value
Number
Average Value
Number
Average Value
Number
Average Value
LOANS ORIGINATED
1
$66,170
15
$31,217
8
$53,379
2
$38,900
6
$21,492
APPLICATIONS APPROVED, NOT ACCEPTED
0
$0
0
$0
0
$0
1
$8,030
0
$0
APPLICATIONS DENIED
0
$0
7
$28,357
2
$63,950
1
$10,570
0
$0
APPLICATIONS WITHDRAWN
0
$0
0
$0
3
$41,433
0
$0
0
$0
FILES CLOSED FOR INCOMPLETENESS
0
$0
1
$69,970
0
$0
0
$0
0
$0
Aggregated Statistics For Year 1999 (Based on 1 partial tract)
A) FHA, FSA/RHS & VA Home Purchase Loans
B) Conventional Home Purchase Loans
C) Refinancings
D) Home Improvement Loans
F) Non-occupant Loans on < 5 Family Dwellings (A B C & D)


 Nearest zip codes: 72419, 72437, 72447, 72377, 72428, 72442.