Estimated zip code population in 2022: 2,832 Zip code population in 2010: 2,919 Zip code population in 2000: 2,480
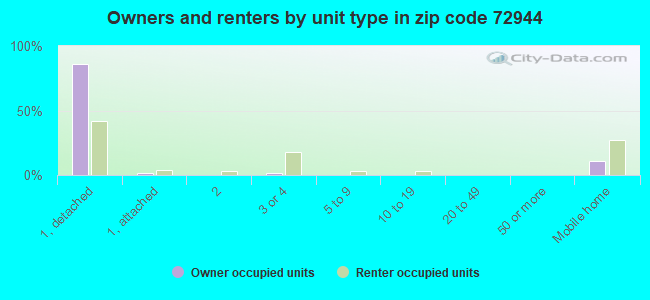
Houses and condos: 1,279 Renter-occupied apartments: 242
% of renters here:
21%
State:
34%
March 2022 cost of living index in zip code 72944: 78.1 (low, U.S. average is 100)
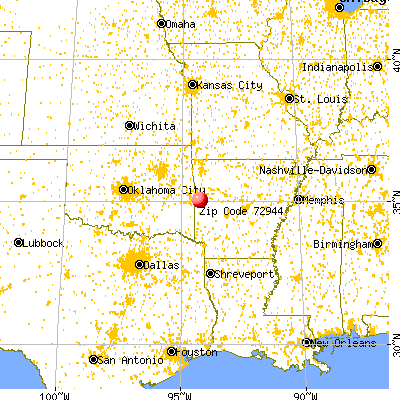
Land area: 79.1 sq. mi. Water area: 0.7 sq. mi.
Population density: 36 people per square mile
(very low).
OSM Map
General Map
Google Map
MSN Map
OSM Map
General Map
Google Map
MSN Map
OSM Map
General Map
Google Map
MSN Map
OSM Map
General Map
Google Map
MSN Map
Please wait while loading the map...
Real estate property taxes paid for housing units in 2022:
This zip code:
0.6% ($654)
Arkansas:
0.5% ($977)
Median real estate property taxes paid for housing units with mortgages in 2022: $776 (0.7%) Median real estate property taxes paid for housing units with no mortgage in 2022: $552 (0.5%)
Business Search- 14 Million verified businesses
Males: 1,394
(49.3%)
Females: 1,437
(50.7%)
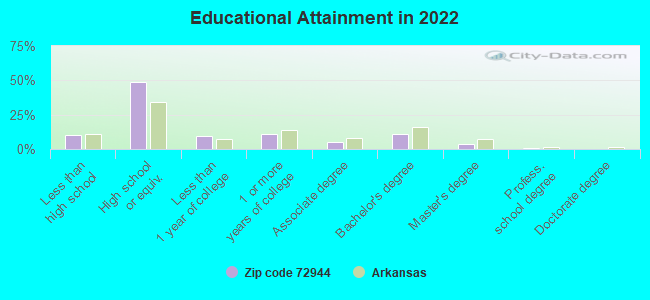
For population 25 years and over in 72944:
High school or higher: 89.2%
Bachelor's degree or higher: 15.7%
Graduate or professional degree: 4.8%
Unemployed: 4.6%
Mean travel time to work (commute): 34.3 minutes
For population 15 years and over in 72944:
Never married: 19.2%
Now married: 56.6%
Separated: 1.3%
Widowed: 9.0%
Divorced: 13.9%
Zip code 72944 compared to state average:
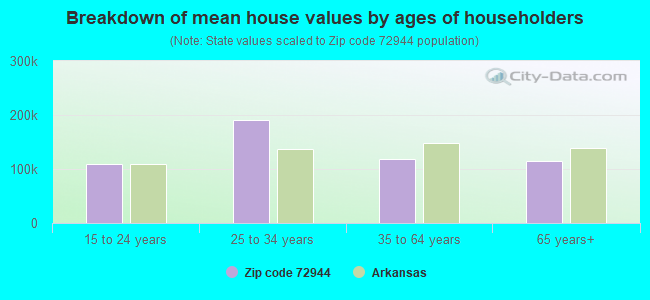
Median house value below state average.
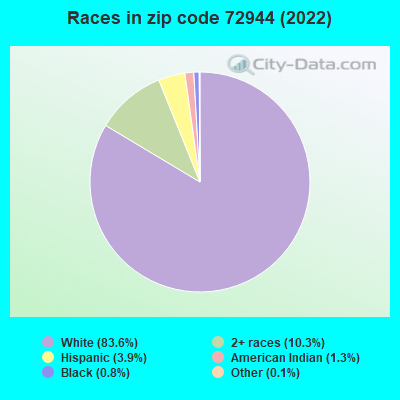
Black race population percentage significantly below state average.
Hispanic race population percentage below state average.
Median age above state average.
Foreign-born population percentage significantly below state average.
Renting percentage below state average.
Length of stay since moving in significantly above state average.
Percentage of population with a bachelor's degree or higher below state average.
Estimated median house/condo value in 2022: $102,964
72944:
$102,964
Arkansas:
$179,800
According to our research of Arkansas and other state lists, there were 7 registered sex offenders living in 72944 zip code as of June 16, 2024. The ratio of all residents to sex offenders in zip code 72944 is 515 to 1. The ratio of registered sex offenders to all residents in this zip code is near the state average.
Median resident age:
This zip code:
45.9 years
Arkansas median age:
38.9 years
Average household size:
This zip code:
2.5 people
Arkansas:
2.4 people
Averages for the 2020 tax year for zip code 72944, filed in 2021:
Average Adjusted Gross Income (AGI) in 2020: $49,688 (Individual Income Tax Returns)
Here:
$49,688
State:
$64,872
Salary/wage: $43,278 (reported on 83.2% of returns)
Here:
$43,278
State:
$50,644
(% of AGI for various income ranges: 1190.0% for AGIs below $25k, 3401.2% for AGIs $25k-50k, 6670.0% for AGIs $50k-75k, 9725.7% for AGIs $75k-100k, 17127.1% for AGIs $100k-200k)
Taxable interest for individuals: $1,650 (reported on 24.3% of returns)
This zip code:
$1,650
Arkansas:
$1,857
(% of AGI for various income ranges: 21.9% for AGIs below $25k, 34.8% for AGIs $25k-50k, 30.8% for AGIs $50k-75k, 142.9% for AGIs $75k-100k, 208.6% for AGIs $100k-200k)
Ordinary dividends: $1,660 (reported on 9.3% of returns)
Here:
$1,660
State:
$21,681
(% of AGI for various income ranges: 19.3% for AGIs below $25k, 15.8% for AGIs $50k-75k, 135.7% for AGIs $100k-200k)
Net capital gain/loss in AGI: +$10,089 (reported on 8.4% of returns)
Here:
+$10,089
State:
+$22,815
(% of AGI for various income ranges: 19.2% for AGIs $25k-50k, 41.7% for AGIs $50k-75k, 1157.1% for AGIs $100k-200k)
Profit/loss from business: +$9,022 (reported on 16.8% of returns)
Here:
+$9,022
State:
+$9,743
(% of AGI for various income ranges: 165.2% for AGIs below $25k, 174.0% for AGIs $25k-50k, 124.2% for AGIs $50k-75k, 652.9% for AGIs $75k-100k, 195.7% for AGIs $100k-200k)
Taxable individual retirement arrangement distribution: $16,337 (reported on 7.5% of returns)
72944:
$16,337
Arkansas:
$18,502
(% of AGI for various income ranges: 228.0% for AGIs $25k-50k, 1052.9% for AGIs $75k-100k)
Total itemized deductions: $27,167 (reported on 2.8% of returns)
Here:
$27,167
State:
$52,840
(% of AGI for various income ranges: 1164.3% for AGIs $75k-100k)
Charity contributions: $16,200 (reported on 1.9% of returns)
Here:
$16,200
State:
$35,735
(% of AGI for various income ranges: 462.9% for AGIs $75k-100k)
Taxes paid: $6,433 (reported on 2.8% of returns)
72944:
$6,433
State:
$7,196
(% of AGI for various income ranges: 275.7% for AGIs $75k-100k)
Earned income credit: $2,552 (reported on 25.2% of returns)
Here:
$2,552
State:
$2,546
(% of AGI for various income ranges: 151.9% for AGIs below $25k, 111.6% for AGIs $25k-50k)
Percentage of individuals using paid preparers for their 2020 taxes: 95.3%
Here:
95%
State:
94%
(% for various income ranges: 94.6% for AGIs below $25k, 96.7% for AGIs $25k-50k, 100.0% for AGIs $50k-75k, 90.9% for AGIs $75k-100k, 92.3% for AGIs $100k-200k)
Averages for the 2012 tax year for zip code 72944, filed in 2013:
Average Adjusted Gross Income (AGI) in 2012: $39,696 (Individual Income Tax Returns)
Here:
$39,696
State:
$52,148
Salary/wage: $34,922 (reported on 82.4% of returns)
Here:
$34,922
State:
$41,669
(% of AGI for various income ranges: 78.9% for AGIs below $25k, 80.6% for AGIs $25k-50k, 74.2% for AGIs $50k-75k, 77.0% for AGIs $75k-100k, 53.6% for AGIs $100k-200k)
Taxable interest for individuals: $1,296 (reported on 24.1% of returns)
This zip code:
$1,296
Arkansas:
$1,648
(% of AGI for various income ranges: 1.2% for AGIs below $25k, 1.1% for AGIs $25k-50k, 1.1% for AGIs $50k-75k, 0.3% for AGIs $75k-100k, 0.3% for AGIs $100k-200k)
Ordinary dividends: $1,700 (reported on 8.3% of returns)
Here:
$1,700
State:
$20,675
(% of AGI for various income ranges: 0.4% for AGIs below $25k, 0.5% for AGIs $50k-75k, 1.1% for AGIs $75k-100k)
Net capital gain/loss in AGI: +$1,256 (reported on 8.3% of returns)
Here:
+$1,256
State:
+$15,222
(% of AGI for various income ranges: 1.1% for AGIs $25k-50k, 0.1% for AGIs $75k-100k)
Profit/loss from business: +$8,029 (reported on 15.7% of returns)
Here:
+$8,029
State:
+$9,665
(% of AGI for various income ranges: 6.8% for AGIs below $25k, 2.6% for AGIs $25k-50k, 2.9% for AGIs $50k-75k, 5.2% for AGIs $75k-100k)
Taxable individual retirement arrangement distribution: $9,689 (reported on 8.3% of returns)
72944:
$9,689
Arkansas:
$13,644
(% of AGI for various income ranges: 2.1% for AGIs below $25k, 2.5% for AGIs $25k-50k, 5.2% for AGIs $50k-75k)
Total itemized deductions: $20,026 (24% of AGI, reported on 17.6% of returns)
Here:
$20,026
State:
$23,276
Here:
23.7% of AGI
State:
19.1% of AGI
(% of AGI for various income ranges: 5.0% for AGIs below $25k, 5.1% for AGIs $25k-50k, 8.6% for AGIs $50k-75k, 9.3% for AGIs $75k-100k, 15.6% for AGIs $100k-200k)
Charity contributions: $5,179 (reported on 13.0% of returns)
Here:
$5,179
State:
$5,996
(% of AGI for various income ranges: 1.7% for AGIs $25k-50k, 1.8% for AGIs $50k-75k, 1.7% for AGIs $75k-100k, 2.8% for AGIs $100k-200k)
Taxes paid: $5,179 (reported on 17.6% of returns)
72944:
$5,179
State:
$7,941
(% of AGI for various income ranges: 0.8% for AGIs below $25k, 0.8% for AGIs $25k-50k, 1.6% for AGIs $50k-75k, 2.7% for AGIs $75k-100k, 5.4% for AGIs $100k-200k)
Earned income credit: $2,472 (reported on 26.9% of returns)
Here:
$2,472
State:
$2,455
(% of AGI for various income ranges: 8.2% for AGIs below $25k, 2.0% for AGIs $25k-50k)
Percentage of individuals using paid preparers for their 2012 taxes: 74.1%
Here:
74%
State:
61%
(% for various income ranges: 71.4% for AGIs below $25k, 72.4% for AGIs $25k-50k, 80.0% for AGIs $50k-75k, 77.8% for AGIs $75k-100k, 83.3% for AGIs $100k-200k)
Averages for the 2004 tax year for zip code 72944, filed in 2005:
Average Adjusted Gross Income (AGI) in 2004: $32,065 (Individual Income Tax Returns)
Here:
$32,065
State:
$39,270
Salary/wage: $29,481 (reported on 84.3% of returns)
Here:
$29,481
State:
$34,079
(% of AGI for various income ranges: 108.1% for AGIs below $10k, 74.4% for AGIs $10k-25k, 83.3% for AGIs $25k-50k, 84.6% for AGIs $50k-75k, 76.5% for AGIs $75k-100k, 41.9% for AGIs over 100k)
Taxable interest for individuals: $1,703 (reported on 34.3% of returns)
This zip code:
$1,703
Arkansas:
$1,904
(% of AGI for various income ranges: 5.8% for AGIs below $10k, 3.7% for AGIs $10k-25k, 1.5% for AGIs $25k-50k, 0.6% for AGIs $50k-75k, 2.2% for AGIs $75k-100k, 1.8% for AGIs over 100k)
Taxable dividends: $779 (reported on 11.9% of returns)
Here:
$779
State:
$5,995
(% of AGI for various income ranges: 0.5% for AGIs below $10k, 0.3% for AGIs $10k-25k, 0.3% for AGIs $25k-50k, 0.4% for AGIs $50k-75k, 0.3% for AGIs over 100k)
Net capital gain/loss: +$4,241 (reported on 10.5% of returns)
Here:
+$4,241
State:
+$10,430
(% of AGI for various income ranges: -1.7% for AGIs below $10k, 0.2% for AGIs $10k-25k, 0.5% for AGIs $25k-50k, 1.2% for AGIs $50k-75k, 10.4% for AGIs $75k-100k)
Profit/loss from business: +$4,401 (reported on 18.2% of returns)
Here:
+$4,401
State:
+$7,823
(% of AGI for various income ranges: 28.1% for AGIs below $10k, 7.4% for AGIs $10k-25k, 2.6% for AGIs $25k-50k, -0.3% for AGIs $50k-75k, -2.7% for AGIs $75k-100k)
IRA payment deduction: $3,053 (reported on 1.8% of returns)
72944:
$3,053
Arkansas:
$3,204
Total itemized deductions: $14,849 (25% of AGI, reported on 17.4% of returns)
Here:
$14,849
State:
$18,389
Here:
25.0% of AGI
State:
21.0% of AGI
(% of AGI for various income ranges: 7.1% for AGIs $10k-25k, 6.6% for AGIs $25k-50k, 9.0% for AGIs $50k-75k, 10.9% for AGIs $75k-100k, 11.3% for AGIs over 100k)
Charity contributions deductions: $4,365 (7% of AGI, reported on 15.2% of returns)
Here:
$4,365
State:
$4,725
Here:
7.1% of AGI
State:
5.1% of AGI
(% of AGI for various income ranges: 1.1% for AGIs $10k-25k, 1.1% for AGIs $25k-50k, 2.3% for AGIs $50k-75k, 4.9% for AGIs $75k-100k, 4.3% for AGIs over 100k)
Total tax: $3,357 (reported on 72.8% of returns)
72944:
$3,357
State:
$6,047
(% of AGI for various income ranges: 3.8% for AGIs below $10k, 3.9% for AGIs $10k-25k, 5.6% for AGIs $25k-50k, 7.8% for AGIs $50k-75k, 9.7% for AGIs $75k-100k, 18.2% for AGIs over 100k)
Earned income credit: $1,707 (reported on 22.3% of returns)
Here:
$1,707
State:
$1,909
Percentage of individuals using paid preparers for their 2004 taxes: 74.3%
Here:
74%
State:
67%
(% for various income ranges: 70.1% for AGIs below $10k, 73.8% for AGIs $10k-25k, 75.2% for AGIs $25k-50k, 79.0% for AGIs $50k-75k, 69.7% for AGIs $75k-100k, 82.6% for AGIs over 100k)
Household received Food Stamps/SNAP in the past 12 months: 103 Household did not receive Food Stamps/SNAP in the past 12 months: 1,028
Women who had a birth in the past 12 months: 14 (15 now married, 0 unmarried) Women who did not have a birth in the past 12 months: 456 (292 now married, 165 unmarried)
Housing units in zip code 72944 with a mortgage: 375 (20 second mortgage, 1 home equity loan, 13 both second mortgage and home equity loan) Median monthly owner costs for units with a mortgage: $1,121 Median monthly owner costs for units without a mortgage: $353
Residents with income below the poverty level in 2022:
This zip code:
22.9%
Whole state:
16.8%
Residents with income below 50% of the poverty level in 2022:
This zip code:
11.4%
Whole state:
8.5%
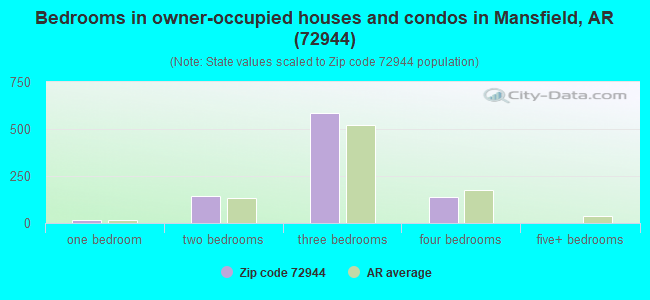
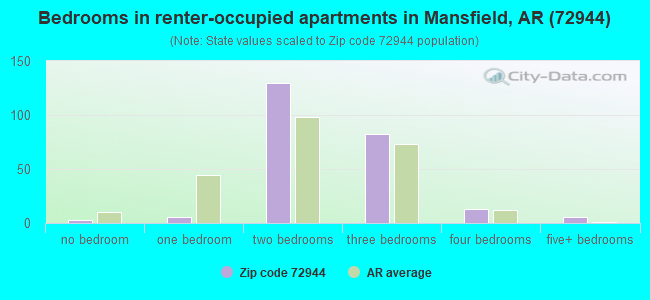
Median number of rooms in houses and condos:
Here:
5.9
State:
6.1
Median number of rooms in apartments:
Here:
4.7
State:
4.3
Notable locations in this zip code not listed on our city pages
Notable locations in zip code 72944: Northwestern Company (A), Pine Grove Valley (B), Mansfield Police Department (C), Northwest Scott County Volunteer Fire Department Station 1 (D), Northwest Scott County Volunteer Fire Department Station 2 (E), Mansfield Fire Station (F). Display/hide their locations on the map
Churches in zip code 72944 include: James Fork Church (A), Coop Prairie Cumberland Presbyterian Church (B), Pleasant Grove Number 3 Baptist Church (C), Rock Creek Church (D). Display/hide their locations on the map
Cemeteries: Pleasant Grove Cemetery (1), Bethel Cemetery (2), Cantrell Cemetery (3), Bethel Cemetery (4), Lewis Cemetery (5), Pinkston Cemetery (6), Sorrels Cemetery (7). Display/hide their locations on the map
In group quarters: 44 (-1 institutionalized population)
Size of family households: 358 2-persons, 182 3-persons, 139 4-persons, 68 5-persons, 30 6-persons, 6 7-or-more-persons
Size of nonfamily households: 304 1-person, 32 2-persons, 3 3-persons
314 married couples with children.
97 single-parent households (27 men, 70 women).
98.9% of residents of 72944 zip code speak English at home.
0.5% of residents speak Spanish at home (100% very well).
0.4% of residents speak other Indo-European language at home (100% very well).
Foreign born population: 16 (0.6%) (100.0% of them are naturalized citizens)
This zip code:
0.6%
Whole state:
5.1%
94%Honduras
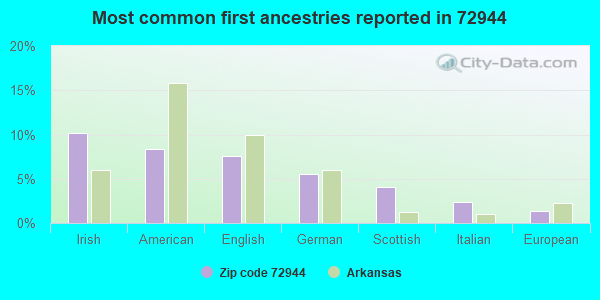
10%Irish
8%American
8%English
6%German
4%Scottish
2%Italian
1%European
Year of entry for the foreign-born population
02010 or later
02000 to 2009
01990 to 1999
22Before 1990
Housing units lacking complete plumbing facilities: 1.4% Housing units lacking complete kitchen facilities: 2.0%
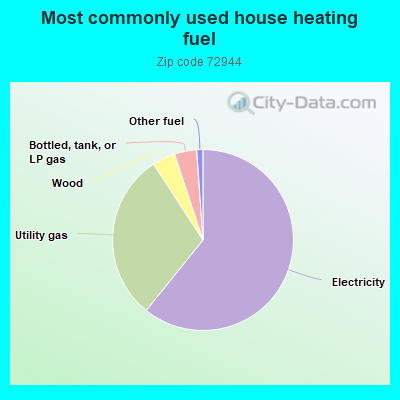
61.0%Electricity
30.1%Utility gas
4.1%Wood
4.0%Bottled, tank, or LP gas
1.1%Other fuel
Population in 1990: 2,607.
Place of birth for U.S.-born residents:
This state: 1,730
Northeast: 63
Midwest: 256
South: 346
West: 421
56% of the 72944 zip code residents lived in the same house 5 years ago. Out of people who lived in different houses, 54% lived in this county. Out of people who lived in different counties, 50% lived in Arkansas.
92% of the 72944 zip code residents lived in the same house 1 year ago. Out of people who lived in different houses, 31% moved from this county. Out of people who lived in different houses, 46% moved from different county within same state. Out of people who lived in different houses, 28% moved from different state.
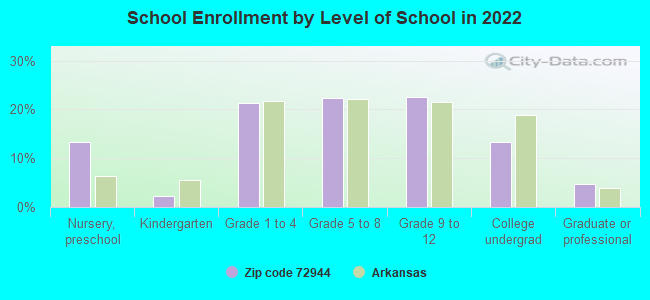
Private vs. public school enrollment:
Students in private schools in grades 1 to 8 (elementary and middle school): 19
Here:
7.6%
Arkansas:
10.5%
Students in private schools in grades 9 to 12 (high school): 19
Here:
14.5%
Arkansas:
8.7%
Students in private undergraduate colleges: 29
Here:
36.6%
Arkansas:
19.4%
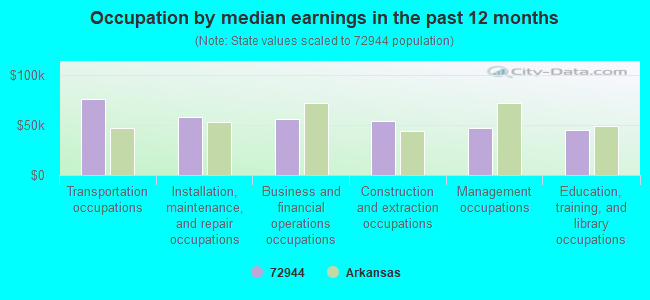
Occupation by median earnings in the past 12 months ($)
75,814Transportation occupations
57,778Installation, maintenance, and repair occupations
56,240Business and financial operations occupations
54,308Construction and extraction occupations
47,129Management occupations
45,228Education, training, and library occupations
Top industries in this zip code by the number of employees in 2005:
Health Care and Social Assistance: Child and Youth Services (50-99 employees: 1 establishment)
Accommodation and Food Services: Limited-Service Restaurants (20-49: 1, 10-19: 1)
Other Services (except Public Administration): Religious Organizations (5-9: 1, 1-4: 5)
Finance and Insurance: Commercial Banking (10-19: 1, 1-4: 1)
Construction: Plumbing, Heating, and Air-Conditioning Contractors (5-9: 1, 1-4: 1)
Health Care and Social Assistance: Offices of Physicians (except Mental Health Specialists) (5-9: 1)
Health Care and Social Assistance: Offices of Dentists (5-9: 1)
People in group quarters in 2010:
42 people in correctional facilities intended for juveniles
People in group quarters in 2000:
26 people in training schools for juvenile delinquents
Home Mortgage Disclosure Act Aggregated Statistics For Year 2009 (Based on 2 partial tracts)
A) FHA, FSA/RHS & VA Home Purchase Loans
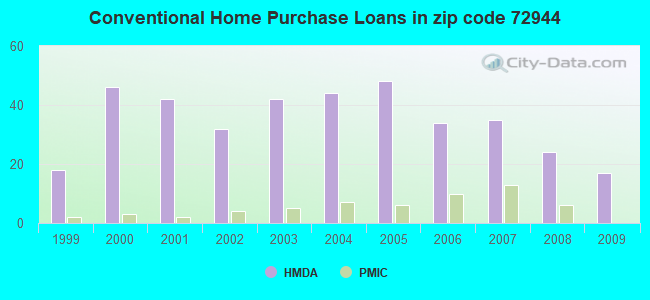
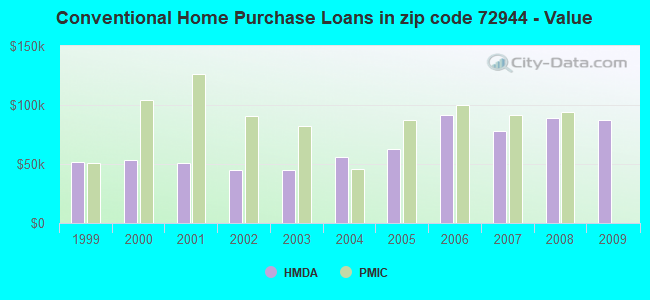
B) Conventional Home Purchase Loans
C) Refinancings
D) Home Improvement Loans
F) Non-occupant Loans on < 5 Family Dwellings (A B C & D)
G) Loans On Manufactured Home Dwelling (A B C & D)
Number
Average Value
Number
Average Value
Number
Average Value
Number
Average Value
Number
Average Value
Number
Average Value
LOANS ORIGINATED
13
$124,615
17
$87,658
49
$104,975
18
$25,091
6
$64,908
7
$40,281
APPLICATIONS APPROVED, NOT ACCEPTED
0
$0
6
$83,325
1
$289,820
1
$8,450
1
$10,260
5
$43,594
APPLICATIONS DENIED
2
$103,550
10
$42,206
20
$107,567
11
$13,943
3
$35,623
10
$37,375
APPLICATIONS WITHDRAWN
2
$97,210
4
$70,492
14
$107,735
4
$65,662
1
$22,340
1
$33,210
FILES CLOSED FOR INCOMPLETENESS
1
$130,420
2
$41,060
1
$266,880
0
$0
0
$0
1
$32,610
Aggregated Statistics For Year 2008 (Based on 2 partial tracts)
A) FHA, FSA/RHS & VA Home Purchase Loans
B) Conventional Home Purchase Loans
C) Refinancings
D) Home Improvement Loans
F) Non-occupant Loans on < 5 Family Dwellings (A B C & D)
G) Loans On Manufactured Home Dwelling (A B C & D)
Number
Average Value
Number
Average Value
Number
Average Value
Number
Average Value
Number
Average Value
Number
Average Value
LOANS ORIGINATED
10
$116,050
24
$88,885
46
$92,171
29
$20,529
7
$63,313
11
$61,533
APPLICATIONS APPROVED, NOT ACCEPTED
0
$0
3
$65,813
2
$74,870
1
$27,770
1
$111,700
4
$59,475
APPLICATIONS DENIED
2
$163,630
15
$61,587
15
$104,699
7
$21,996
4
$55,852
10
$66,660
APPLICATIONS WITHDRAWN
1
$49,510
7
$54,514
12
$99,828
2
$27,475
2
$52,835
3
$42,467
FILES CLOSED FOR INCOMPLETENESS
0
$0
1
$9,060
2
$75,475
0
$0
0
$0
0
$0
Aggregated Statistics For Year 2007 (Based on 2 partial tracts)
A) FHA, FSA/RHS & VA Home Purchase Loans
B) Conventional Home Purchase Loans
C) Refinancings
D) Home Improvement Loans
E) Loans on Dwellings For 5+ Families
F) Non-occupant Loans on < 5 Family Dwellings (A B C & D)
G) Loans On Manufactured Home Dwelling (A B C & D)
Number
Average Value
Number
Average Value
Number
Average Value
Number
Average Value
Number
Average Value
Number
Average Value
Number
Average Value
LOANS ORIGINATED
3
$65,813
35
$78,253
48
$85,664
34
$23,939
1
$92,990
12
$58,971
18
$38,844
APPLICATIONS APPROVED, NOT ACCEPTED
0
$0
5
$109,892
4
$134,648
3
$17,913
0
$0
0
$0
4
$83,475
APPLICATIONS DENIED
1
$85,140
18
$85,303
27
$94,304
10
$13,284
0
$0
2
$79,400
7
$88,844
APPLICATIONS WITHDRAWN
2
$112,005
4
$124,382
13
$100,788
2
$63,095
0
$0
1
$87,550
1
$17,510
FILES CLOSED FOR INCOMPLETENESS
0
$0
1
$36,230
3
$114,320
1
$24,150
0
$0
0
$0
0
$0
Aggregated Statistics For Year 2006 (Based on 2 partial tracts)
A) FHA, FSA/RHS & VA Home Purchase Loans
B) Conventional Home Purchase Loans
C) Refinancings
D) Home Improvement Loans
E) Loans on Dwellings For 5+ Families
F) Non-occupant Loans on < 5 Family Dwellings (A B C & D)
G) Loans On Manufactured Home Dwelling (A B C & D)
Number
Average Value
Number
Average Value
Number
Average Value
Number
Average Value
Number
Average Value
Number
Average Value
Number
Average Value
LOANS ORIGINATED
6
$118,245
34
$91,671
43
$82,356
37
$20,023
1
$79,100
9
$26,500
10
$38,221
APPLICATIONS APPROVED, NOT ACCEPTED
0
$0
10
$64,546
4
$87,250
2
$17,510
0
$0
0
$0
7
$46,406
APPLICATIONS DENIED
1
$67,630
20
$53,738
22
$85,795
8
$17,058
0
$0
1
$33,810
13
$43,102
APPLICATIONS WITHDRAWN
2
$57,360
6
$77,790
13
$79,795
3
$42,870
0
$0
1
$94,190
1
$12,080
FILES CLOSED FOR INCOMPLETENESS
0
$0
1
$9,060
2
$90,570
1
$25,960
0
$0
0
$0
0
$0
Aggregated Statistics For Year 2005 (Based on 2 partial tracts)
A) FHA, FSA/RHS & VA Home Purchase Loans
B) Conventional Home Purchase Loans
C) Refinancings
D) Home Improvement Loans
F) Non-occupant Loans on < 5 Family Dwellings (A B C & D)
G) Loans On Manufactured Home Dwelling (A B C & D)
Number
Average Value
Number
Average Value
Number
Average Value
Number
Average Value
Number
Average Value
Number
Average Value
LOANS ORIGINATED
9
$101,439
48
$62,657
50
$78,784
32
$20,756
18
$47,599
19
$39,311
APPLICATIONS APPROVED, NOT ACCEPTED
2
$37,435
8
$44,304
5
$59,534
2
$40,155
1
$79,100
7
$36,400
APPLICATIONS DENIED
3
$48,707
19
$54,406
27
$81,759
6
$72,457
4
$38,795
13
$46,400
APPLICATIONS WITHDRAWN
2
$89,665
5
$59,294
14
$114,981
1
$16,910
0
$0
0
$0
FILES CLOSED FOR INCOMPLETENESS
1
$51,930
1
$46,490
3
$117,137
0
$0
1
$87,550
0
$0
Aggregated Statistics For Year 2004 (Based on 2 partial tracts)
A) FHA, FSA/RHS & VA Home Purchase Loans
B) Conventional Home Purchase Loans
C) Refinancings
D) Home Improvement Loans
F) Non-occupant Loans on < 5 Family Dwellings (A B C & D)
G) Loans On Manufactured Home Dwelling (A B C & D)
Number
Average Value
Number
Average Value
Number
Average Value
Number
Average Value
Number
Average Value
Number
Average Value
LOANS ORIGINATED
11
$95,565
44
$55,700
66
$67,223
27
$25,896
24
$43,373
28
$39,635
APPLICATIONS APPROVED, NOT ACCEPTED
1
$93,590
13
$55,410
8
$64,531
2
$25,660
0
$0
10
$53,074
APPLICATIONS DENIED
3
$47,900
19
$58,537
31
$64,763
8
$17,962
2
$76,985
17
$48,872
APPLICATIONS WITHDRAWN
1
$36,230
1
$79,700
13
$80,305
2
$6,640
1
$88,760
0
$0
FILES CLOSED FOR INCOMPLETENESS
1
$120,160
3
$42,670
3
$89,363
0
$0
0
$0
1
$82,720
Aggregated Statistics For Year 2003 (Based on 2 partial tracts)
A) FHA, FSA/RHS & VA Home Purchase Loans
B) Conventional Home Purchase Loans
C) Refinancings
D) Home Improvement Loans
E) Loans on Dwellings For 5+ Families
F) Non-occupant Loans on < 5 Family Dwellings (A B C & D)
Number
Average Value
Number
Average Value
Number
Average Value
Number
Average Value
Number
Average Value
Number
Average Value
LOANS ORIGINATED
3
$82,117
42
$45,026
86
$71,782
18
$18,684
1
$53,740
24
$43,625
APPLICATIONS APPROVED, NOT ACCEPTED
0
$0
6
$61,588
10
$68,290
2
$50,720
0
$0
0
$0
APPLICATIONS DENIED
2
$52,530
9
$42,400
30
$70,463
4
$10,112
0
$0
1
$15,100
APPLICATIONS WITHDRAWN
1
$48,910
5
$40,214
21
$68,143
1
$22,340
0
$0
1
$17,510
FILES CLOSED FOR INCOMPLETENESS
0
$0
3
$71,853
5
$80,910
0
$0
0
$0
0
$0
Aggregated Statistics For Year 2002 (Based on 2 partial tracts)
A) FHA, FSA/RHS & VA Home Purchase Loans
B) Conventional Home Purchase Loans
C) Refinancings
D) Home Improvement Loans
F) Non-occupant Loans on < 5 Family Dwellings (A B C & D)
Number
Average Value
Number
Average Value
Number
Average Value
Number
Average Value
Number
Average Value
LOANS ORIGINATED
9
$85,873
32
$44,719
79
$65,531
27
$20,887
22
$31,288
APPLICATIONS APPROVED, NOT ACCEPTED
0
$0
4
$55,098
11
$61,258
2
$13,285
0
$0
APPLICATIONS DENIED
3
$60,180
18
$50,048
30
$66,438
9
$18,583
1
$28,980
APPLICATIONS WITHDRAWN
1
$96,610
7
$69,696
11
$67,296
1
$38,040
1
$12,080
FILES CLOSED FOR INCOMPLETENESS
0
$0
0
$0
4
$85,438
0
$0
0
$0
Aggregated Statistics For Year 2001 (Based on 2 partial tracts)
A) FHA, FSA/RHS & VA Home Purchase Loans
B) Conventional Home Purchase Loans
C) Refinancings
D) Home Improvement Loans
E) Loans on Dwellings For 5+ Families
F) Non-occupant Loans on < 5 Family Dwellings (A B C & D)
Number
Average Value
Number
Average Value
Number
Average Value
Number
Average Value
Number
Average Value
Number
Average Value
LOANS ORIGINATED
7
$73,664
42
$50,518
69
$61,369
32
$16,246
2
$195,330
18
$22,844
APPLICATIONS APPROVED, NOT ACCEPTED
1
$37,440
5
$47,458
11
$61,313
1
$8,450
0
$0
0
$0
APPLICATIONS DENIED
1
$71,250
24
$37,109
36
$58,116
11
$24,426
0
$0
4
$56,152
APPLICATIONS WITHDRAWN
1
$19,930
4
$43,322
14
$60,682
1
$30,190
0
$0
0
$0
FILES CLOSED FOR INCOMPLETENESS
0
$0
1
$27,170
3
$52,330
0
$0
0
$0
0
$0
Aggregated Statistics For Year 2000 (Based on 2 partial tracts)
A) FHA, FSA/RHS & VA Home Purchase Loans
B) Conventional Home Purchase Loans
C) Refinancings
D) Home Improvement Loans
F) Non-occupant Loans on < 5 Family Dwellings (A B C & D)
Number
Average Value
Number
Average Value
Number
Average Value
Number
Average Value
Number
Average Value
LOANS ORIGINATED
8
$57,059
46
$53,568
43
$55,086
28
$18,675
13
$26,288
APPLICATIONS APPROVED, NOT ACCEPTED
2
$73,060
10
$33,692
4
$60,530
4
$12,378
1
$9,060
APPLICATIONS DENIED
1
$44,680
46
$35,191
29
$48,908
13
$14,770
4
$24,908
APPLICATIONS WITHDRAWN
3
$57,963
7
$48,649
16
$53,134
1
$32,000
1
$13,280
FILES CLOSED FOR INCOMPLETENESS
0
$0
1
$54,950
2
$55,550
0
$0
0
$0
Aggregated Statistics For Year 1999 (Based on 1 partial tract)
A) FHA, FSA/RHS & VA Home Purchase Loans
B) Conventional Home Purchase Loans
C) Refinancings
D) Home Improvement Loans
F) Non-occupant Loans on < 5 Family Dwellings (A B C & D)
Detailed PMIC statistics for the following Tracts:0103.02
2002 - 2018 National Fire Incident Reporting System (NFIRS) incidents
Based on the data from the years 2002 - 2018 the average number of fires per year is 35. The highest number of fire incidents - 57 took place in 2011, and the least - 6 in 2002. The data has an increasing trend.
When looking into fire subcategories, the most incidents belonged to: Outside Fires (55.9%), and Structure Fires (34.9%).
Fire incident types reported to NFIRS in Zip Code 72944


 Nearest zip codes: 72940, 72945, 72938, 72958, 72936, 72937.


 Based on the data from the years 2002 - 2018 the average number of fires per year is 35. The highest number of fire incidents - 57 took place in 2011, and the least - 6 in 2002. The data has an increasing trend.
 When looking into fire subcategories, the most incidents belonged to: Outside Fires (55.9%), and Structure Fires (34.9%).