Estimated zip code population in 2022: 2,680 Zip code population in 2010: 2,713 Zip code population in 2000: 2,426
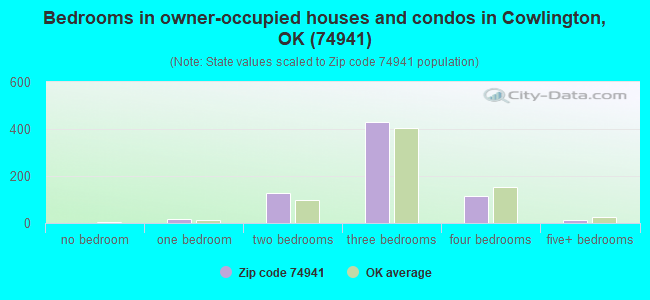
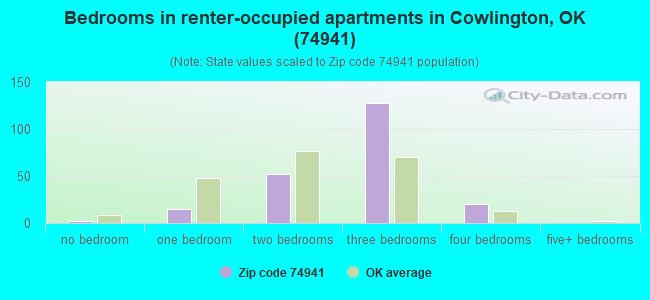
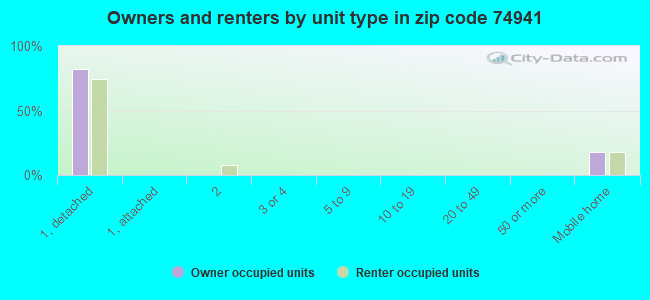
Houses and condos: 1,117 Renter-occupied apartments: 221
% of renters here:
24%
State:
35%
March 2022 cost of living index in zip code 74941: 77.8 (low, U.S. average is 100)
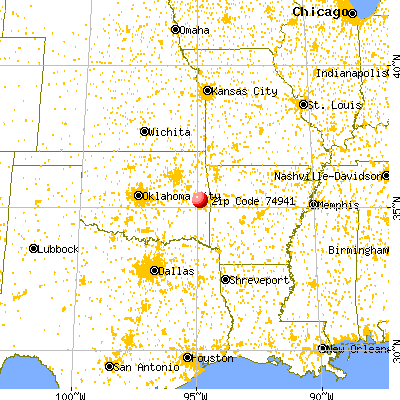
Land area: 112.5 sq. mi. Water area: 26.7 sq. mi.
Population density: 24 people per square mile
(very low).
OSM Map
General Map
Google Map
MSN Map
OSM Map
General Map
Google Map
MSN Map
OSM Map
General Map
Google Map
MSN Map
OSM Map
General Map
Google Map
MSN Map
Please wait while loading the map...
Real estate property taxes paid for housing units in 2022:
This zip code:
0.5% ($543)
Oklahoma:
0.8% ($1,501)
Median real estate property taxes paid for housing units with mortgages in 2022: $839 (0.6%) Median real estate property taxes paid for housing units with no mortgage in 2022: $385 (0.4%)
Business Search- 14 Million verified businesses
Males: 1,292
(48.2%)
Females: 1,388
(51.8%)
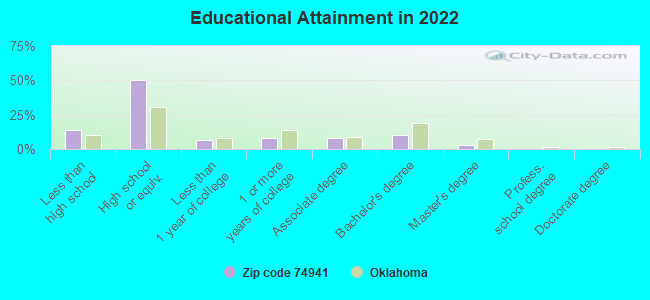
For population 25 years and over in 74941:
High school or higher: 84.9%
Bachelor's degree or higher: 13.6%
Graduate or professional degree: 3.7%
Unemployed: 4.8%
Mean travel time to work (commute): 27.2 minutes
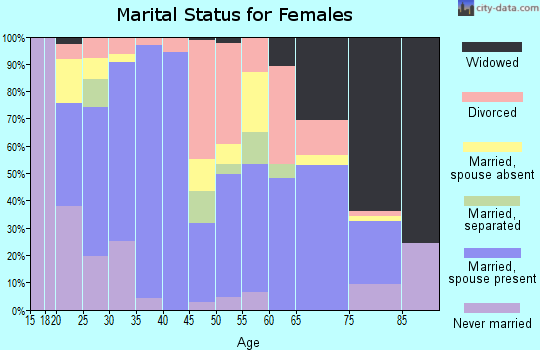
For population 15 years and over in 74941:
Never married: 23.3%
Now married: 55.3%
Separated: 2.3%
Widowed: 8.1%
Divorced: 11.1%
Zip code 74941 compared to state average:
Median house value below state average.
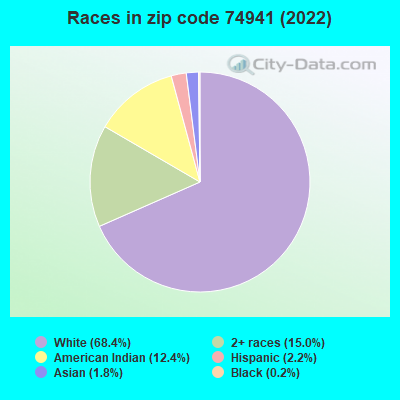
Black race population percentage significantly below state average.
Hispanic race population percentage significantly below state average.
Foreign-born population percentage significantly below state average.
Length of stay since moving in significantly above state average.
Percentage of population with a bachelor's degree or higher below state average.
Estimated median house/condo value in 2022: $106,363
74941:
$106,363
Oklahoma:
$191,700
According to our research of Oklahoma and other state lists, there were 5 registered sex offenders living in 74941 zip code as of June 19, 2024. The ratio of all residents to sex offenders in zip code 74941 is 555 to 1. The ratio of registered sex offenders to all residents in this zip code is near the state average.
Median resident age:
This zip code:
38.6 years
Oklahoma median age:
37.1 years
Average household size:
This zip code:
2.9 people
Oklahoma:
2.5 people
Averages for the 2020 tax year for zip code 74941, filed in 2021:
Average Adjusted Gross Income (AGI) in 2020: $38,633 (Individual Income Tax Returns)
Here:
$38,633
State:
$63,060
Salary/wage: $38,492 (reported on 78.3% of returns)
Here:
$38,492
State:
$52,427
(% of AGI for various income ranges: 1300.7% for AGIs below $25k, 3561.6% for AGIs $25k-50k, 6724.4% for AGIs $50k-75k, 9224.0% for AGIs $75k-100k, 16277.5% for AGIs $100k-200k)
Taxable interest for individuals: $763 (reported on 20.7% of returns)
This zip code:
$763
Oklahoma:
$1,603
(% of AGI for various income ranges: 14.5% for AGIs below $25k, 4.2% for AGIs $25k-50k, 6.7% for AGIs $50k-75k, 110.0% for AGIs $75k-100k, 85.0% for AGIs $100k-200k)
Ordinary dividends: $683 (reported on 6.5% of returns)
Here:
$683
State:
$7,001
(% of AGI for various income ranges: 5.2% for AGIs below $25k, 28.9% for AGIs $50k-75k)
Net capital gain/loss in AGI: +$4,200 (reported on 9.8% of returns)
Here:
+$4,200
State:
+$19,855
(% of AGI for various income ranges: 15.2% for AGIs below $25k, 80.5% for AGIs $25k-50k, 362.0% for AGIs $75k-100k)
Profit/loss from business: +$6,717 (reported on 19.6% of returns)
Here:
+$6,717
State:
+$9,904
(% of AGI for various income ranges: 195.5% for AGIs below $25k, 209.5% for AGIs $25k-50k, 65.6% for AGIs $50k-75k, 370.0% for AGIs $75k-100k)
Taxable individual retirement arrangement distribution: $9,050 (reported on 4.3% of returns)
74941:
$9,050
Oklahoma:
$20,476
(% of AGI for various income ranges: 190.5% for AGIs $25k-50k)
Earned income credit: $2,790 (reported on 31.5% of returns)
Here:
$2,790
State:
$2,435
(% of AGI for various income ranges: 190.3% for AGIs below $25k, 135.3% for AGIs $25k-50k)
Percentage of individuals using paid preparers for their 2020 taxes: 95.7%
Here:
96%
State:
94%
(% for various income ranges: 95.2% for AGIs below $25k, 95.8% for AGIs $25k-50k, 100.0% for AGIs $50k-75k, 85.7% for AGIs $75k-100k, 100.0% for AGIs $100k-200k)
Averages for the 2012 tax year for zip code 74941, filed in 2013:
Average Adjusted Gross Income (AGI) in 2012: $36,486 (Individual Income Tax Returns)
Here:
$36,486
State:
$58,581
Salary/wage: $35,260 (reported on 78.3% of returns)
Here:
$35,260
State:
$45,973
(% of AGI for various income ranges: 69.8% for AGIs below $25k, 79.0% for AGIs $25k-50k, 81.1% for AGIs $50k-75k, 85.0% for AGIs $75k-100k, 61.7% for AGIs $100k-200k)
Taxable interest for individuals: $626 (reported on 20.7% of returns)
This zip code:
$626
Oklahoma:
$1,625
(% of AGI for various income ranges: 0.7% for AGIs below $25k, 0.6% for AGIs $25k-50k, 0.3% for AGIs $50k-75k, 0.2% for AGIs $75k-100k)
Ordinary dividends: $757 (reported on 7.6% of returns)
Here:
$757
State:
$6,374
Net capital gain/loss in AGI: +$2,943 (reported on 7.6% of returns)
Here:
+$2,943
State:
+$24,023
(% of AGI for various income ranges: 0.9% for AGIs below $25k, 1.1% for AGIs $25k-50k, 0.8% for AGIs $50k-75k)
Profit/loss from business: +$6,784 (reported on 20.7% of returns)
Here:
+$6,784
State:
+$11,913
(% of AGI for various income ranges: 11.3% for AGIs below $25k, 6.7% for AGIs $25k-50k, 2.1% for AGIs $75k-100k)
Taxable individual retirement arrangement distribution: $8,833 (reported on 3.3% of returns)
74941:
$8,833
Oklahoma:
$15,242
Total itemized deductions: $24,007 (28% of AGI, reported on 16.3% of returns)
Here:
$24,007
State:
$24,882
Here:
28.0% of AGI
State:
18.8% of AGI
(% of AGI for various income ranges: 10.2% for AGIs $25k-50k, 11.6% for AGIs $50k-75k, 12.3% for AGIs $75k-100k, 17.0% for AGIs $100k-200k)
Charity contributions: $4,678 (reported on 9.8% of returns)
Here:
$4,678
State:
$6,591
(% of AGI for various income ranges: 1.6% for AGIs $25k-50k, 1.0% for AGIs $50k-75k, 1.1% for AGIs $75k-100k, 2.2% for AGIs $100k-200k)
Taxes paid: $3,988 (reported on 17.4% of returns)
74941:
$3,988
State:
$7,196
(% of AGI for various income ranges: 0.9% for AGIs $25k-50k, 1.8% for AGIs $50k-75k, 2.6% for AGIs $75k-100k, 4.1% for AGIs $100k-200k)
Earned income credit: $2,550 (reported on 30.4% of returns)
Here:
$2,550
State:
$2,354
(% of AGI for various income ranges: 10.8% for AGIs below $25k, 1.9% for AGIs $25k-50k)
Percentage of individuals using paid preparers for their 2012 taxes: 80.4%
Here:
80%
State:
56%
(% for various income ranges: 79.1% for AGIs below $25k, 80.0% for AGIs $25k-50k, 83.3% for AGIs $50k-75k, 85.7% for AGIs $75k-100k, 80.0% for AGIs $100k-200k)
Averages for the 2004 tax year for zip code 74941, filed in 2005:
Average Adjusted Gross Income (AGI) in 2004: $25,477 (Individual Income Tax Returns)
Here:
$25,477
State:
$41,245
Salary/wage: $25,923 (reported on 79.5% of returns)
Here:
$25,923
State:
$35,318
(% of AGI for various income ranges: 122.9% for AGIs below $10k, 76.5% for AGIs $10k-25k, 86.5% for AGIs $25k-50k, 86.4% for AGIs $50k-75k, 45.7% for AGIs $75k-100k)
Taxable interest for individuals: $1,054 (reported on 26.4% of returns)
This zip code:
$1,054
Oklahoma:
$1,745
(% of AGI for various income ranges: 1.4% for AGIs below $10k, 1.8% for AGIs $10k-25k, 1.1% for AGIs $25k-50k, 0.9% for AGIs $50k-75k)
Taxable dividends: $765 (reported on 9.3% of returns)
Here:
$765
State:
$2,920
(% of AGI for various income ranges: 0.3% for AGIs below $10k, 0.8% for AGIs $10k-25k, 0.1% for AGIs $25k-50k, 0.2% for AGIs $50k-75k)
Net capital gain/loss: +$2,608 (reported on 11.1% of returns)
Here:
+$2,608
State:
+$10,653
(% of AGI for various income ranges: 2.1% for AGIs below $10k, 0.9% for AGIs $10k-25k, 1.5% for AGIs $25k-50k, 1.3% for AGIs $50k-75k)
Profit/loss from business: +$6,220 (reported on 21.9% of returns)
Here:
+$6,220
State:
+$8,532
(% of AGI for various income ranges: 40.7% for AGIs below $10k, 6.7% for AGIs $10k-25k, 4.4% for AGIs $25k-50k, 2.9% for AGIs $50k-75k)
IRA payment deduction: $3,846 (reported on 1.4% of returns)
74941:
$3,846
Oklahoma:
$3,127
Total itemized deductions: $13,064 (27% of AGI, reported on 13.7% of returns)
Here:
$13,064
State:
$17,093
Here:
26.6% of AGI
State:
20.5% of AGI
(% of AGI for various income ranges: 5.0% for AGIs $10k-25k, 6.8% for AGIs $25k-50k, 10.3% for AGIs $50k-75k, 6.5% for AGIs $75k-100k)
Charity contributions deductions: $3,125 (6% of AGI, reported on 10.5% of returns)
Here:
$3,125
State:
$4,240
Here:
6.3% of AGI
State:
4.8% of AGI
Total tax: $2,848 (reported on 64.2% of returns)
74941:
$2,848
State:
$6,542
(% of AGI for various income ranges: 7.5% for AGIs below $10k, 3.4% for AGIs $10k-25k, 5.3% for AGIs $25k-50k, 8.0% for AGIs $50k-75k, 17.9% for AGIs $75k-100k)
Earned income credit: $1,869 (reported on 31.8% of returns)
Here:
$1,869
State:
$1,830
Percentage of individuals using paid preparers for their 2004 taxes: 84.0%
Here:
84%
State:
63%
(% for various income ranges: 77.8% for AGIs below $10k, 83.3% for AGIs $10k-25k, 89.1% for AGIs $25k-50k, 88.9% for AGIs $50k-75k, 87.0% for AGIs $75k-100k)
Household received Food Stamps/SNAP in the past 12 months: 250 Household did not receive Food Stamps/SNAP in the past 12 months: 694
Women who had a birth in the past 12 months: 21 (18 now married, 2 unmarried) Women who did not have a birth in the past 12 months: 549 (279 now married, 269 unmarried)
Housing units in zip code 74941 with a mortgage: 238 Median monthly owner costs for units with a mortgage: $1,106 Median monthly owner costs for units without a mortgage: $422
Residents with income below the poverty level in 2022:
This zip code:
24.7%
Whole state:
15.7%
Residents with income below 50% of the poverty level in 2022:
This zip code:
13.5%
Whole state:
8.3%
Median number of rooms in houses and condos:
Here:
5.5
State:
6.1
Median number of rooms in apartments:
Here:
5.0
State:
4.5
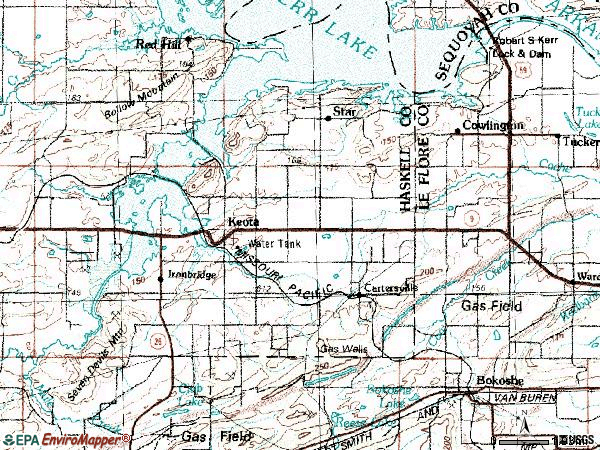
Notable locations in this zip code not listed on our city pages
Churches in zip code 74941 include: Bellow Mountain Church (A), Center Point Church (B), Rock Ford Church (C), Lone Elm Church (D), Mount Olive Church (E). Display/hide their locations on the map
Cemeteries: Cache Cemetery (1), Star Cemetery (2), Iron Bridge Cemetery (3), Keota Cemetery (4), Little Sans Bois Cemetery (5), Cowlington Cemetery (6), Short Mountain Cemetery (7). Display/hide their locations on the map
Streams, rivers, and creeks: Pheasant Creek (A), Otter Creek (B), McCann Creek (C), Little Sans Bois Creek (D), Elm Branch (E). Display/hide their locations on the map
In group quarters: 1 (-1 institutionalized population)
Size of family households: 289 2-persons, 171 3-persons, 104 4-persons, 78 5-persons, 30 6-persons, 35 7-or-more-persons
Size of nonfamily households: 184 1-person, 33 2-persons
375 married couples with children.
171 single-parent households (83 men, 88 women).
95.4% of residents of 74941 zip code speak English at home.
2.2% of residents speak Spanish at home (84% very well, 11% well, 5% not well).
1.9% of residents speak Asian or Pacific Island language at home (100% well).
0.3% of residents speak other language at home (100% very well).
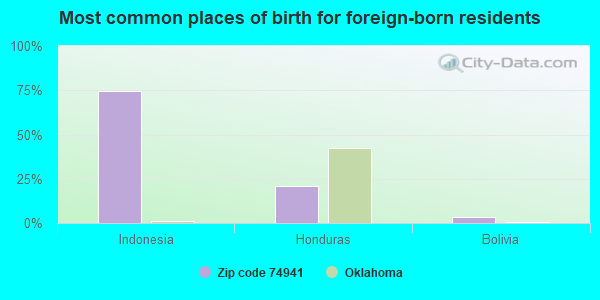
Foreign born population: 63 (2.4%) (96.9% of them are naturalized citizens)
This zip code:
2.4%
Whole state:
6.0%
75%Indonesia
21%Honduras
3%Bolivia
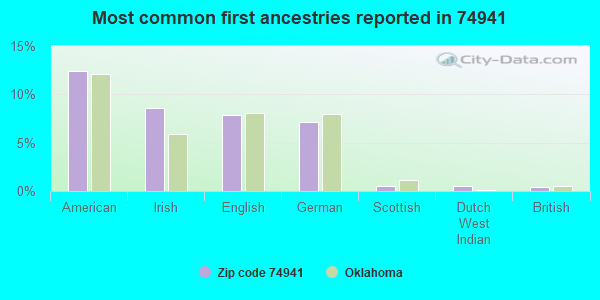
12%American
9%Irish
8%English
7%German
1%Scottish
1%Dutch West Indian
0%British
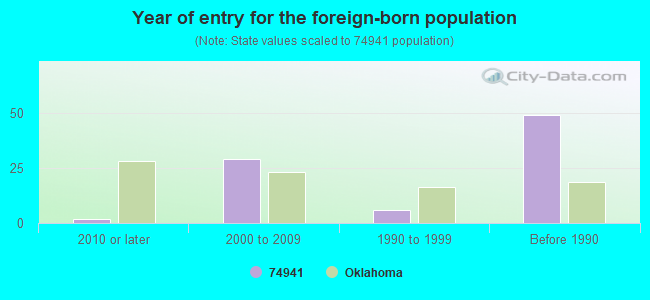
Year of entry for the foreign-born population
22010 or later
292000 to 2009
61990 to 1999
49Before 1990
Housing units lacking complete plumbing facilities: 4.9% Housing units lacking complete kitchen facilities: 5.6%
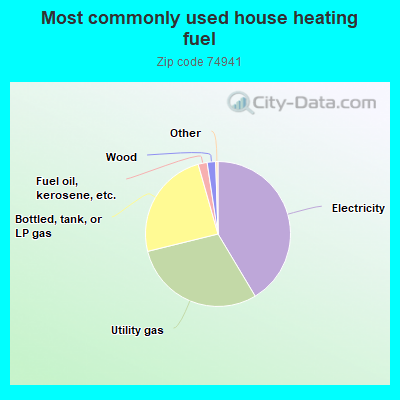
41.5%Electricity
29.8%Utility gas
24.5%Bottled, tank, or LP gas
2.0%Fuel oil, kerosene, etc.
1.9%Wood
Population in 1990: 1,878. Population change in the 1990s: +548 (+29.2%).
Place of birth for U.S.-born residents:
This state: 1,487
Northeast: 26
Midwest: 111
South: 795
West: 165
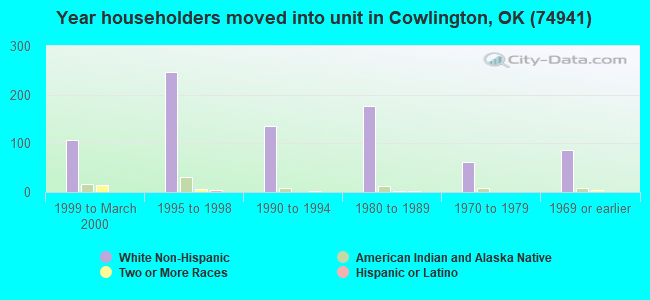
63% of the 74941 zip code residents lived in the same house 5 years ago. Out of people who lived in different houses, 53% lived in this county. Out of people who lived in different counties, 50% lived in Oklahoma.
94% of the 74941 zip code residents lived in the same house 1 year ago. Out of people who lived in different houses, 62% moved from this county. Out of people who lived in different houses, 40% moved from different county within same state.
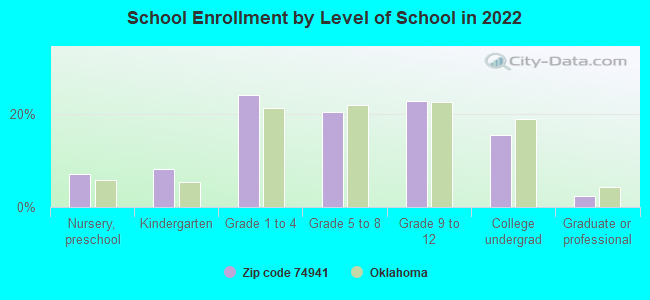
Private vs. public school enrollment:
Students in private schools in grades 1 to 8 (elementary and middle school): 44
Here:
17.1%
Oklahoma:
11.7%
Students in private schools in grades 9 to 12 (high school): 9
Here:
7.5%
Oklahoma:
11.7%
Students in private undergraduate colleges: 11
Here:
13.0%
Oklahoma:
19.3%
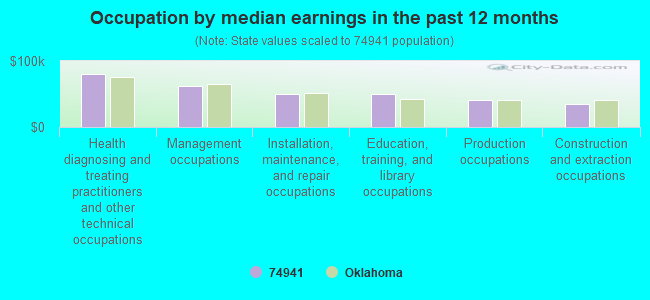
Occupation by median earnings in the past 12 months ($)
80,102Health diagnosing and treating practitioners and other technical occupations
61,823Management occupations
50,402Installation, maintenance, and repair occupations
50,099Education, training, and library occupations
40,940Production occupations
34,213Construction and extraction occupations
Companies with federal contracts located in this zip code:
QUALITY HEATING AND AIR, INC (RT 3 BOX 315 in KEOTA, OK; small business) : $20,974 in 3 contractsfrom 2003 to 2004
$9,000 with U.S. Army Corps of Engineers - civil program financing only for Construction of Structures and Facilities -- Other Administrative Facilities and Service Buildings. Signed on 2003-02-19. Completion date: 2003-02-10.
$5,987 with Army for Air Conditioning Equipment. Signed on 2004-05-21. Completion date: 2004-06-03.
$5,987 with U.S. Army Corps of Engineers - civil program financing only for Air Conditioning Equipment. Signed on 2004-05-21. Completion date: 2004-06-03.
Top industries in this zip code by the number of employees in 2005:
Arts, Entertainment, and Recreation: Other Spectator Sports (10-19 employees: 1 establishment, 5-9 employees: 1 establishment, 1-4 employees: 3 establishments)
Construction: Commercial and Institutional Building Construction (5-9: 1)
Construction: Plumbing, Heating, and Air-Conditioning Contractors (5-9: 1)
Other Services (except Public Administration): Pet Care (except Veterinary) Services (1-4: 3)
Professional, Scientific, and Technical Services: Tax Preparation Services (1-4: 1)
Finance and Insurance: Insurance Agencies and Brokerages (1-4: 1)
Wholesale Trade: Petroleum and Petroleum Products Merchant Wholesalers (except Bulk Stations and Terminals) (1-4: 1)
Health Care and Social Assistance: Offices of Physical, Occupational and Speech Therapists, and Audiologists (1-4: 1)
Fatal accident statistics in 2014:
Fatal accident count: 2
Vehicles involved in fatal accidents: 3
Fatal accidents caused by drunken drivers: 0
Fatalities: 3
Persons involved in fatal accidents: 4
Pedestrians involved in fatal accidents: 0
Fatal accident statistics in 2011:
Fatal accident count: 1
Vehicles involved in fatal accidents: 1
Fatal accidents caused by drunken drivers: 1
Fatalities: 1
Persons involved in fatal accidents: 2
Pedestrians involved in fatal accidents: 0
Home Mortgage Disclosure Act Aggregated Statistics For Year 2009 (Based on 2 partial tracts)
A) FHA, FSA/RHS & VA Home Purchase Loans
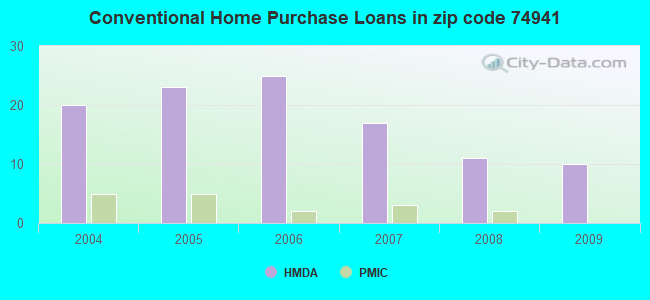
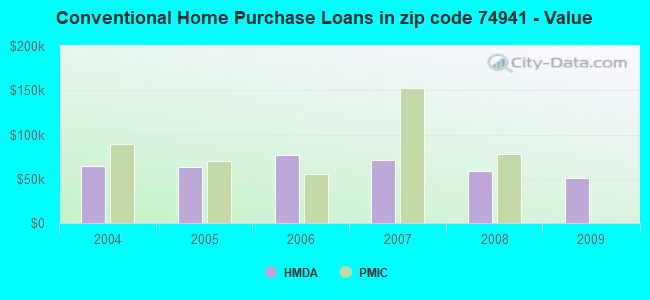
B) Conventional Home Purchase Loans
C) Refinancings
D) Home Improvement Loans
F) Non-occupant Loans on < 5 Family Dwellings (A B C & D)
G) Loans On Manufactured Home Dwelling (A B C & D)
Number
Average Value
Number
Average Value
Number
Average Value
Number
Average Value
Number
Average Value
Number
Average Value
LOANS ORIGINATED
11
$95,542
10
$51,025
23
$85,396
4
$16,105
5
$33,262
7
$34,634
APPLICATIONS APPROVED, NOT ACCEPTED
0
$0
4
$49,775
1
$37,090
0
$0
0
$0
2
$48,020
APPLICATIONS DENIED
1
$106,970
7
$51,644
12
$88,718
4
$17,080
1
$42,550
7
$45,789
APPLICATIONS WITHDRAWN
1
$133,910
2
$83,545
10
$106,501
0
$0
0
$0
0
$0
FILES CLOSED FOR INCOMPLETENESS
0
$0
0
$0
1
$171,390
0
$0
0
$0
0
$0
Aggregated Statistics For Year 2008 (Based on 2 partial tracts)
A) FHA, FSA/RHS & VA Home Purchase Loans
B) Conventional Home Purchase Loans
C) Refinancings
D) Home Improvement Loans
F) Non-occupant Loans on < 5 Family Dwellings (A B C & D)
G) Loans On Manufactured Home Dwelling (A B C & D)
Number
Average Value
Number
Average Value
Number
Average Value
Number
Average Value
Number
Average Value
Number
Average Value
LOANS ORIGINATED
12
$73,786
11
$58,915
22
$82,232
9
$24,682
5
$40,056
7
$39,989
APPLICATIONS APPROVED, NOT ACCEPTED
1
$48,410
2
$65,780
2
$86,865
1
$83,550
0
$0
3
$56,737
APPLICATIONS DENIED
2
$80,620
15
$50,778
20
$98,459
5
$26,860
2
$41,970
14
$50,278
APPLICATIONS WITHDRAWN
2
$92,330
2
$88,035
10
$112,748
1
$24,200
0
$0
1
$73,790
FILES CLOSED FOR INCOMPLETENESS
0
$0
0
$0
2
$80,815
0
$0
1
$34,360
0
$0
Aggregated Statistics For Year 2007 (Based on 2 partial tracts)
A) FHA, FSA/RHS & VA Home Purchase Loans
B) Conventional Home Purchase Loans
C) Refinancings
D) Home Improvement Loans
F) Non-occupant Loans on < 5 Family Dwellings (A B C & D)
G) Loans On Manufactured Home Dwelling (A B C & D)
Number
Average Value
Number
Average Value
Number
Average Value
Number
Average Value
Number
Average Value
Number
Average Value
LOANS ORIGINATED
5
$82,764
17
$71,696
30
$108,713
13
$26,698
5
$95,882
11
$45,251
APPLICATIONS APPROVED, NOT ACCEPTED
1
$70,270
7
$64,193
2
$143,080
1
$25,770
0
$0
7
$62,520
APPLICATIONS DENIED
2
$154,795
20
$57,350
21
$88,435
8
$35,770
3
$69,750
14
$46,681
APPLICATIONS WITHDRAWN
0
$0
2
$40,990
13
$69,221
3
$49,190
2
$33,185
1
$50,750
FILES CLOSED FOR INCOMPLETENESS
0
$0
0
$0
2
$142,105
0
$0
0
$0
0
$0
Aggregated Statistics For Year 2006 (Based on 2 partial tracts)
A) FHA, FSA/RHS & VA Home Purchase Loans
B) Conventional Home Purchase Loans
C) Refinancings
D) Home Improvement Loans
F) Non-occupant Loans on < 5 Family Dwellings (A B C & D)
G) Loans On Manufactured Home Dwelling (A B C & D)
Number
Average Value
Number
Average Value
Number
Average Value
Number
Average Value
Number
Average Value
Number
Average Value
LOANS ORIGINATED
6
$83,937
25
$77,377
27
$70,908
12
$32,436
6
$72,028
6
$49,190
APPLICATIONS APPROVED, NOT ACCEPTED
0
$0
10
$47,707
4
$67,540
0
$0
0
$0
9
$36,524
APPLICATIONS DENIED
0
$0
21
$63,895
31
$85,775
12
$33,802
1
$33,180
14
$51,394
APPLICATIONS WITHDRAWN
1
$129,220
2
$92,525
16
$79,788
3
$42,943
0
$0
1
$70,270
FILES CLOSED FOR INCOMPLETENESS
0
$0
1
$101,500
2
$105,410
0
$0
0
$0
0
$0
Aggregated Statistics For Year 2005 (Based on 2 partial tracts)
A) FHA, FSA/RHS & VA Home Purchase Loans
B) Conventional Home Purchase Loans
C) Refinancings
D) Home Improvement Loans
F) Non-occupant Loans on < 5 Family Dwellings (A B C & D)
G) Loans On Manufactured Home Dwelling (A B C & D)
Number
Average Value
Number
Average Value
Number
Average Value
Number
Average Value
Number
Average Value
Number
Average Value
LOANS ORIGINATED
7
$72,001
23
$63,211
35
$69,056
12
$31,850
7
$36,084
14
$51,394
APPLICATIONS APPROVED, NOT ACCEPTED
1
$61,290
7
$57,834
4
$53,680
2
$16,395
0
$0
5
$55,436
APPLICATIONS DENIED
2
$47,045
25
$56,936
32
$68,832
9
$35,700
0
$0
19
$45,061
APPLICATIONS WITHDRAWN
0
$0
7
$69,826
25
$89,854
2
$38,455
1
$36,700
2
$54,265
FILES CLOSED FOR INCOMPLETENESS
0
$0
2
$80,030
2
$80,620
0
$0
0
$0
0
$0
Aggregated Statistics For Year 2004 (Based on 2 partial tracts)
A) FHA, FSA/RHS & VA Home Purchase Loans
B) Conventional Home Purchase Loans
C) Refinancings
D) Home Improvement Loans
F) Non-occupant Loans on < 5 Family Dwellings (A B C & D)
G) Loans On Manufactured Home Dwelling (A B C & D)
Detailed PMIC statistics for the following Tracts:0402.98
2005 - 2018 National Fire Incident Reporting System (NFIRS) incidents
According to the data from the years 2005 - 2018 the average number of fire incidents per year is 24. The highest number of fire incidents - 84 took place in 2011, and the least - 0 in 2013. The data has a decreasing trend.
When looking into fire subcategories, the most reports belonged to: Outside Fires (75.1%), and Structure Fires (17.4%).
Fire incident types reported to NFIRS in Zip Code 74941


 Nearest zip codes: 74930, 74944, 74936, 74956, 74955, 74951.


 : $20,974 in 3 contracts from 2003 to 2004
 According to the data from the years 2005 - 2018 the average number of fire incidents per year is 24. The highest number of fire incidents - 84 took place in 2011, and the least - 0 in 2013. The data has a decreasing trend.
 When looking into fire subcategories, the most reports belonged to: Outside Fires (75.1%), and Structure Fires (17.4%).