Estimated zip code population in 2022: 3,384 Zip code population in 2010: 3,821 Zip code population in 2000: 3,925
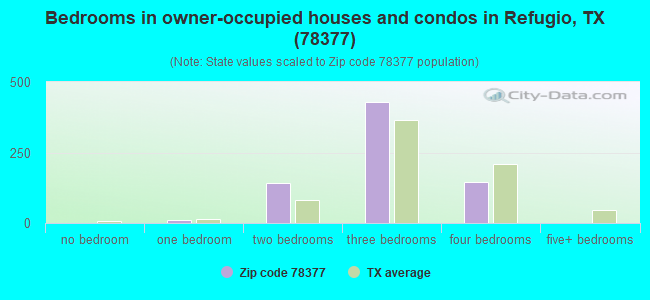
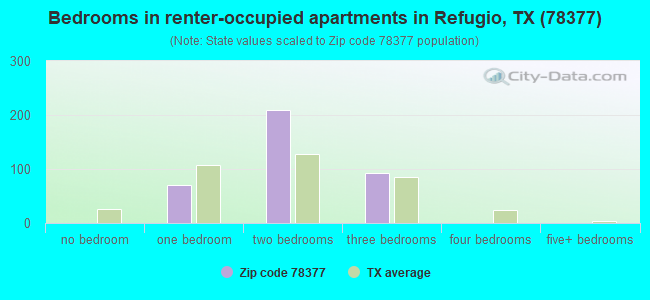
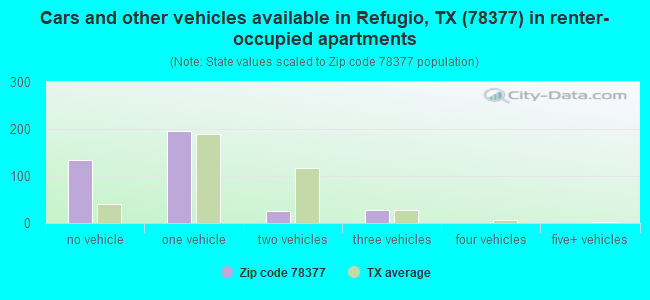
Houses and condos: 1,619 Renter-occupied apartments: 379
% of renters here:
34%
State:
38%
March 2022 cost of living index in zip code 78377: 76.0 (low, U.S. average is 100)
Land area: 458.8 sq. mi. Water area: 18.0 sq. mi.
Population density: 7 people per square mile
(very low).
OSM Map
General Map
Google Map
MSN Map
OSM Map
General Map
Google Map
MSN Map
OSM Map
General Map
Google Map
MSN Map
OSM Map
General Map
Google Map
MSN Map
Please wait while loading the map...
Real estate property taxes paid for housing units in 2022:
This zip code:
1.4% ($1,540)
Texas:
1.5% ($4,050)
Median real estate property taxes paid for housing units with mortgages in 2022: $1,891 (1.7%) Median real estate property taxes paid for housing units with no mortgage in 2022: $1,039 (1.0%)
Business Search- 14 Million verified businesses
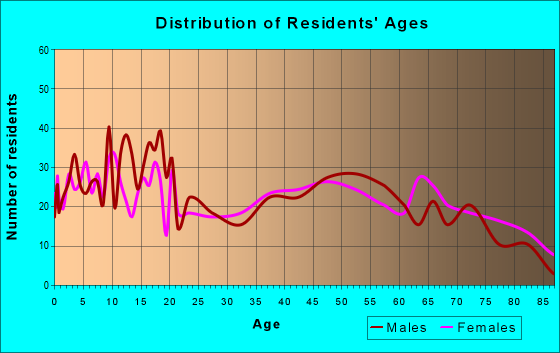
Males: 1,607
(47.5%)
Females: 1,777
(52.5%)
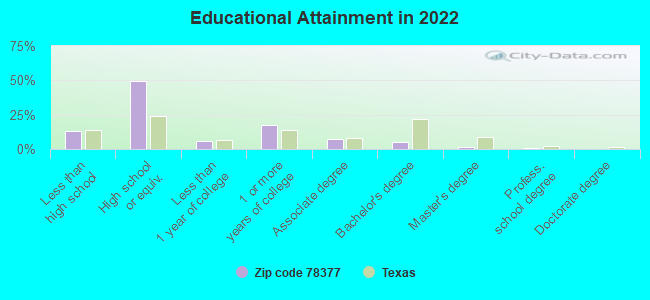
For population 25 years and over in 78377:
High school or higher: 84.7%
Bachelor's degree or higher: 7.0%
Graduate or professional degree: 2.1%
Unemployed: 2.0%
Mean travel time to work (commute): 23.4 minutes
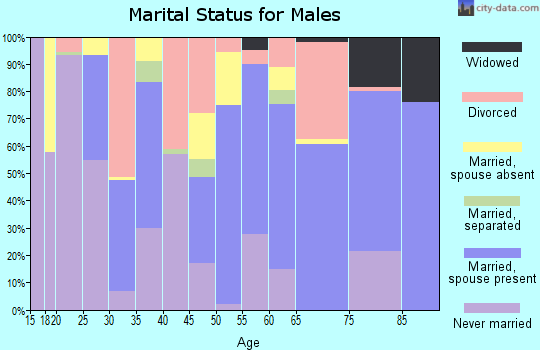
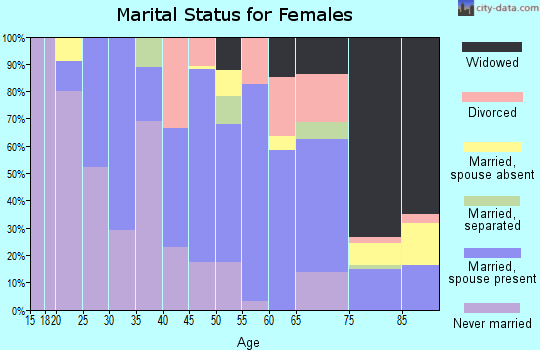
For population 15 years and over in 78377:
Never married: 36.4%
Now married: 36.2%
Separated: 5.0%
Widowed: 10.1%
Divorced: 12.4%
Zip code 78377 compared to state average:
Median household income below state average.
Median house value significantly below state average.
Unemployed percentage below state average.
Median age above state average.
Foreign-born population percentage significantly below state average.
Length of stay since moving in significantly above state average.
House age above state average.
Number of college students significantly below state average.
Percentage of population with a bachelor's degree or higher significantly below state average.
Averages for the 2020 tax year for zip code 78377, filed in 2021:
Average Adjusted Gross Income (AGI) in 2020: $51,218 (Individual Income Tax Returns)
Here:
$51,218
State:
$77,054
Salary/wage: $46,465 (reported on 83.6% of returns)
Here:
$46,465
State:
$62,766
(% of AGI for various income ranges: 1180.4% for AGIs below $25k, 3480.0% for AGIs $25k-50k, 6938.1% for AGIs $50k-75k, 10062.2% for AGIs $75k-100k, 18575.0% for AGIs $100k-200k)
Taxable interest for individuals: $911 (reported on 22.0% of returns)
This zip code:
$911
Texas:
$2,665
(% of AGI for various income ranges: 2.7% for AGIs below $25k, 26.6% for AGIs $25k-50k, 19.4% for AGIs $50k-75k, 54.4% for AGIs $75k-100k, 52.0% for AGIs $100k-200k)
Ordinary dividends: $7,800 (reported on 10.7% of returns)
Here:
$7,800
State:
$10,044
(% of AGI for various income ranges: 7.7% for AGIs below $25k, 20.3% for AGIs $25k-50k, 173.8% for AGIs $50k-75k, 946.0% for AGIs $100k-200k)
Net capital gain/loss in AGI: +$8,120 (reported on 9.4% of returns)
Here:
+$8,120
State:
+$39,590
(% of AGI for various income ranges: 2.1% for AGIs below $25k, 6.9% for AGIs $25k-50k, 112.5% for AGIs $50k-75k, 1006.0% for AGIs $100k-200k)
Profit/loss from business: +$2,675 (reported on 15.1% of returns)
Here:
+$2,675
State:
+$10,888
(% of AGI for various income ranges: 57.5% for AGIs below $25k, 47.5% for AGIs $50k-75k, 60.0% for AGIs $75k-100k, 258.0% for AGIs $100k-200k)
Taxable individual retirement arrangement distribution: $19,089 (reported on 5.7% of returns)
78377:
$19,089
Texas:
$24,740
(% of AGI for various income ranges: 146.2% for AGIs $25k-50k, 263.8% for AGIs $50k-75k, 920.0% for AGIs $75k-100k)
Total itemized deductions: $38,500 (reported on 5.7% of returns)
Here:
$38,500
State:
$40,428
(% of AGI for various income ranges: 213.4% for AGIs $25k-50k, 559.4% for AGIs $50k-75k, 1887.0% for AGIs $100k-200k)
Charity contributions: $9,483 (reported on 3.8% of returns)
Here:
$9,483
State:
$18,201
(% of AGI for various income ranges: 70.3% for AGIs $25k-50k, 344.0% for AGIs $100k-200k)
Taxes paid: $7,788 (reported on 5.0% of returns)
78377:
$7,788
State:
$7,821
(% of AGI for various income ranges: 30.2% for AGIs below $25k, 108.1% for AGIs $50k-75k, 305.0% for AGIs $100k-200k)
Earned income credit: $2,772 (reported on 24.5% of returns)
Here:
$2,772
State:
$2,584
(% of AGI for various income ranges: 154.6% for AGIs below $25k, 105.9% for AGIs $25k-50k)
Percentage of individuals using paid preparers for their 2020 taxes: 89.3%
Here:
89%
State:
92%
(% for various income ranges: 88.7% for AGIs below $25k, 90.0% for AGIs $25k-50k, 87.5% for AGIs $50k-75k, 92.3% for AGIs $75k-100k, 88.2% for AGIs $100k-200k, 100.0% for AGIs over 200k)
Averages for the 2012 tax year for zip code 78377, filed in 2013:
Average Adjusted Gross Income (AGI) in 2012: $58,440 (Individual Income Tax Returns)
Here:
$58,440
State:
$65,384
Salary/wage: $45,700 (reported on 85.5% of returns)
Here:
$45,700
State:
$52,524
(% of AGI for various income ranges: 82.6% for AGIs below $25k, 78.5% for AGIs $25k-50k, 78.0% for AGIs $50k-75k, 82.9% for AGIs $75k-100k, 80.2% for AGIs $100k-200k, 32.2% for AGIs over 200k)
Taxable interest for individuals: $1,071 (reported on 24.3% of returns)
This zip code:
$1,071
Texas:
$2,372
(% of AGI for various income ranges: 0.5% for AGIs below $25k, 0.4% for AGIs $25k-50k, 0.7% for AGIs $50k-75k, 0.6% for AGIs $75k-100k, 0.3% for AGIs $100k-200k, 0.4% for AGIs over 200k)
Ordinary dividends: $8,980 (reported on 11.6% of returns)
Here:
$8,980
State:
$9,721
(% of AGI for various income ranges: 1.1% for AGIs below $25k, 0.7% for AGIs $25k-50k, 1.5% for AGIs $50k-75k, 1.3% for AGIs $100k-200k, 3.8% for AGIs over 200k)
Net capital gain/loss in AGI: +$24,153 (reported on 11.0% of returns)
Here:
+$24,153
State:
+$35,319
(% of AGI for various income ranges: 0.8% for AGIs $25k-50k, 1.5% for AGIs $50k-75k, 0.9% for AGIs $100k-200k, 14.5% for AGIs over 200k)
Profit/loss from business: +$11,683 (reported on 13.9% of returns)
Here:
+$11,683
State:
+$13,732
(% of AGI for various income ranges: 5.8% for AGIs below $25k, 1.9% for AGIs $25k-50k, 1.5% for AGIs $50k-75k, 3.6% for AGIs $75k-100k, 5.8% for AGIs $100k-200k)
Taxable individual retirement arrangement distribution: $15,131 (reported on 7.5% of returns)
78377:
$15,131
Texas:
$19,511
(% of AGI for various income ranges: 2.0% for AGIs below $25k, 4.0% for AGIs $25k-50k, 3.7% for AGIs $50k-75k, 2.7% for AGIs $100k-200k)
Total itemized deductions: $23,238 (13% of AGI, reported on 12.1% of returns)
Here:
$23,238
State:
$24,724
Here:
13.5% of AGI
State:
15.9% of AGI
(% of AGI for various income ranges: 6.0% for AGIs $25k-50k, 5.7% for AGIs $50k-75k, 7.1% for AGIs $75k-100k, 5.7% for AGIs $100k-200k, 3.7% for AGIs over 200k)
Charity contributions: $6,581 (reported on 9.2% of returns)
Here:
$6,581
State:
$6,808
(% of AGI for various income ranges: 0.7% for AGIs $25k-50k, 1.4% for AGIs $50k-75k, 1.1% for AGIs $100k-200k, 1.7% for AGIs over 200k)
Taxes paid: $4,742 (reported on 11.0% of returns)
78377:
$4,742
State:
$6,921
(% of AGI for various income ranges: 0.7% for AGIs $25k-50k, 1.0% for AGIs $50k-75k, 1.1% for AGIs $75k-100k, 1.2% for AGIs $100k-200k, 0.8% for AGIs over 200k)
Earned income credit: $2,426 (reported on 24.9% of returns)
Here:
$2,426
State:
$2,570
(% of AGI for various income ranges: 9.5% for AGIs below $25k, 1.3% for AGIs $25k-50k)
Percentage of individuals using paid preparers for their 2012 taxes: 57.8%
Here:
58%
State:
51%
(% for various income ranges: 53.4% for AGIs below $25k, 56.1% for AGIs $25k-50k, 60.9% for AGIs $50k-75k, 58.3% for AGIs $75k-100k, 68.4% for AGIs $100k-200k, 80.0% for AGIs over 200k)
Averages for the 2004 tax year for zip code 78377, filed in 2005:
Average Adjusted Gross Income (AGI) in 2004: $36,886 (Individual Income Tax Returns)
Here:
$36,886
State:
$47,881
Salary/wage: $29,781 (reported on 84.0% of returns)
Here:
$29,781
State:
$41,947
(% of AGI for various income ranges: 101.2% for AGIs below $10k, 81.3% for AGIs $10k-25k, 83.2% for AGIs $25k-50k, 74.5% for AGIs $50k-75k, 71.7% for AGIs $75k-100k, 38.3% for AGIs over 100k)
Taxable interest for individuals: $1,775 (reported on 31.7% of returns)
This zip code:
$1,775
Texas:
$2,255
(% of AGI for various income ranges: 3.5% for AGIs below $10k, 2.0% for AGIs $10k-25k, 1.1% for AGIs $25k-50k, 1.3% for AGIs $50k-75k, 1.4% for AGIs $75k-100k, 1.8% for AGIs over 100k)
Taxable dividends: $6,942 (reported on 15.7% of returns)
Here:
$6,942
State:
$4,261
(% of AGI for various income ranges: 2.2% for AGIs below $10k, 1.8% for AGIs $10k-25k, 1.2% for AGIs $25k-50k, 1.1% for AGIs $50k-75k, 2.8% for AGIs $75k-100k, 6.5% for AGIs over 100k)
Net capital gain/loss: +$3,860 (reported on 10.9% of returns)
Here:
+$3,860
State:
+$16,110
(% of AGI for various income ranges: -1.7% for AGIs below $10k, -0.1% for AGIs $10k-25k, 0.1% for AGIs $25k-50k, 0.6% for AGIs $50k-75k, 1.3% for AGIs $75k-100k, 3.2% for AGIs over 100k)
Profit/loss from business: +$9,479 (reported on 14.3% of returns)
Here:
+$9,479
State:
+$11,013
(% of AGI for various income ranges: 2.1% for AGIs below $10k, 3.2% for AGIs $10k-25k, 1.6% for AGIs $25k-50k, 2.5% for AGIs $50k-75k, -0.2% for AGIs $75k-100k, 8.6% for AGIs over 100k)
IRA payment deduction: $2,765 (reported on 1.0% of returns)
78377:
$2,765
Texas:
$3,120
Total itemized deductions: $16,830 (22% of AGI, reported on 10.4% of returns)
Here:
$16,830
State:
$19,631
Here:
21.6% of AGI
State:
18.9% of AGI
(% of AGI for various income ranges: 2.2% for AGIs $10k-25k, 4.4% for AGIs $25k-50k, 6.0% for AGIs $50k-75k, 7.5% for AGIs $75k-100k, 4.5% for AGIs over 100k)
Charity contributions deductions: $4,672 (6% of AGI, reported on 8.2% of returns)
Here:
$4,672
State:
$4,753
Here:
5.6% of AGI
State:
4.2% of AGI
(% of AGI for various income ranges: 1.0% for AGIs $25k-50k, 0.9% for AGIs $50k-75k, 1.8% for AGIs $75k-100k, 1.4% for AGIs over 100k)
Total tax: $6,100 (reported on 65.6% of returns)
78377:
$6,100
State:
$9,058
(% of AGI for various income ranges: 2.2% for AGIs below $10k, 3.1% for AGIs $10k-25k, 6.6% for AGIs $25k-50k, 8.9% for AGIs $50k-75k, 10.7% for AGIs $75k-100k, 20.6% for AGIs over 100k)
Earned income credit: $1,995 (reported on 27.0% of returns)
Here:
$1,995
State:
$2,024
Percentage of individuals using paid preparers for their 2004 taxes: 63.8%
Here:
64%
State:
57%
(% for various income ranges: 56.5% for AGIs below $10k, 66.1% for AGIs $10k-25k, 61.0% for AGIs $25k-50k, 65.5% for AGIs $50k-75k, 76.2% for AGIs $75k-100k, 74.2% for AGIs over 100k)
Household received Food Stamps/SNAP in the past 12 months: 275 Household did not receive Food Stamps/SNAP in the past 12 months: 839
Women who had a birth in the past 12 months: 70 (0 now married, 67 unmarried) Women who did not have a birth in the past 12 months: 658 (287 now married, 370 unmarried)
Housing units in zip code 78377 with a mortgage: 275 (11 second mortgage) Median monthly owner costs for units with a mortgage: $1,210 Median monthly owner costs for units without a mortgage: $474
Residents with income below the poverty level in 2022:
This zip code:
27.2%
Whole state:
14.0%
Residents with income below 50% of the poverty level in 2022:
This zip code:
9.9%
Whole state:
7.4%
Median number of rooms in houses and condos:
Here:
5.9
State:
6.3
Median number of rooms in apartments:
Here:
4.2
State:
4.0
Notable locations in this zip code not listed on our city pages
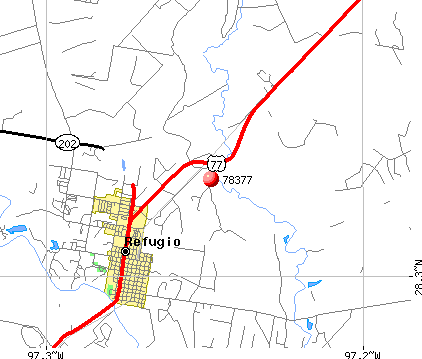
Notable locations in zip code 78377: Lambert Ranch (A), Oak School (B), Welder Ranch (C), Refugio Fire Department (D), Refugio Volunteer Fire Department (E), Refugio County Sheriff's Office (F), Refugio Police Department (G), Refugio County Museum (H). Display/hide their locations on the map
Churches in zip code 78377 include: Saint Dennis Church (A), Presbyterian Church (B), Trinity Lutheran Church (C), Episcopal Church of the Ascension (D), Church of Christ (E), Union Baptist Church (F), Mount Pilgrim Baptist Church (G), First Baptist Church (H), First Temple Assembly of God Church (I). Display/hide their locations on the map
Cemeteries: Nicholas Fagan Memorial Cemetery (1), Mount Calvary Cemetery (2), Heard Cemetery (3), O'Connor Cemetery (4), Williams Cemetery (5), Holy Cross Cemetery (6). Display/hide their locations on the map
Lakes, reservoirs, and swamps: Willow Lake (A), Twin Mott Lake (B), Duck Lake (C), Horseshoe Lake (D), North Saint Nicholas Lake (E), Mustang Lake (F), Sharps Lake (G), Salt Pond (H). Display/hide their locations on the map
Streams, rivers, and creeks: Blanco Creek (A), Willow Creek (B), Spring Creek (C), Mission River (D), Melon Creek (E), Medio Creek (F), Dog Branch (G), Alameda Creek (H). Display/hide their locations on the map
In group quarters: 157 (-1 institutionalized population)
Size of family households: 294 2-persons, 219 3-persons, 69 4-persons, 57 5-persons, 50 6-persons, 11 7-or-more-persons
Size of nonfamily households: 348 1-person, 49 2-persons, 11 3-persons
261 married couples with children.
430 single-parent households (49 men, 381 women).
71.1% of residents of 78377 zip code speak English at home.
28.4% of residents speak Spanish at home (85% very well, 10% well, 5% not well).
0.7% of residents speak other Indo-European language at home (76% well, 24% not well).
0.3% of residents speak other language at home (100% very well).
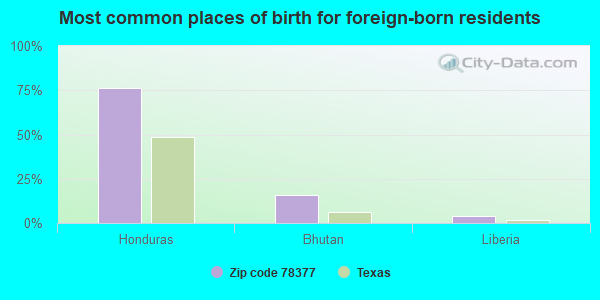
Foreign born population: 102 (3.0%) (65.3% of them are naturalized citizens)
This zip code:
3.0%
Whole state:
17.2%
76%Honduras
16%Bhutan
4%Liberia
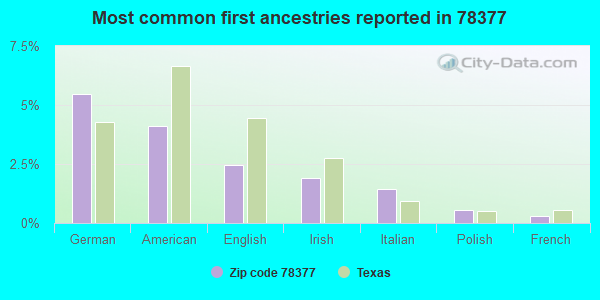
5%German
4%American
2%English
2%Irish
1%Italian
1%Polish
0%French
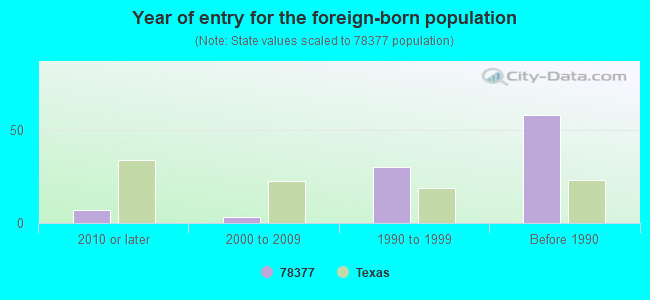
Year of entry for the foreign-born population
72010 or later
32000 to 2009
301990 to 1999
58Before 1990
Facilities with environmental interests located in this zip code:
AMERICAN PETROFINA PIPE LINE COMPANY (OFF HIGHWAY 77, 2 MI. S. OF RE in REFUGIO, TX)
AIR MINOR (AIRS/AFS) Business SIC classification: PETROLEUM BULK STATIONS AND TERMINALS
Housing units lacking complete plumbing facilities: 16.1% Housing units lacking complete kitchen facilities: 12.4%
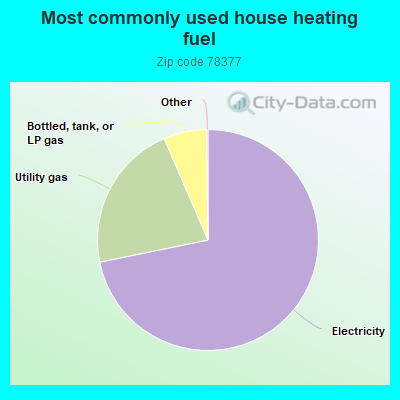
72.0%Electricity
21.8%Utility gas
6.3%Bottled, tank, or LP gas
Population in 1990: 4,004.
Place of birth for U.S.-born residents:
This state: 2,840
Northeast: 23
Midwest: 109
South: 236
West: 35
63% of the 78377 zip code residents lived in the same house 5 years ago. Out of people who lived in different houses, 67% lived in this county. Out of people who lived in different counties, 50% lived in Texas.
87% of the 78377 zip code residents lived in the same house 1 year ago. Out of people who lived in different houses, 72% moved from this county. Out of people who lived in different houses, 23% moved from different county within same state.
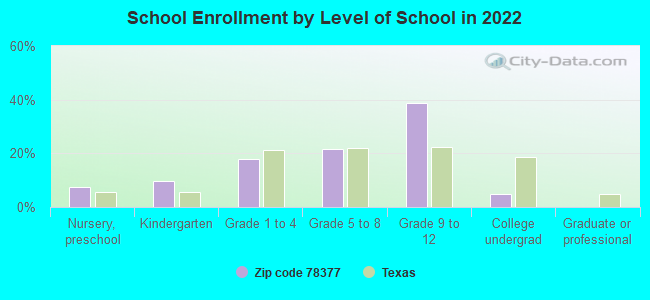
Private vs. public school enrollment:
Students in private schools in grades 1 to 8 (elementary and middle school):
Here:
0.0%
Texas:
8.8%
Students in private schools in grades 9 to 12 (high school): 35
Here:
10.6%
Texas:
8.0%
Students in private undergraduate colleges:
Here:
2.4%
Texas:
16.2%
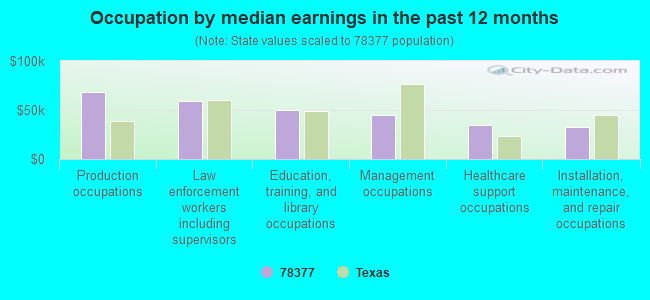
Occupation by median earnings in the past 12 months ($)
68,849Production occupations
59,361Law enforcement workers including supervisors
49,949Education, training, and library occupations
45,310Management occupations
34,790Healthcare support occupations
33,108Installation, maintenance, and repair occupations
Top industries in this zip code by the number of employees in 2005:
Health Care and Social Assistance: General Medical and Surgical Hospitals (100-249 employees: 1 establishment)
Mining: Support Activities for Oil and Gas Operations (20-49: 3, 10-19: 1, 5-9: 2, 1-4: 3)
Mining: Crude Petroleum and Natural Gas Extraction (20-49: 2, 10-19: 1, 5-9: 1, 1-4: 3)
Health Care and Social Assistance: Nursing Care Facilities (20-49: 2, 10-19: 1)
Construction: Oil and Gas Pipeline and Related Structures Construction (20-49: 1)
People in group quarters in 2010:
104 people in nursing facilities/skilled-nursing facilities
25 people in local jails and other municipal confinement facilities
People in group quarters in 2000:
74 people in nursing homes
31 people in local jails and other confinement facilities (including police lockups)
Fatal accident statistics in 2014:
Fatal accident count: 6
Vehicles involved in fatal accidents: 10
Fatal accidents caused by drunken drivers: 1
Fatalities: 9
Persons involved in fatal accidents: 23
Pedestrians involved in fatal accidents: 0
Fatal accident statistics in 2013:
Fatal accident count: 4
Vehicles involved in fatal accidents: 8
Fatal accidents caused by drunken drivers: 1
Fatalities: 5
Persons involved in fatal accidents: 16
Pedestrians involved in fatal accidents: 0
2002 - 2018 National Fire Incident Reporting System (NFIRS) incidents
Based on the data from the years 2002 - 2018 the average number of fires per year is 34. The highest number of reported fire incidents - 71 took place in 2011, and the least - 3 in 2018. The data has a dropping trend.
When looking into fire subcategories, the most reports belonged to: Outside Fires (63.4%), and Mobile Property/Vehicle Fires (16.6%).
Fire incident types reported to NFIRS in Zip Code 78377
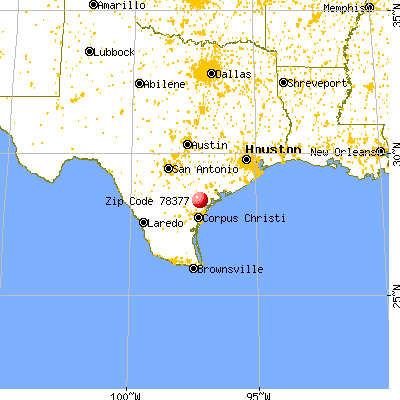


 Nearest zip codes: 78340, 78382, 77990, 77950, 77973, 78393.
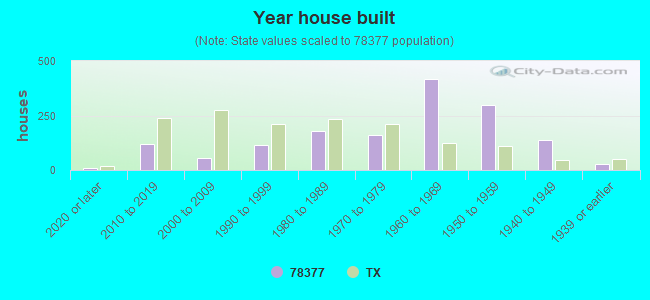


 Based on the data from the years 2002 - 2018 the average number of fires per year is 34. The highest number of reported fire incidents - 71 took place in 2011, and the least - 3 in 2018. The data has a dropping trend.
 When looking into fire subcategories, the most reports belonged to: Outside Fires (63.4%), and Mobile Property/Vehicle Fires (16.6%).