Estimated zip code population in 2022: 1,312 Zip code population in 2010: 1,788 Zip code population in 2000: 1,429
Houses and condos: 1,098 Renter-occupied apartments: 98
% of renters here:
18%
State:
38%
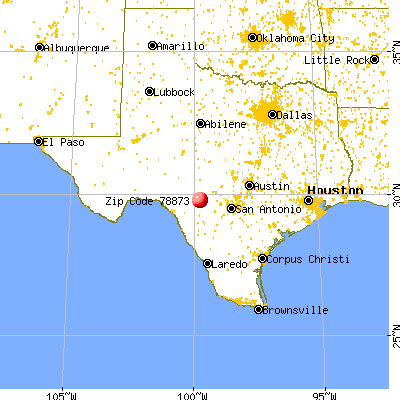
March 2022 cost of living index in zip code 78873: 81.5 (low, U.S. average is 100)
Land area: 227.3 sq. mi. Water area: 0.4 sq. mi.
Population density: 6 people per square mile
(very low).
OSM Map
General Map
Google Map
MSN Map
OSM Map
General Map
Google Map
MSN Map
OSM Map
General Map
Google Map
MSN Map
OSM Map
General Map
Google Map
MSN Map
Please wait while loading the map...
Real estate property taxes paid for housing units in 2022:
This zip code:
0.6% ($1,822)
Texas:
1.5% ($4,050)
Median real estate property taxes paid for housing units with mortgages in 2022: $4,347 (0.9%) Median real estate property taxes paid for housing units with no mortgage in 2022: $1,716 (0.6%)
Business Search- 14 Million verified businesses
Males: 679
(51.8%)
Females: 632
(48.2%)
For population 25 years and over in 78873:
High school or higher: 88.3%
Bachelor's degree or higher: 33.7%
Graduate or professional degree: 8.8%
Mean travel time to work (commute): 10.2 minutes
For population 15 years and over in 78873:
Never married: 22.0%
Now married: 58.2%
Separated: 0.0%
Widowed: 8.2%
Divorced: 11.6%
Zip code 78873 compared to state average:
Unemployed percentage significantly below state average.
Black race population percentage significantly below state average.
Median age significantly above state average.
Foreign-born population percentage significantly below state average.
Renting percentage below state average.
Length of stay since moving in significantly above state average.
Number of college students significantly below state average.
Averages for the 2020 tax year for zip code 78873, filed in 2021:
Average Adjusted Gross Income (AGI) in 2020: $61,771 (Individual Income Tax Returns)
Here:
$61,771
State:
$77,054
Salary/wage: $47,579 (reported on 64.0% of returns)
Here:
$47,579
State:
$62,766
(% of AGI for various income ranges: 1066.1% for AGIs below $25k, 3342.7% for AGIs $25k-50k, 5440.0% for AGIs $50k-75k, 7320.0% for AGIs $75k-100k, 14074.0% for AGIs $100k-200k)
Taxable interest for individuals: $2,336 (reported on 37.1% of returns)
This zip code:
$2,336
Texas:
$2,665
(% of AGI for various income ranges: 36.1% for AGIs below $25k, 57.3% for AGIs $25k-50k, 245.7% for AGIs $50k-75k, 76.0% for AGIs $75k-100k, 158.0% for AGIs $100k-200k)
Ordinary dividends: $9,839 (reported on 20.2% of returns)
Here:
$9,839
State:
$10,044
(% of AGI for various income ranges: 41.7% for AGIs below $25k, 82.7% for AGIs $25k-50k, 280.0% for AGIs $50k-75k, 220.0% for AGIs $75k-100k, 654.0% for AGIs $100k-200k)
Net capital gain/loss in AGI: +$14,394 (reported on 19.1% of returns)
Here:
+$14,394
State:
+$39,590
(% of AGI for various income ranges: 8.3% for AGIs below $25k, 46.0% for AGIs $25k-50k, 187.1% for AGIs $50k-75k, 268.0% for AGIs $75k-100k, 4188.0% for AGIs $100k-200k)
Profit/loss from business: +$12,579 (reported on 27.0% of returns)
Here:
+$12,579
State:
+$10,888
(% of AGI for various income ranges: 305.7% for AGIs below $25k, 208.7% for AGIs $25k-50k, 654.3% for AGIs $50k-75k, 820.0% for AGIs $75k-100k, 2270.0% for AGIs $100k-200k)
Taxable individual retirement arrangement distribution: $26,050 (reported on 11.2% of returns)
78873:
$26,050
Texas:
$24,740
(% of AGI for various income ranges: 115.2% for AGIs below $25k, 964.3% for AGIs $50k-75k, 3330.0% for AGIs $100k-200k)
Total itemized deductions: $25,017 (reported on 6.7% of returns)
Here:
$25,017
State:
$40,428
(% of AGI for various income ranges: 418.0% for AGIs $25k-50k, 1748.0% for AGIs $100k-200k)
Charity contributions: $9,800 (reported on 4.5% of returns)
Here:
$9,800
State:
$18,201
(% of AGI for various income ranges: 784.0% for AGIs $100k-200k)
Taxes paid: $5,683 (reported on 6.7% of returns)
78873:
$5,683
State:
$7,821
(% of AGI for various income ranges: 88.0% for AGIs $25k-50k, 418.0% for AGIs $100k-200k)
Earned income credit: $2,605 (reported on 21.3% of returns)
Here:
$2,605
State:
$2,584
(% of AGI for various income ranges: 156.5% for AGIs below $25k, 90.0% for AGIs $25k-50k)
Percentage of individuals using paid preparers for their 2020 taxes: 92.1%
Here:
92%
State:
92%
(% for various income ranges: 87.9% for AGIs below $25k, 95.0% for AGIs $25k-50k, 92.3% for AGIs $50k-75k, 100.0% for AGIs $75k-100k, 90.9% for AGIs $100k-200k, 100.0% for AGIs over 200k)
Averages for the 2012 tax year for zip code 78873, filed in 2013:
Average Adjusted Gross Income (AGI) in 2012: $56,716 (Individual Income Tax Returns)
Here:
$56,716
State:
$65,384
Salary/wage: $34,514 (reported on 67.1% of returns)
Here:
$34,514
State:
$52,524
(% of AGI for various income ranges: 53.0% for AGIs below $25k, 62.6% for AGIs $25k-50k, 58.1% for AGIs $50k-75k, 51.1% for AGIs $75k-100k, 74.0% for AGIs $100k-200k)
Taxable interest for individuals: $2,170 (reported on 35.5% of returns)
This zip code:
$2,170
Texas:
$2,372
(% of AGI for various income ranges: 3.1% for AGIs below $25k, 1.7% for AGIs $25k-50k, 1.8% for AGIs $50k-75k, 1.6% for AGIs $75k-100k, 2.2% for AGIs $100k-200k)
Ordinary dividends: $6,847 (reported on 22.4% of returns)
Here:
$6,847
State:
$9,721
(% of AGI for various income ranges: 1.1% for AGIs below $25k, 1.3% for AGIs $25k-50k, 2.1% for AGIs $50k-75k, 12.7% for AGIs $100k-200k)
Net capital gain/loss in AGI: +$70,071 (reported on 18.4% of returns)
Here:
+$70,071
State:
+$35,319
(% of AGI for various income ranges: 1.5% for AGIs $25k-50k, 1.8% for AGIs $50k-75k, 136.2% for AGIs $100k-200k)
Profit/loss from business: +$11,562 (reported on 31.6% of returns)
Here:
+$11,562
State:
+$13,732
(% of AGI for various income ranges: 20.9% for AGIs below $25k, 7.9% for AGIs $25k-50k, 8.8% for AGIs $75k-100k, 13.9% for AGIs $100k-200k)
Taxable individual retirement arrangement distribution: $16,580 (reported on 13.2% of returns)
78873:
$16,580
Texas:
$19,511
(% of AGI for various income ranges: 5.4% for AGIs below $25k, 4.2% for AGIs $25k-50k, 4.8% for AGIs $50k-75k, 18.2% for AGIs $75k-100k)
Total itemized deductions: $22,900 (16% of AGI, reported on 21.1% of returns)
Here:
$22,900
State:
$24,724
Here:
15.8% of AGI
State:
15.9% of AGI
(% of AGI for various income ranges: 9.6% for AGIs below $25k, 8.9% for AGIs $25k-50k, 10.7% for AGIs $50k-75k, 10.1% for AGIs $75k-100k, 21.6% for AGIs $100k-200k)
Charity contributions: $5,171 (reported on 18.4% of returns)
Here:
$5,171
State:
$6,808
(% of AGI for various income ranges: 3.2% for AGIs $25k-50k, 3.1% for AGIs $50k-75k, 4.5% for AGIs $100k-200k)
Taxes paid: $4,880 (reported on 19.7% of returns)
78873:
$4,880
State:
$6,921
(% of AGI for various income ranges: 1.8% for AGIs below $25k, 1.9% for AGIs $25k-50k, 3.2% for AGIs $50k-75k, 4.6% for AGIs $100k-200k)
Earned income credit: $2,606 (reported on 22.4% of returns)
Here:
$2,606
State:
$2,570
(% of AGI for various income ranges: 8.1% for AGIs below $25k, 1.6% for AGIs $25k-50k)
Percentage of individuals using paid preparers for their 2012 taxes: 56.6%
Here:
57%
State:
51%
(% for various income ranges: 54.3% for AGIs below $25k, 50.0% for AGIs $25k-50k, 54.5% for AGIs $50k-75k, 80.0% for AGIs $75k-100k, 100.0% for AGIs $100k-200k)
Averages for the 2004 tax year for zip code 78873, filed in 2005:
Average Adjusted Gross Income (AGI) in 2004: $33,145 (Individual Income Tax Returns)
Here:
$33,145
State:
$47,881
Salary/wage: $24,388 (reported on 63.2% of returns)
Here:
$24,388
State:
$41,947
(% of AGI for various income ranges: 101.0% for AGIs below $10k, 61.6% for AGIs $10k-25k, 57.2% for AGIs $25k-50k, 57.1% for AGIs $50k-75k, 32.6% for AGIs $75k-100k, 18.5% for AGIs over 100k)
Taxable interest for individuals: $2,162 (reported on 51.2% of returns)
This zip code:
$2,162
Texas:
$2,255
(% of AGI for various income ranges: 14.1% for AGIs below $10k, 5.0% for AGIs $10k-25k, 4.2% for AGIs $25k-50k, 3.4% for AGIs $50k-75k, 1.4% for AGIs $75k-100k, 1.4% for AGIs over 100k)
Taxable dividends: $2,363 (reported on 22.9% of returns)
Here:
$2,363
State:
$4,261
(% of AGI for various income ranges: 6.5% for AGIs below $10k, 0.8% for AGIs $10k-25k, 2.8% for AGIs $25k-50k, 0.9% for AGIs $50k-75k, 1.1% for AGIs $75k-100k, 1.7% for AGIs over 100k)
Net capital gain/loss: +$18,783 (reported on 20.1% of returns)
Here:
+$18,783
State:
+$16,110
(% of AGI for various income ranges: -9.1% for AGIs below $10k, -0.9% for AGIs $10k-25k, 1.1% for AGIs $25k-50k, 2.2% for AGIs $50k-75k, 0.3% for AGIs $75k-100k, 45.0% for AGIs over 100k)
Profit/loss from business: +$11,522 (reported on 29.9% of returns)
Here:
+$11,522
State:
+$11,013
(% of AGI for various income ranges: 35.0% for AGIs below $10k, 10.5% for AGIs $10k-25k, 6.4% for AGIs $25k-50k, 3.0% for AGIs $50k-75k, 16.4% for AGIs $75k-100k, 16.2% for AGIs over 100k)
IRA payment deduction: $3,000 (reported on 1.6% of returns)
78873:
$3,000
Texas:
$3,120
Total itemized deductions: $16,782 (24% of AGI, reported on 16.1% of returns)
Here:
$16,782
State:
$19,631
Here:
23.6% of AGI
State:
18.9% of AGI
(% of AGI for various income ranges: 6.7% for AGIs $10k-25k, 9.3% for AGIs $25k-50k, 7.7% for AGIs $50k-75k, 11.8% for AGIs $75k-100k, 7.3% for AGIs over 100k)
Charity contributions deductions: $5,217 (7% of AGI, reported on 13.4% of returns)
Here:
$5,217
State:
$4,753
Here:
7.2% of AGI
State:
4.2% of AGI
(% of AGI for various income ranges: 1.1% for AGIs $10k-25k, 1.8% for AGIs $25k-50k, 2.2% for AGIs $50k-75k, 2.7% for AGIs $75k-100k, 2.9% for AGIs over 100k)
Total tax: $5,074 (reported on 71.2% of returns)
78873:
$5,074
State:
$9,058
(% of AGI for various income ranges: 10.6% for AGIs below $10k, 4.3% for AGIs $10k-25k, 6.2% for AGIs $25k-50k, 8.9% for AGIs $50k-75k, 14.2% for AGIs $75k-100k, 20.4% for AGIs over 100k)
Earned income credit: $2,039 (reported on 22.5% of returns)
Here:
$2,039
State:
$2,024
Percentage of individuals using paid preparers for their 2004 taxes: 61.9%
Here:
62%
State:
57%
(% for various income ranges: 54.3% for AGIs below $10k, 59.1% for AGIs $10k-25k, 68.2% for AGIs $25k-50k, 59.5% for AGIs $50k-75k, 73.3% for AGIs $75k-100k, 95.7% for AGIs over 100k)
Household received Food Stamps/SNAP in the past 12 months: 45 Household did not receive Food Stamps/SNAP in the past 12 months: 507
Women who did not have a birth in the past 12 months: 173 (33 now married, 141 unmarried)
Housing units in zip code 78873 with a mortgage: 116 (17 second mortgage) Median monthly owner costs for units with a mortgage: $2,061 Median monthly owner costs for units without a mortgage: $428
Residents with income below the poverty level in 2022:
This zip code:
23.6%
Whole state:
14.0%
Residents with income below 50% of the poverty level in 2022:
This zip code:
14.6%
Whole state:
7.4%
Median number of rooms in houses and condos:
Here:
5.4
State:
6.3
Median number of rooms in apartments:
Here:
4.0
State:
4.0
Notable locations in this zip code not listed on our city pages
Notable locations in zip code 78873: Perry Ranch (A), Alto Frio Encampment (B), Auld Ranch (C), Maverick Windmill (D), Butt Foundation Camp (E), Leakey Volunteer Fire Department (F), Frio Canyon Emergency Medical Service (G). Display/hide their locations on the map
Streams, rivers, and creeks: Bluff Creek (A), Bee Creek (B), Ash Creek (C), Patterson Creek (D), Paint Creek (E), Walnut Creek (F), West Frio River (G), Tracy Creek (H), Elm Creek (I). Display/hide their locations on the map
In group quarters: 34 (-1 institutionalized population)
Size of family households: 330 2-persons, 20 3-persons, 3 4-persons, 6 5-persons, 18 6-persons, 3 7-or-more-persons
Size of nonfamily households: 169 1-person, 3 2-persons, 4 3-persons
136 married couples with children.
27 single-parent households (27 women).
88.7% of residents of 78873 zip code speak English at home.
12.1% of residents speak Spanish at home (69% very well, 6% well, 25% not well, 1% not at all).
Foreign born population: 56 (4.3%) (29.4% of them are naturalized citizens)
This zip code:
4.3%
Whole state:
17.2%
64%Honduras
18%El Salvador
9%Costa Rica
9%Guatemala
11%Irish
8%German
5%English
5%Scottish
2%French Canadian
1%Swedish
Year of entry for the foreign-born population
212010 or later
192000 to 2009
91990 to 1999
110Before 1990
Housing units lacking complete plumbing facilities: 3.0% Housing units lacking complete kitchen facilities: 0.7%
78.1%Electricity
15.5%Bottled, tank, or LP gas
6.7%Wood
Population in 1990: 1,142. Population change in the 1990s: +287 (+25.1%).
Place of birth for U.S.-born residents:
This state: 957
Northeast: 36
Midwest: 77
South: 54
West: 5
60% of the 78873 zip code residents lived in the same house 5 years ago. Out of people who lived in different houses, 30% lived in this county. Out of people who lived in different counties, 50% lived in Texas.
96% of the 78873 zip code residents lived in the same house 1 year ago. Out of people who lived in different houses, 48% moved from this county. Out of people who lived in different houses, 52% moved from different county within same state.
Private vs. public school enrollment:
Students in private schools in grades 1 to 8 (elementary and middle school): 32
Here:
17.0%
Texas:
8.8%
Students in private schools in grades 9 to 12 (high school): 1
Here:
0.7%
Texas:
8.0%
Students in private undergraduate colleges:
Here:
0.0%
Texas:
16.2%
Occupation by median earnings in the past 12 months ($)
71,214Sales and related occupations
67,309Management occupations
33,062Office and administrative support occupations
23,895Food preparation and serving related occupations
12,148Construction and extraction occupations
Top industries in this zip code by the number of employees in 2005:
Other Services (except Public Administration): Religious Organizations (10-19 employees: 2 establishments, 1-4 employees: 3 establishments)
Construction: New Single-Family Housing Construction (except Operative Builders) (20-49: 1)
Accommodation and Food Services: Full-Service Restaurants (10-19: 1, 5-9: 2)
Construction: Land Subdivision (10-19: 1)
Finance and Insurance: Commercial Banking (10-19: 1)
Health Care and Social Assistance: Other Residential Care Facilities (10-19: 1)
Health Care and Social Assistance: All Other Outpatient Care Centers (5-9: 1)
People in group quarters in 2000:
4 people in other workers' dormitories
Fatal accident statistics in 2014:
Fatal accident count: 1
Vehicles involved in fatal accidents: 1
Fatal accidents caused by drunken drivers: 1
Fatalities: 1
Persons involved in fatal accidents: 2
Pedestrians involved in fatal accidents: 0
Fatal accident statistics in 2011:
Fatal accident count: 2
Vehicles involved in fatal accidents: 4
Fatal accidents caused by drunken drivers: 0
Fatalities: 3
Persons involved in fatal accidents: 6
Pedestrians involved in fatal accidents: 0
Most common first names in zip code 78873 among deceased individuals
Name
Count
Lived (average)
James
14
73.8 years
John
11
79.1 years
Mary
11
75.7 years
William
10
72.6 years
Robert
8
80.5 years
Charles
7
73.9 years
George
5
68.4 years
Thomas
4
69.5 years
Donald
4
74.0 years
Carl
4
74.5 years
Most common last names in zip code 78873 among deceased individuals
Last name
Count
Lived (average)
Buchanan
10
89.6 years
Brice
9
75.1 years
Chisum
8
81.9 years
Smith
7
79.3 years
Rogers
7
72.3 years
Thompson
6
75.6 years
Leistikow
6
65.5 years
Pendley
5
76.8 years
Tampke
5
72.8 years
Clark
5
81.8 years
Businesses in zip code 78873
U-Haul: 1
Discuss Leakey, Texas (TX) on our hugely popular Texas forum.


 Nearest zip codes: 78879, 78885, 78838, 78828, 78058, 78024.


