Estimated zip code population in 2022: 19,096 Zip code population in 2010: 19,473 Zip code population in 2000: 18,365
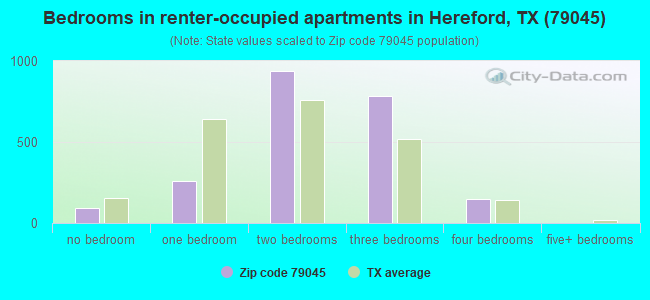
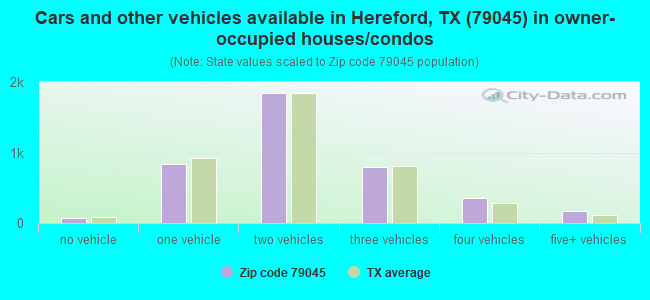
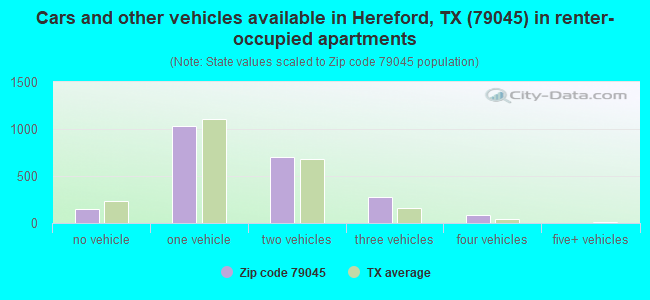
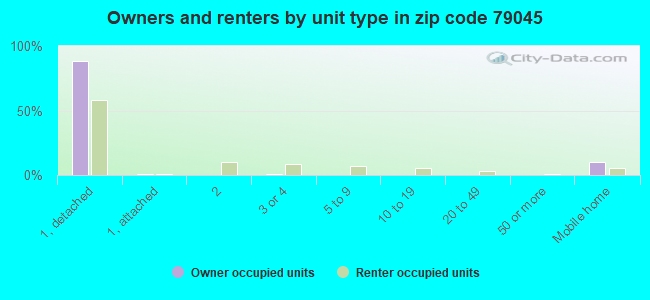
Houses and condos: 7,266 Renter-occupied apartments: 2,248
% of renters here:
36%
State:
38%
March 2022 cost of living index in zip code 79045: 76.9 (low, U.S. average is 100)
Land area: 1220.8 sq. mi. Water area: 1.9 sq. mi.
Population density: 16 people per square mile
(very low).
OSM Map
General Map
Google Map
MSN Map
OSM Map
General Map
Google Map
MSN Map
OSM Map
General Map
Google Map
MSN Map
OSM Map
General Map
Google Map
MSN Map
Please wait while loading the map...
Real estate property taxes paid for housing units in 2022:
This zip code:
1.3% ($1,595)
Texas:
1.5% ($4,050)
Median real estate property taxes paid for housing units with mortgages in 2022: $2,652 (1.6%) Median real estate property taxes paid for housing units with no mortgage in 2022: $1,199 (1.3%)
Business Search- 14 Million verified businesses
Males: 9,642
(50.5%)
Females: 9,454
(49.5%)
For population 25 years and over in 79045:
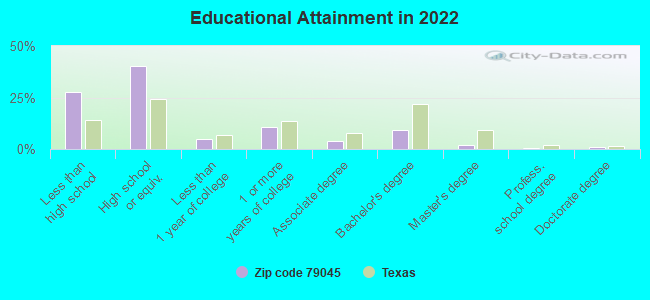
High school or higher: 70.6%
Bachelor's degree or higher: 12.1%
Graduate or professional degree: 3.1%
Unemployed: 1.9%
Mean travel time to work (commute): 17.0 minutes
For population 15 years and over in 79045:
Never married: 28.8%
Now married: 52.6%
Separated: 3.0%
Widowed: 6.7%
Divorced: 8.9%
Zip code 79045 compared to state average:
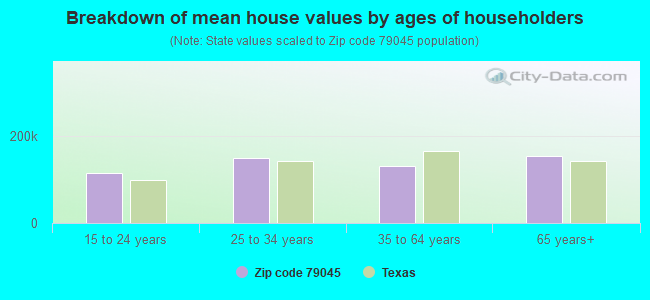
Median house value significantly below state average.
Unemployed percentage below state average.
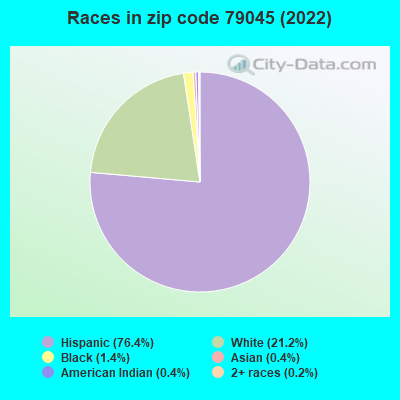
Black race population percentage significantly below state average.
Hispanic race population percentage above state average.
Length of stay since moving in significantly above state average.
House age above state average.
Number of college students below state average.
Percentage of population with a bachelor's degree or higher significantly below state average.
Averages for the 2020 tax year for zip code 79045, filed in 2021:
Average Adjusted Gross Income (AGI) in 2020: $51,045 (Individual Income Tax Returns)
Here:
$51,045
State:
$77,054
Salary/wage: $42,673 (reported on 88.3% of returns)
Here:
$42,673
State:
$62,766
(% of AGI for various income ranges: 1505.7% for AGIs below $25k, 4170.9% for AGIs $25k-50k, 6775.2% for AGIs $50k-75k, 10712.1% for AGIs $75k-100k, 16662.3% for AGIs $100k-200k)
Taxable interest for individuals: $2,916 (reported on 14.8% of returns)
This zip code:
$2,916
Texas:
$2,665
(% of AGI for various income ranges: 9.3% for AGIs below $25k, 7.2% for AGIs $25k-50k, 15.5% for AGIs $50k-75k, 76.1% for AGIs $75k-100k, 309.2% for AGIs $100k-200k)
Ordinary dividends: $7,148 (reported on 8.0% of returns)
Here:
$7,148
State:
$10,044
(% of AGI for various income ranges: 10.4% for AGIs below $25k, 13.2% for AGIs $25k-50k, 32.3% for AGIs $50k-75k, 114.2% for AGIs $75k-100k, 313.8% for AGIs $100k-200k)
Net capital gain/loss in AGI: +$20,542 (reported on 8.0% of returns)
Here:
+$20,542
State:
+$39,590
(% of AGI for various income ranges: 4.1% for AGIs below $25k, 15.8% for AGIs $25k-50k, 47.0% for AGIs $50k-75k, 90.0% for AGIs $75k-100k, 864.2% for AGIs $100k-200k)
Profit/loss from business: +$2,540 (reported on 18.9% of returns)
Here:
+$2,540
State:
+$10,888
(% of AGI for various income ranges: 5.0% for AGIs below $25k, 27.4% for AGIs $50k-75k, 120.8% for AGIs $75k-100k, 839.2% for AGIs $100k-200k)
Taxable individual retirement arrangement distribution: $12,693 (reported on 3.9% of returns)
79045:
$12,693
Texas:
$24,740
(% of AGI for various income ranges: 18.9% for AGIs below $25k, 30.7% for AGIs $25k-50k, 72.7% for AGIs $50k-75k, 117.4% for AGIs $75k-100k, 313.8% for AGIs $100k-200k)
Total itemized deductions: $47,670 (reported on 3.0% of returns)
Here:
$47,670
State:
$40,428
(% of AGI for various income ranges: 95.0% for AGIs $25k-50k, 238.8% for AGIs $50k-75k, 201.6% for AGIs $75k-100k, 752.7% for AGIs $100k-200k)
Charity contributions: $28,035 (reported on 2.2% of returns)
Here:
$28,035
State:
$18,201
(% of AGI for various income ranges: 15.3% for AGIs $25k-50k, 39.9% for AGIs $50k-75k, 366.9% for AGIs $100k-200k)
Taxes paid: $4,958 (reported on 2.4% of returns)
79045:
$4,958
State:
$7,821
(% of AGI for various income ranges: 8.2% for AGIs $25k-50k, 21.5% for AGIs $50k-75k, 89.2% for AGIs $100k-200k)
Earned income credit: $2,795 (reported on 26.3% of returns)
Here:
$2,795
State:
$2,584
(% of AGI for various income ranges: 157.3% for AGIs below $25k, 102.9% for AGIs $25k-50k, 2.4% for AGIs $50k-75k)
Percentage of individuals using paid preparers for their 2020 taxes: 86.9%
Here:
87%
State:
92%
(% for various income ranges: 86.4% for AGIs below $25k, 87.3% for AGIs $25k-50k, 85.6% for AGIs $50k-75k, 89.3% for AGIs $75k-100k, 89.6% for AGIs $100k-200k, 85.7% for AGIs over 200k)
Averages for the 2012 tax year for zip code 79045, filed in 2013:
Average Adjusted Gross Income (AGI) in 2012: $40,945 (Individual Income Tax Returns)
Here:
$40,945
State:
$65,384
Salary/wage: $32,632 (reported on 88.7% of returns)
Here:
$32,632
State:
$52,524
(% of AGI for various income ranges: 86.0% for AGIs below $25k, 90.9% for AGIs $25k-50k, 84.2% for AGIs $50k-75k, 76.1% for AGIs $75k-100k, 62.6% for AGIs $100k-200k, 18.5% for AGIs over 200k)
Taxable interest for individuals: $3,539 (reported on 15.8% of returns)
This zip code:
$3,539
Texas:
$2,372
(% of AGI for various income ranges: 0.8% for AGIs below $25k, 0.4% for AGIs $25k-50k, 0.5% for AGIs $50k-75k, 0.7% for AGIs $75k-100k, 1.4% for AGIs $100k-200k, 4.4% for AGIs over 200k)
Ordinary dividends: $4,842 (reported on 8.4% of returns)
Here:
$4,842
State:
$9,721
(% of AGI for various income ranges: 0.6% for AGIs below $25k, 0.4% for AGIs $25k-50k, 0.7% for AGIs $50k-75k, 0.8% for AGIs $75k-100k, 1.6% for AGIs $100k-200k, 2.2% for AGIs over 200k)
Net capital gain/loss in AGI: +$13,314 (reported on 7.4% of returns)
Here:
+$13,314
State:
+$35,319
(% of AGI for various income ranges: 0.3% for AGIs below $25k, 0.2% for AGIs $25k-50k, 0.1% for AGIs $50k-75k, 1.6% for AGIs $75k-100k, 2.9% for AGIs $100k-200k, 9.6% for AGIs over 200k)
Profit/loss from business: +$8,073 (reported on 15.4% of returns)
Here:
+$8,073
State:
+$13,732
(% of AGI for various income ranges: 7.3% for AGIs below $25k, 2.0% for AGIs $25k-50k, 2.3% for AGIs $50k-75k, 1.8% for AGIs $75k-100k, 2.5% for AGIs $100k-200k, 3.0% for AGIs over 200k)
Taxable individual retirement arrangement distribution: $11,019 (reported on 4.7% of returns)
79045:
$11,019
Texas:
$19,511
(% of AGI for various income ranges: 1.0% for AGIs below $25k, 0.8% for AGIs $25k-50k, 1.0% for AGIs $50k-75k, 1.9% for AGIs $75k-100k, 2.7% for AGIs $100k-200k, 1.0% for AGIs over 200k)
Total itemized deductions: $22,311 (18% of AGI, reported on 9.5% of returns)
Here:
$22,311
State:
$24,724
Here:
18.0% of AGI
State:
15.9% of AGI
(% of AGI for various income ranges: 3.0% for AGIs below $25k, 3.6% for AGIs $25k-50k, 5.2% for AGIs $50k-75k, 5.7% for AGIs $75k-100k, 8.2% for AGIs $100k-200k, 6.9% for AGIs over 200k)
Charity contributions: $8,890 (reported on 7.4% of returns)
Here:
$8,890
State:
$6,808
(% of AGI for various income ranges: 0.3% for AGIs below $25k, 0.6% for AGIs $25k-50k, 1.1% for AGIs $50k-75k, 1.4% for AGIs $75k-100k, 3.4% for AGIs $100k-200k, 3.6% for AGIs over 200k)
Taxes paid: $4,078 (reported on 9.1% of returns)
79045:
$4,078
State:
$6,921
(% of AGI for various income ranges: 0.4% for AGIs below $25k, 0.5% for AGIs $25k-50k, 0.9% for AGIs $50k-75k, 1.2% for AGIs $75k-100k, 1.8% for AGIs $100k-200k, 1.2% for AGIs over 200k)
Earned income credit: $2,679 (reported on 32.7% of returns)
Here:
$2,679
State:
$2,570
(% of AGI for various income ranges: 10.7% for AGIs below $25k, 2.0% for AGIs $25k-50k)
Percentage of individuals using paid preparers for their 2012 taxes: 55.4%
Here:
55%
State:
51%
(% for various income ranges: 52.1% for AGIs below $25k, 54.3% for AGIs $25k-50k, 61.6% for AGIs $50k-75k, 57.9% for AGIs $75k-100k, 70.0% for AGIs $100k-200k, 90.9% for AGIs over 200k)
Averages for the 2004 tax year for zip code 79045, filed in 2005:
Average Adjusted Gross Income (AGI) in 2004: $31,576 (Individual Income Tax Returns)
Here:
$31,576
State:
$47,881
Salary/wage: $26,134 (reported on 86.7% of returns)
Here:
$26,134
State:
$41,947
(% of AGI for various income ranges: 311.8% for AGIs below $10k, 86.6% for AGIs $10k-25k, 87.3% for AGIs $25k-50k, 76.9% for AGIs $50k-75k, 71.4% for AGIs $75k-100k, 28.9% for AGIs over 100k)
Taxable interest for individuals: $3,296 (reported on 25.0% of returns)
This zip code:
$3,296
Texas:
$2,255
(% of AGI for various income ranges: 14.9% for AGIs below $10k, 1.5% for AGIs $10k-25k, 1.0% for AGIs $25k-50k, 1.5% for AGIs $50k-75k, 2.0% for AGIs $75k-100k, 5.7% for AGIs over 100k)
Taxable dividends: $2,526 (reported on 11.2% of returns)
Here:
$2,526
State:
$4,261
(% of AGI for various income ranges: 6.0% for AGIs below $10k, 0.6% for AGIs $10k-25k, 0.4% for AGIs $25k-50k, 1.0% for AGIs $50k-75k, 1.4% for AGIs $75k-100k, 1.2% for AGIs over 100k)
Net capital gain/loss: +$8,594 (reported on 11.0% of returns)
Here:
+$8,594
State:
+$16,110
(% of AGI for various income ranges: 9.3% for AGIs below $10k, 0.4% for AGIs $10k-25k, 1.0% for AGIs $25k-50k, 0.8% for AGIs $50k-75k, 3.4% for AGIs $75k-100k, 8.2% for AGIs over 100k)
Profit/loss from business: +$5,409 (reported on 16.9% of returns)
Here:
+$5,409
State:
+$11,013
(% of AGI for various income ranges: 6.9% for AGIs below $10k, 4.4% for AGIs $10k-25k, 2.1% for AGIs $25k-50k, 3.1% for AGIs $50k-75k, 3.0% for AGIs $75k-100k, 2.3% for AGIs over 100k)
IRA payment deduction: $3,444 (reported on 1.8% of returns)
79045:
$3,444
Texas:
$3,120
(% of AGI for various income ranges: 0.2% for AGIs $25k-50k, 0.3% for AGIs $50k-75k, 0.4% for AGIs $75k-100k, 0.2% for AGIs over 100k)
Self-employed pension: $8,267 (reported on 0.2% of returns)
Here:
$8,267
Texas:
$16,401
Total itemized deductions: $17,031 (21% of AGI, reported on 10.4% of returns)
Here:
$17,031
State:
$19,631
Here:
20.6% of AGI
State:
18.9% of AGI
(% of AGI for various income ranges: 23.2% for AGIs below $10k, 3.2% for AGIs $10k-25k, 4.4% for AGIs $25k-50k, 7.1% for AGIs $50k-75k, 7.4% for AGIs $75k-100k, 6.5% for AGIs over 100k)
Charity contributions deductions: $7,033 (8% of AGI, reported on 8.6% of returns)
Here:
$7,033
State:
$4,753
Here:
7.8% of AGI
State:
4.2% of AGI
(% of AGI for various income ranges: 1.8% for AGIs below $10k, 0.5% for AGIs $10k-25k, 0.9% for AGIs $25k-50k, 2.0% for AGIs $50k-75k, 2.3% for AGIs $75k-100k, 3.9% for AGIs over 100k)
Total tax: $6,072 (reported on 56.1% of returns)
79045:
$6,072
State:
$9,058
(% of AGI for various income ranges: 10.1% for AGIs below $10k, 2.7% for AGIs $10k-25k, 4.8% for AGIs $25k-50k, 8.6% for AGIs $50k-75k, 10.9% for AGIs $75k-100k, 25.2% for AGIs over 100k)
Earned income credit: $2,064 (reported on 35.9% of returns)
Here:
$2,064
State:
$2,024
Percentage of individuals using paid preparers for their 2004 taxes: 60.9%
Here:
61%
State:
57%
(% for various income ranges: 58.7% for AGIs below $10k, 60.6% for AGIs $10k-25k, 59.4% for AGIs $25k-50k, 65.5% for AGIs $50k-75k, 63.8% for AGIs $75k-100k, 81.9% for AGIs over 100k)
Likely homosexual households (counted as self-reported same-sex unmarried-partner households)
Lesbian couples: 0.1% of all households
Gay men: 0.0% of all households
Household received Food Stamps/SNAP in the past 12 months: 889 Household did not receive Food Stamps/SNAP in the past 12 months: 5,439
Women who had a birth in the past 12 months: 224 (133 now married, 89 unmarried) Women who did not have a birth in the past 12 months: 4,096 (2,172 now married, 1,912 unmarried)
Housing units in zip code 79045 with a mortgage: 1,525 (6 second mortgage, 7 both second mortgage and home equity loan) Median monthly owner costs for units with a mortgage: $1,320 Median monthly owner costs for units without a mortgage: $402
Residents with income below the poverty level in 2022:
This zip code:
16.3%
Whole state:
14.0%
Residents with income below 50% of the poverty level in 2022:
This zip code:
6.0%
Whole state:
7.4%
Median number of rooms in houses and condos:
Here:
6.0
State:
6.3
Median number of rooms in apartments:
Here:
4.5
State:
4.0
Notable locations in this zip code not listed on our city pages
Notable locations in zip code 79045: Conkwright Ranch (A), Rock Camp (B), South Headquarters (C), The Cook Shack (D), Perrin Brothers Farm (E), Red Windmill (F), Allison Ranch (G), Bar G Feedyard (H), Circle Three Feedyard (I), Deaf Smith County Courthouse (J), Hereford Fire Department (K), The National Cowgirl Hall of Fame and Western Heritage Center (L), Deaf Smith County Historical Museum (M), Hereford Emergency Medical Service (N), E B Black House (O). Display/hide their locations on the map
Churches in zip code 79045 include: Trinity Fellowship Church (A), Parkside Chapel Church (B), Fellowship of Believers Church (C), Community Church (D), Seventh Day Adventist Church (E), Wesley United Methodist Church (F), Saint Thomas Episcopal Church (G), Church of God (H), Spanish Church of Christ (I). Display/hide their locations on the map
Lakes and reservoirs: Overstreet Lake (A), Red Windmill Lake (B), Hay Lake (C), Norton Lake (D), Schulte Lake (E), Grigsby Lake (F), Harris and Thrush Reservoir (G), Leroy Johnson Lake (H). Display/hide their locations on the map
In group quarters: 199 (-1 institutionalized population)
Size of family households: 2,057 2-persons, 971 3-persons, 758 4-persons, 436 5-persons, 276 6-persons, 337 7-or-more-persons
Size of nonfamily households: 1,232 1-person, 225 2-persons, 17 3-persons
3,386 married couples with children.
1,222 single-parent households (531 men, 691 women).
43.1% of residents of 79045 zip code speak English at home.
56.4% of residents speak Spanish at home (72% very well, 13% well, 9% not well, 6% not at all).
0.1% of residents speak other Indo-European language at home (100% very well).
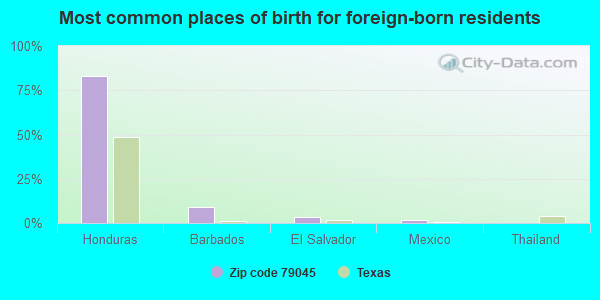
Foreign born population: 3,196 (16.7%) (26.0% of them are naturalized citizens)
This zip code:
16.7%
Whole state:
17.2%
83%Honduras
9%Barbados
3%El Salvador
2%Mexico
0%Thailand
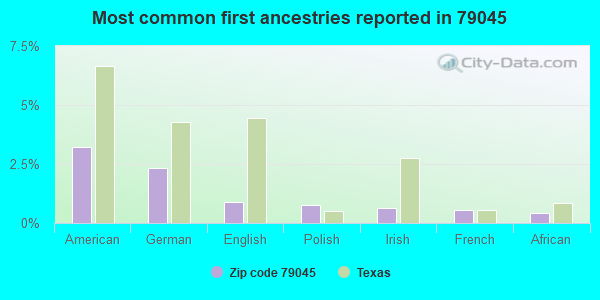
3%American
2%German
1%English
1%Polish
1%Irish
1%French
0%African
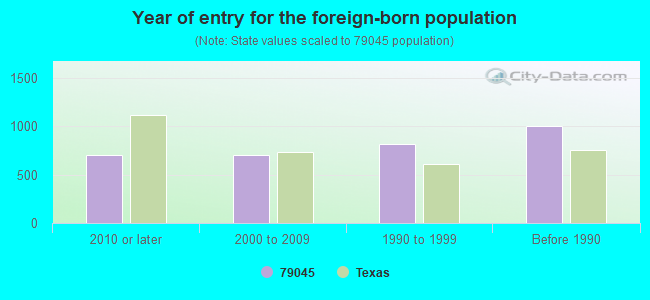
Year of entry for the foreign-born population
7012010 or later
7022000 to 2009
8161990 to 1999
1,008Before 1990
Facilities with environmental interests located in this zip code:
AIKMAN EL (900 AVE K in HEREFORD, TX)
(National Center for Education Statistics) - STATE ID-059901101 Organizations: HEREFORD ISD (SCHOOL DISTRICT)
BAR G 2 FEEDYARD (415 CR 503 B in HEREFORD, TX)
National Pollutant Discharge Elimination System NON-MAJOR (Tracking pollutant discharge elimination systems) - permit Business SIC classification: BEEF CATTLE FEEDLOTS Organizations: LIMITED INVESTORS LTD (CONTACT/OWNER)
BARRETT CROFOOT EAST (0.5MI E INTX FM 1057 & CR 4 in HEREFORD, TX)
National Pollutant Discharge Elimination System NON-MAJOR (Tracking pollutant discharge elimination systems) - permit Business SIC classification: BEEF CATTLE FEEDLOTS Organizations: EC FARMS LP (CONTACT/OWNER)
Alternative names: EC FARMS LP
BARRETT CROFOOT WEST (FM 1058 15 MI W OF HEREFORD in HEREFORD, TX)
National Pollutant Discharge Elimination System NON-MAJOR (Tracking pollutant discharge elimination systems) - permit Business SIC classification: BEEF CATTLE FEEDLOTS Organizations: BARRETT & CROFOOT LLC (CONTACT/OWNER)
Alternative names: BARRETT & CROFOOT LLC
ADM ALLIANCE NUTRITION INC (401 PROGRESSIVE RD in HEREFORD, TX)
TRI REPORTER (Tracking of toxic chemicals releasing facilities) Business SIC classification: PREPARED FEEDS AND FEED INGREDIENTS FOR ANIMALS AND FOWLS, EXCEPT DOGS AND CATS Alternative names: ADM ALLIANCE NUTRITION INC., MOORMAN'S INC.
Housing units lacking complete plumbing facilities: 4.0% Housing units lacking complete kitchen facilities: 4.6%
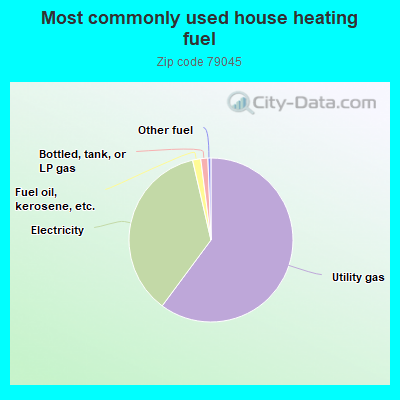
60.1%Utility gas
36.2%Electricity
1.6%Fuel oil, kerosene, etc.
1.4%Bottled, tank, or LP gas
0.6%Other fuel
Population in 1990: 19,090.
Place of birth for U.S.-born residents:
This state: 13,330
Northeast: 119
Midwest: 524
South: 615
West: 1,106
58% of the 79045 zip code residents lived in the same house 5 years ago. Out of people who lived in different houses, 67% lived in this county. Out of people who lived in different counties, 50% lived in Texas.
92% of the 79045 zip code residents lived in the same house 1 year ago. Out of people who lived in different houses, 75% moved from this county. Out of people who lived in different houses, 19% moved from different county within same state. Out of people who lived in different houses, 3% moved from different state.
Private vs. public school enrollment:
Students in private schools in grades 1 to 8 (elementary and middle school): 103
Here:
4.0%
Texas:
8.8%
Students in private schools in grades 9 to 12 (high school): 83
Here:
6.4%
Texas:
8.0%
Students in private undergraduate colleges: 16
Here:
4.1%
Texas:
16.2%
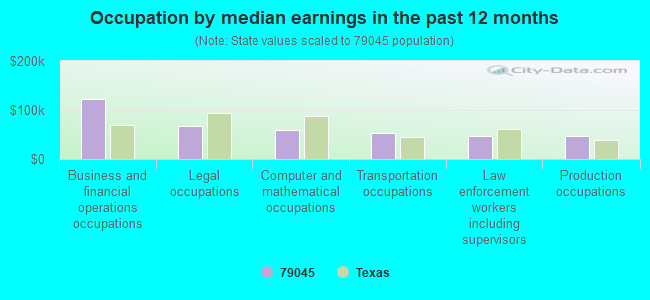
Occupation by median earnings in the past 12 months ($)
123,414Business and financial operations occupations
68,229Legal occupations
58,237Computer and mathematical occupations
53,070Transportation occupations
47,286Law enforcement workers including supervisors
46,174Production occupations
Companies with federal contracts located in this zip code:
WEST TEXAS RURAL TELEPHONE COO (3425 US HIGHWAY 385 in HEREFORD, TX; small business) : $188,525 in 2 contractsfrom 2001 to 2005
$185,000 with ENERGY, Department of for Miscellaneous Communication Equipment. Signed on 2001-06-15. Completion date: 2001-06-15.
$3,525 with Department of Defense for ADP Telecommunications and Transmission Services. Signed on 2005-03-31. Completion date: 2014-10-07.
W. T. SERVICE, INC (2 MILES S OF HEREFORD ON in HEREFORD, TX; small business) : $124,000 in 2 contractsin 2002
$103,000 with ENERGY, Department of for Telephone and Telegraph Equipment. Signed on 2002-03-15. Completion date: 2002-05-15.
$21,000, same as above.Signed on 2002-05-15. Completion date: 2002-05-15.
Top industries in this zip code by the number of employees in 2005:
Wholesale Trade: Grain and Field Bean Merchant Wholesalers (20-49: 3, 10-19: 2)
People in group quarters in 2010:
153 people in workers' group living quarters and job corps centers
126 people in nursing facilities/skilled-nursing facilities
79 people in local jails and other municipal confinement facilities
7 people in group homes for juveniles (non-correctional)
6 people in group homes intended for adults
People in group quarters in 2000:
152 people in nursing homes
90 people in local jails and other confinement facilities (including police lockups)
11 people in homes for the mentally retarded
Fatal accident statistics in 2014:
Fatal accident count: 2
Vehicles involved in fatal accidents: 4
Fatal accidents caused by drunken drivers: 0
Fatalities: 2
Persons involved in fatal accidents: 4
Pedestrians involved in fatal accidents: 0
Fatal accident statistics in 2013:
Fatal accident count: 2
Vehicles involved in fatal accidents: 2
Fatal accidents caused by drunken drivers: 1
Fatalities: 2
Persons involved in fatal accidents: 6
Pedestrians involved in fatal accidents: 0
2002 - 2018 National Fire Incident Reporting System (NFIRS) incidents
Based on the data from the years 2002 - 2018 the average number of fire incidents per year is 119. The highest number of fire incidents - 197 took place in 2011, and the least - 85 in 2004. The data has an increasing trend.
When looking into fire subcategories, the most incidents belonged to: Outside Fires (64.5%), and Structure Fires (21.9%).
Fire incident types reported to NFIRS in Zip Code 79045


 Nearest zip codes: 79085, 79035, 79025, 79092, 79098, 79091.
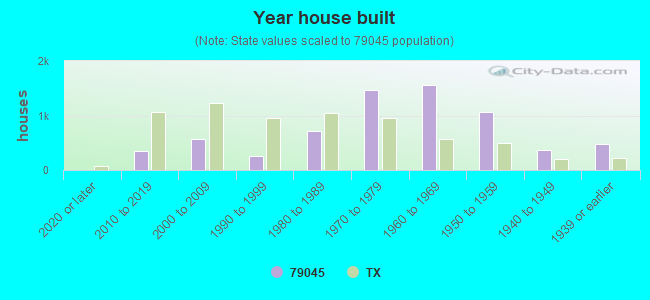


 Based on the data from the years 2002 - 2018 the average number of fire incidents per year is 119. The highest number of fire incidents - 197 took place in 2011, and the least - 85 in 2004. The data has an increasing trend.
 When looking into fire subcategories, the most incidents belonged to: Outside Fires (64.5%), and Structure Fires (21.9%).