Estimated zip code population in 2022: 964 Zip code population in 2010: 963 Zip code population in 2000: 1,020
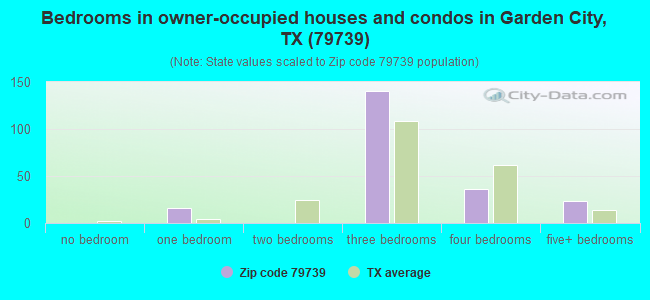
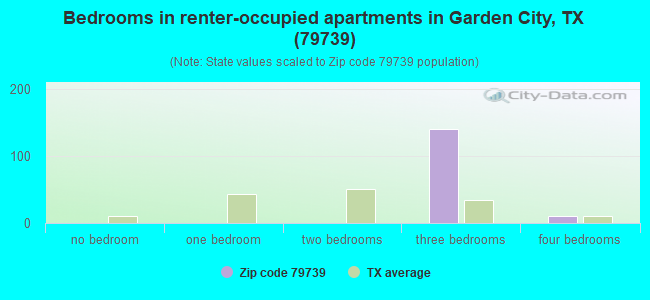
Houses and condos: 411 Renter-occupied apartments: 154
% of renters here:
42%
State:
38%
March 2022 cost of living index in zip code 79739: 76.9 (low, U.S. average is 100)
Land area: 529.4 sq. mi. Water area: 0.4 sq. mi.
Population density: 2 people per square mile
(very low).
OSM Map
General Map
Google Map
MSN Map
OSM Map
General Map
Google Map
MSN Map
OSM Map
General Map
Google Map
MSN Map
OSM Map
General Map
Google Map
MSN Map
Please wait while loading the map...
Real estate property taxes paid for housing units in 2022:
This zip code:
0.4% ($1,217)
Texas:
1.5% ($4,050)
Median real estate property taxes paid for housing units with mortgages in 2022: $271 (0.1%) Median real estate property taxes paid for housing units with no mortgage in 2022: $1,596 (0.4%)
Business Search- 14 Million verified businesses
Males: 632
(65.6%)
Females: 331
(34.4%)
For population 25 years and over in 79739:
High school or higher: 86.5%
Bachelor's degree or higher: 40.5%
Graduate or professional degree: 9.6%
Mean travel time to work (commute): 28.9 minutes
For population 15 years and over in 79739:
Never married: 13.8%
Now married: 80.4%
Separated: 0.0%
Widowed: 2.3%
Divorced: 3.6%
Zip code 79739 compared to state average:
Median household income above state average.
Unemployed percentage significantly below state average.
Black race population percentage significantly below state average.
Length of stay since moving in significantly above state average.
Number of college students significantly below state average.
Estimated median house/condo value in 2022: $301,204
79739:
$301,204
Texas:
$275,400
According to our research of Texas and other state lists, there were 2 registered sex offenders living in 79739 zip code as of May 15, 2024. The ratio of all residents to sex offenders in zip code 79739 is 531 to 1. The ratio of registered sex offenders to all residents in this zip code is near the state average.
Median resident age:
This zip code:
36.7 years
Texas median age:
35.6 years
Average household size:
This zip code:
2.6 people
Texas:
2.6 people
Averages for the 2020 tax year for zip code 79739, filed in 2021:
Average Adjusted Gross Income (AGI) in 2020: $132,206 (Individual Income Tax Returns)
Here:
$132,206
State:
$77,054
Salary/wage: $63,821 (reported on 78.0% of returns)
Here:
$63,821
State:
$62,766
(% of AGI for various income ranges: 1780.0% for AGIs below $25k, 5333.3% for AGIs $25k-50k, 6322.0% for AGIs $50k-75k, 9670.0% for AGIs $75k-100k, 11956.7% for AGIs $100k-200k)
Taxable interest for individuals: $4,681 (reported on 42.0% of returns)
This zip code:
$4,681
Texas:
$2,665
(% of AGI for various income ranges: 43.3% for AGIs $25k-50k, 140.0% for AGIs $75k-100k, 115.0% for AGIs $100k-200k)
Ordinary dividends: $6,927 (reported on 30.0% of returns)
Here:
$6,927
State:
$10,044
(% of AGI for various income ranges: 26.7% for AGIs below $25k, 92.0% for AGIs $50k-75k, 266.7% for AGIs $100k-200k)
Net capital gain/loss in AGI: +$22,012 (reported on 32.0% of returns)
Here:
+$22,012
State:
+$39,590
(% of AGI for various income ranges: 11.7% for AGIs below $25k, 174.0% for AGIs $50k-75k, 1015.0% for AGIs $100k-200k)
Profit/loss from business: +$4,220 (reported on 20.0% of returns)
Here:
+$4,220
State:
+$10,888
(% of AGI for various income ranges: 85.0% for AGIs below $25k, 414.0% for AGIs $50k-75k, 273.3% for AGIs $100k-200k)
Total itemized deductions: $66,100 (reported on 4.0% of returns)
Here:
$66,100
State:
$40,428
(% of AGI for various income ranges: 2203.3% for AGIs $100k-200k)
Charity contributions: $48,800 (reported on 4.0% of returns)
Here:
$48,800
State:
$18,201
(% of AGI for various income ranges: 1626.7% for AGIs $100k-200k)
Taxes paid: $5,300 (reported on 4.0% of returns)
79739:
$5,300
State:
$7,821
(% of AGI for various income ranges: 176.7% for AGIs $100k-200k)
Earned income credit: $2,360 (reported on 10.0% of returns)
Here:
$2,360
State:
$2,584
(% of AGI for various income ranges: 148.3% for AGIs below $25k, 48.3% for AGIs $25k-50k)
Percentage of individuals using paid preparers for their 2020 taxes: 94.0%
Here:
94%
State:
92%
(% for various income ranges: 90.9% for AGIs below $25k, 100.0% for AGIs $25k-50k, 85.7% for AGIs $50k-75k, 100.0% for AGIs $75k-100k, 88.9% for AGIs $100k-200k, 100.0% for AGIs over 200k)
Averages for the 2012 tax year for zip code 79739, filed in 2013:
Average Adjusted Gross Income (AGI) in 2012: $131,690 (Individual Income Tax Returns)
Here:
$131,690
State:
$65,384
Salary/wage: $39,682 (reported on 79.6% of returns)
Here:
$39,682
State:
$52,524
(% of AGI for various income ranges: 88.5% for AGIs below $25k, 75.5% for AGIs $25k-50k, 73.6% for AGIs $50k-75k, 64.1% for AGIs $75k-100k, 45.7% for AGIs $100k-200k, 4.7% for AGIs over 200k)
Taxable interest for individuals: $1,776 (reported on 34.7% of returns)
This zip code:
$1,776
Texas:
$2,372
(% of AGI for various income ranges: 0.5% for AGIs $25k-50k, 0.6% for AGIs $50k-75k, 0.3% for AGIs $100k-200k, 0.5% for AGIs over 200k)
Ordinary dividends: $7,673 (reported on 22.4% of returns)
Here:
$7,673
State:
$9,721
(% of AGI for various income ranges: 1.6% for AGIs $50k-75k, 0.8% for AGIs $100k-200k, 1.7% for AGIs over 200k)
Net capital gain/loss in AGI: +$20,620 (reported on 20.4% of returns)
Here:
+$20,620
State:
+$35,319
(% of AGI for various income ranges: 0.5% for AGIs $25k-50k, 0.3% for AGIs $100k-200k, 4.7% for AGIs over 200k)
Profit/loss from business: +$12,600 (reported on 20.4% of returns)
Here:
+$12,600
State:
+$13,732
(% of AGI for various income ranges: 9.5% for AGIs $25k-50k, 5.0% for AGIs $50k-75k, 4.7% for AGIs $100k-200k, 0.6% for AGIs over 200k)
Taxable individual retirement arrangement distribution: $8,375 (reported on 8.2% of returns)
79739:
$8,375
Texas:
$19,511
Total itemized deductions: $26,580 (8% of AGI, reported on 10.2% of returns)
Here:
$26,580
State:
$24,724
Here:
8.4% of AGI
State:
15.9% of AGI
(% of AGI for various income ranges: 15.4% for AGIs $50k-75k, 1.8% for AGIs over 200k)
Charity contributions: $15,750 (reported on 8.2% of returns)
Here:
$15,750
State:
$6,808
(% of AGI for various income ranges: 1.5% for AGIs over 200k)
Taxes paid: $4,175 (reported on 8.2% of returns)
79739:
$4,175
State:
$6,921
(% of AGI for various income ranges: 1.4% for AGIs $50k-75k, 0.3% for AGIs over 200k)
Earned income credit: $2,350 (reported on 12.2% of returns)
Here:
$2,350
State:
$2,570
(% of AGI for various income ranges: 4.6% for AGIs below $25k, 1.5% for AGIs $25k-50k)
Percentage of individuals using paid preparers for their 2012 taxes: 79.6%
Here:
80%
State:
51%
(% for various income ranges: 71.4% for AGIs below $25k, 81.8% for AGIs $25k-50k, 66.7% for AGIs $50k-75k, 75.0% for AGIs $75k-100k, 85.7% for AGIs $100k-200k, 100.0% for AGIs over 200k)
Averages for the 2004 tax year for zip code 79739, filed in 2005:
Average Adjusted Gross Income (AGI) in 2004: $37,356 (Individual Income Tax Returns)
Here:
$37,356
State:
$47,881
Salary/wage: $25,390 (reported on 79.8% of returns)
Here:
$25,390
State:
$41,947
(% of AGI for various income ranges: 77.3% for AGIs $10k-25k, 71.0% for AGIs $25k-50k, 49.2% for AGIs $50k-75k, 69.5% for AGIs $75k-100k, 27.4% for AGIs over 100k)
Taxable interest for individuals: $1,485 (reported on 40.6% of returns)
This zip code:
$1,485
Texas:
$2,255
(% of AGI for various income ranges: 0.7% for AGIs $10k-25k, 1.0% for AGIs $25k-50k, 1.8% for AGIs $50k-75k, 0.2% for AGIs $75k-100k, 1.9% for AGIs over 100k)
Taxable dividends: $1,400 (reported on 24.9% of returns)
Here:
$1,400
State:
$4,261
(% of AGI for various income ranges: 0.3% for AGIs $10k-25k, 0.3% for AGIs $25k-50k, 0.9% for AGIs $50k-75k, 0.1% for AGIs $75k-100k, 1.6% for AGIs over 100k)
Net capital gain/loss: +$86 (reported on 24.9% of returns)
Here:
+$86
State:
+$16,110
(% of AGI for various income ranges: 0.5% for AGIs $25k-50k, 0.6% for AGIs $50k-75k, -0.4% for AGIs over 100k)
Profit/loss from business: +$3,871 (reported on 16.6% of returns)
Here:
+$3,871
State:
+$11,013
(% of AGI for various income ranges: 0.6% for AGIs $10k-25k, 5.0% for AGIs $25k-50k, 0.6% for AGIs $50k-75k, 0.6% for AGIs over 100k)
IRA payment deduction: $4,238 (reported on 5.0% of returns)
79739:
$4,238
Texas:
$3,120
Total itemized deductions: $15,367 (22% of AGI, reported on 7.1% of returns)
Here:
$15,367
State:
$19,631
Here:
21.5% of AGI
State:
18.9% of AGI
Charity contributions deductions: $6,000 (7% of AGI, reported on 4.8% of returns)
Here:
$6,000
State:
$4,753
Here:
6.9% of AGI
State:
4.2% of AGI
Total tax: $6,668 (reported on 68.6% of returns)
79739:
$6,668
State:
$9,058
(% of AGI for various income ranges: 2.9% for AGIs $10k-25k, 6.1% for AGIs $25k-50k, 9.1% for AGIs $50k-75k, 9.9% for AGIs $75k-100k, 19.8% for AGIs over 100k)
Earned income credit: $2,212 (reported on 20.2% of returns)
Here:
$2,212
State:
$2,024
Percentage of individuals using paid preparers for their 2004 taxes: 85.3%
Here:
85%
State:
57%
(% for various income ranges: 84.0% for AGIs below $10k, 88.2% for AGIs $10k-25k, 79.6% for AGIs $25k-50k, 80.4% for AGIs $50k-75k, 95.8% for AGIs $75k-100k, 94.6% for AGIs over 100k)
Household received Food Stamps/SNAP in the past 12 months: 28 Household did not receive Food Stamps/SNAP in the past 12 months: 339
Women who did not have a birth in the past 12 months: 181 (171 now married, 7 unmarried)
Housing units in zip code 79739 with a mortgage: 60 Median monthly owner costs for units with a mortgage: $839 Median monthly owner costs for units without a mortgage: $675
Residents with income below the poverty level in 2022:
This zip code:
4.8%
Whole state:
14.0%
Residents with income below 50% of the poverty level in 2022:
This zip code:
0.9%
Whole state:
7.4%
Median number of rooms in houses and condos:
Here:
6.0
State:
6.3
Median number of rooms in apartments:
Here:
4.8
State:
4.0
Notable locations in this zip code not listed on our city pages
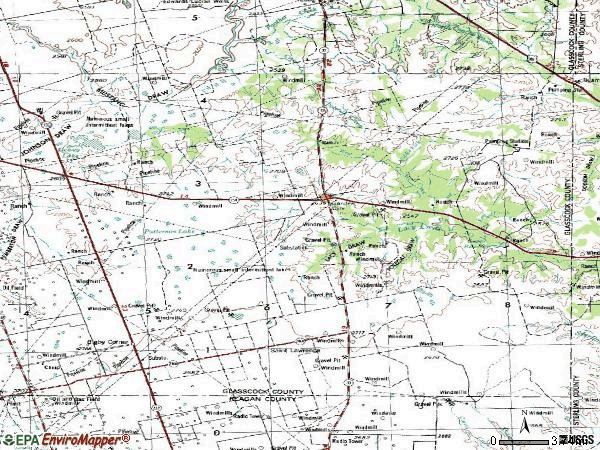
Lakes and reservoirs: Hackberry Lake (A), Patterson Lake (B), Rock Hole (C), Blissard Lake (D), Currie Reservoir (E). Display/hide their locations on the map
Size of family households: 169 2-persons, 32 3-persons, 44 4-persons, 6 5-persons, 9 6-persons, 52 7-or-more-persons
Size of nonfamily households: 45 1-person, 10 2-persons
212 married couples with children.
17 single-parent households (17 men).
70.3% of residents of 79739 zip code speak English at home.
20.8% of residents speak Spanish at home (46% very well, 14% well, 20% not well, 20% not at all).
3.4% of residents speak other Indo-European language at home (100% very well).
5.2% of residents speak other language at home (100% very well).
Foreign born population: 105 (11.0%) (8.3% of them are naturalized citizens)
This zip code:
11.0%
Whole state:
17.2%
88%Honduras
10%Uruguay
25%German
7%Scotch-Irish
7%Jordanian
4%English
1%Czech
1%American
1%Syrian
Year of entry for the foreign-born population
112010 or later
702000 to 2009
381990 to 1999
7Before 1990
Facilities with environmental interests located in this zip code:
ADOBE GAS GATHERING & PROCESSING CO (7 MI E. OF GARDEN CITY HWY 158 in GARDEN CITY, TX)
AIR MINOR (AIRS/AFS) Business SIC classification: NATURAL GAS LIQUIDS
Housing units lacking complete plumbing facilities: 8.3% Housing units lacking complete kitchen facilities: 8.2%
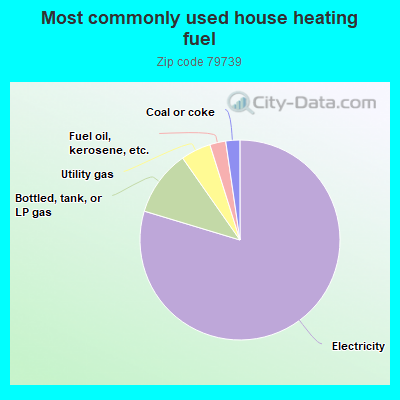
80.3%Electricity
10.7%Bottled, tank, or LP gas
4.9%Utility gas
2.6%Fuel oil, kerosene, etc.
2.3%Coal or coke
Population in 1990: 1,447.
Place of birth for U.S.-born residents:
This state: 707
Midwest: 87
South: 17
West: 9
81% of the 79739 zip code residents lived in the same house 5 years ago. Out of people who lived in different houses, 42% lived in this county. Out of people who lived in different counties, 50% lived in Texas.
92% of the 79739 zip code residents lived in the same house 1 year ago. Out of people who lived in different houses, 78% moved from this county. Out of people who lived in different houses, 20% moved from abroad.
Private vs. public school enrollment:
Students in private schools in grades 1 to 8 (elementary and middle school):
Here:
0.0%
Texas:
8.8%
Students in private schools in grades 9 to 12 (high school):
Here:
0.0%
Texas:
8.0%
Students in private undergraduate colleges:
Here:
0.0%
Texas:
16.2%
Occupation by median earnings in the past 12 months ($)
67,882Management occupations
63,770Office and administrative support occupations
40,182Construction and extraction occupations
38,906Installation, maintenance, and repair occupations
27,628Farming, fishing, and forestry occupations
Top industries in this zip code by the number of employees in 2005:
Wholesale Trade: Farm and Garden Machinery and Equipment Merchant Wholesalers (20-49 employees: 1 establishment)
Construction: All Other Specialty Trade Contractors (1-4: 1)
Professional, Scientific, and Technical Services: Title Abstract and Settlement Offices (1-4: 1)
Other Services (except Public Administration): Religious Organizations (1-4: 1)
Finance and Insurance: Commercial Banking (1-4: 1)
Other Services (except Public Administration): General Automotive Repair (1-4: 1)
Fatal accident statistics in 2014:
Fatal accident count: 1
Vehicles involved in fatal accidents: 2
Fatal accidents caused by drunken drivers: 0
Fatalities: 1
Persons involved in fatal accidents: 3
Pedestrians involved in fatal accidents: 0
Fatal accident statistics in 2013:
Fatal accident count: 1
Vehicles involved in fatal accidents: 2
Fatal accidents caused by drunken drivers: 0
Fatalities: 1
Persons involved in fatal accidents: 2
Pedestrians involved in fatal accidents: 0
Most common first names in zip code 79739 among deceased individuals
Name
Count
Lived (average)
James
4
84.4 years
William
3
79.7 years
Charles
2
80.4 years
Fred
2
80.5 years
Alfred
2
65.5 years
John
2
81.5 years
Alma
2
89.6 years
Clyde
2
84.5 years
Mae
2
83.1 years
Martha
2
76.5 years
Most common last names in zip code 79739 among deceased individuals
Last name
Count
Lived (average)
Cook
5
81.8 years
Ratliff
5
81.4 years
Hoelscher
4
80.5 years
Jurecek
3
83.3 years
Pearce
3
76.3 years
Cox
3
83.0 years
Wilkerson
3
93.1 years
Helwig
3
88.7 years
Chandler
2
66.0 years
Koenning
2
76.4 years
Discuss Garden City, Texas (TX) on our hugely popular Texas forum.


 Nearest zip codes: 79733, 76951, 79755, 79720, 79782, 76932.