Estimated zip code population in 2022: 2,466 Zip code population in 2010: 1,759 Zip code population in 2000: 1,407
Houses and condos: 1,313 Renter-occupied apartments: 30
% of renters here:
3%
State:
34%
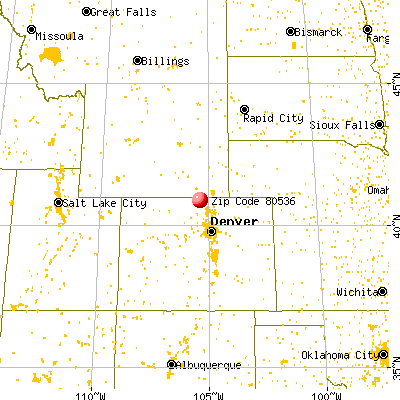
March 2022 cost of living index in zip code 80536: 92.6 (less than average, U.S. average is 100)
Land area: 367.6 sq. mi. Water area: 0.7 sq. mi.
Population density: 7 people per square mile
(very low).
OSM Map
General Map
Google Map
MSN Map
OSM Map
General Map
Google Map
MSN Map
OSM Map
General Map
Google Map
MSN Map
OSM Map
General Map
Google Map
MSN Map
Please wait while loading the map...
Real estate property taxes paid for housing units in 2022:
This zip code:
0.5% ($2,830)
Colorado:
0.5% ($2,422)
Median real estate property taxes paid for housing units with mortgages in 2022: $2,466 (0.4%) Median real estate property taxes paid for housing units with no mortgage in 2022: $3,508 (0.5%)
Business Search- 14 Million verified businesses
Males: 1,185
(48.1%)
Females: 1,280
(51.9%)
For population 25 years and over in 80536:
High school or higher: 98.9%
Bachelor's degree or higher: 57.7%
Graduate or professional degree: 22.9%
Unemployed: 5.1%
Mean travel time to work (commute): 48.1 minutes
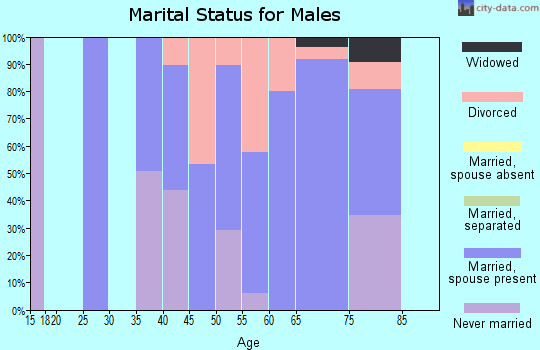
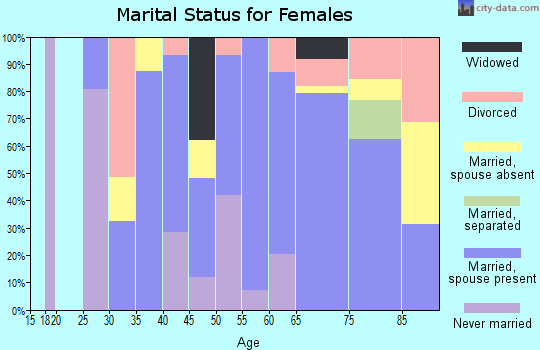
For population 15 years and over in 80536:
Never married: 16.2%
Now married: 76.3%
Separated: 0.0%
Widowed: 1.2%
Divorced: 6.2%
Zip code 80536 compared to state average:
Black race population percentage significantly below state average.
Hispanic race population percentage below state average.
Median age significantly above state average.
Foreign-born population percentage significantly below state average.
Renting percentage significantly below state average.
Length of stay since moving in significantly above state average.
Estimated median house/condo value in 2022: $612,264
80536:
$612,264
Colorado:
$531,100
According to our research of Colorado and other state lists, there were 4 registered sex offenders living in 80536 zip code as of May 21, 2024. The ratio of all residents to sex offenders in zip code 80536 is 574 to 1. The ratio of registered sex offenders to all residents in this zip code is lower than the state average.
Median resident age:
This zip code:
47.6 years
Colorado median age:
37.7 years
Average household size:
This zip code:
2.4 people
Colorado:
2.4 people
Averages for the 2020 tax year for zip code 80536, filed in 2021:
Average Adjusted Gross Income (AGI) in 2020: $93,299 (Individual Income Tax Returns)
Here:
$93,299
State:
$89,260
Salary/wage: $74,382 (reported on 71.3% of returns)
Here:
$74,382
State:
$70,330
(% of AGI for various income ranges: 980.8% for AGIs below $25k, 3739.0% for AGIs $25k-50k, 5713.3% for AGIs $50k-75k, 9362.9% for AGIs $75k-100k, 18974.5% for AGIs $100k-200k, 61270.0% for AGIs over 200k)
Taxable interest for individuals: $1,138 (reported on 47.9% of returns)
This zip code:
$1,138
Colorado:
$2,176
(% of AGI for various income ranges: 74.6% for AGIs below $25k, 55.0% for AGIs $25k-50k, 60.0% for AGIs $50k-75k, 118.6% for AGIs $75k-100k, 151.8% for AGIs $100k-200k, 280.0% for AGIs over 200k)
Ordinary dividends: $4,948 (reported on 33.0% of returns)
Here:
$4,948
State:
$8,820
(% of AGI for various income ranges: 86.9% for AGIs below $25k, 107.0% for AGIs $25k-50k, 270.0% for AGIs $50k-75k, 242.9% for AGIs $75k-100k, 363.6% for AGIs $100k-200k, 2505.0% for AGIs over 200k)
Net capital gain/loss in AGI: +$13,848 (reported on 28.7% of returns)
Here:
+$13,848
State:
+$37,276
(% of AGI for various income ranges: 36.2% for AGIs below $25k, 136.0% for AGIs $25k-50k, 275.6% for AGIs $50k-75k, 298.6% for AGIs $75k-100k, 1037.3% for AGIs $100k-200k, 9790.0% for AGIs over 200k)
Profit/loss from business: +$6,822 (reported on 24.5% of returns)
Here:
+$6,822
State:
+$15,295
(% of AGI for various income ranges: 320.8% for AGIs below $25k, 356.0% for AGIs $25k-50k, 532.2% for AGIs $50k-75k, 52.9% for AGIs $75k-100k, 254.5% for AGIs $100k-200k)
Taxable individual retirement arrangement distribution: $29,368 (reported on 20.2% of returns)
80536:
$29,368
Colorado:
$23,785
(% of AGI for various income ranges: 174.6% for AGIs below $25k, 449.0% for AGIs $25k-50k, 653.3% for AGIs $50k-75k, 908.6% for AGIs $75k-100k, 3345.5% for AGIs $100k-200k)
Total itemized deductions: $37,346 (reported on 13.8% of returns)
Here:
$37,346
State:
$35,141
(% of AGI for various income ranges: 829.0% for AGIs $25k-50k, 868.6% for AGIs $75k-100k, 1370.0% for AGIs $100k-200k, 9555.0% for AGIs over 200k)
Charity contributions: $10,090 (reported on 10.6% of returns)
Here:
$10,090
State:
$12,103
(% of AGI for various income ranges: 193.3% for AGIs $50k-75k, 238.2% for AGIs $100k-200k, 2865.0% for AGIs over 200k)
Taxes paid: $7,800 (reported on 13.8% of returns)
80536:
$7,800
State:
$7,710
(% of AGI for various income ranges: 150.0% for AGIs $25k-50k, 205.7% for AGIs $75k-100k, 370.0% for AGIs $100k-200k, 1565.0% for AGIs over 200k)
Earned income credit: $1,700 (reported on 7.4% of returns)
Here:
$1,700
State:
$2,053
(% of AGI for various income ranges: 91.5% for AGIs below $25k)
Percentage of individuals using paid preparers for their 2020 taxes: 92.6%
Here:
93%
State:
93%
(% for various income ranges: 90.9% for AGIs below $25k, 94.1% for AGIs $25k-50k, 92.9% for AGIs $50k-75k, 91.7% for AGIs $75k-100k, 91.3% for AGIs $100k-200k, 100.0% for AGIs over 200k)
Averages for the 2012 tax year for zip code 80536, filed in 2013:
Average Adjusted Gross Income (AGI) in 2012: $69,105 (Individual Income Tax Returns)
Here:
$69,105
State:
$69,103
Salary/wage: $58,469 (reported on 67.9% of returns)
Here:
$58,469
State:
$54,794
(% of AGI for various income ranges: 58.9% for AGIs below $25k, 55.5% for AGIs $25k-50k, 65.0% for AGIs $50k-75k, 60.5% for AGIs $75k-100k, 61.0% for AGIs $100k-200k, 46.3% for AGIs over 200k)
Taxable interest for individuals: $1,292 (reported on 48.1% of returns)
This zip code:
$1,292
Colorado:
$1,971
(% of AGI for various income ranges: 3.8% for AGIs below $25k, 0.8% for AGIs $25k-50k, 0.7% for AGIs $50k-75k, 1.7% for AGIs $75k-100k, 0.5% for AGIs $100k-200k, 0.4% for AGIs over 200k)
Ordinary dividends: $2,981 (reported on 32.1% of returns)
Here:
$2,981
State:
$7,140
(% of AGI for various income ranges: 3.4% for AGIs below $25k, 2.7% for AGIs $25k-50k, 0.8% for AGIs $50k-75k, 1.2% for AGIs $75k-100k, 1.5% for AGIs $100k-200k, 0.7% for AGIs over 200k)
Net capital gain/loss in AGI: +$20,904 (reported on 28.4% of returns)
Here:
+$20,904
State:
+$23,009
(% of AGI for various income ranges: 0.6% for AGIs $25k-50k, 0.1% for AGIs $50k-75k, 2.6% for AGIs $75k-100k, 3.9% for AGIs $100k-200k, 30.3% for AGIs over 200k)
Profit/loss from business: +$10,640 (reported on 24.7% of returns)
Here:
+$10,640
State:
+$13,514
(% of AGI for various income ranges: 11.4% for AGIs below $25k, 11.3% for AGIs $25k-50k, 1.7% for AGIs $50k-75k, 2.1% for AGIs $75k-100k, 4.8% for AGIs $100k-200k)
Taxable individual retirement arrangement distribution: $18,253 (reported on 21.0% of returns)
80536:
$18,253
Colorado:
$17,927
(% of AGI for various income ranges: 9.1% for AGIs below $25k, 6.8% for AGIs $25k-50k, 5.3% for AGIs $50k-75k, 4.9% for AGIs $75k-100k, 9.2% for AGIs $100k-200k)
Total itemized deductions: $22,267 (23% of AGI, reported on 51.9% of returns)
Here:
$22,267
State:
$24,621
Here:
23.3% of AGI
State:
18.5% of AGI
(% of AGI for various income ranges: 38.9% for AGIs below $25k, 19.8% for AGIs $25k-50k, 22.8% for AGIs $50k-75k, 15.5% for AGIs $75k-100k, 14.5% for AGIs $100k-200k, 10.6% for AGIs over 200k)
Charity contributions: $2,909 (reported on 40.7% of returns)
Here:
$2,909
State:
$4,449
(% of AGI for various income ranges: 1.4% for AGIs below $25k, 1.8% for AGIs $25k-50k, 2.1% for AGIs $50k-75k, 2.3% for AGIs $75k-100k, 1.4% for AGIs $100k-200k, 1.4% for AGIs over 200k)
Taxes paid: $6,007 (reported on 50.6% of returns)
80536:
$6,007
State:
$7,641
(% of AGI for various income ranges: 4.7% for AGIs below $25k, 3.5% for AGIs $25k-50k, 4.0% for AGIs $50k-75k, 4.2% for AGIs $75k-100k, 4.6% for AGIs $100k-200k, 4.9% for AGIs over 200k)
Earned income credit: $1,371 (reported on 8.6% of returns)
Here:
$1,371
State:
$2,095
(% of AGI for various income ranges: 3.6% for AGIs below $25k)
Percentage of individuals using paid preparers for their 2012 taxes: 51.9%
Here:
52%
State:
49%
(% for various income ranges: 45.8% for AGIs below $25k, 56.2% for AGIs $25k-50k, 53.8% for AGIs $50k-75k, 54.5% for AGIs $75k-100k, 46.2% for AGIs $100k-200k, 75.0% for AGIs over 200k)
Averages for the 2004 tax year for zip code 80536, filed in 2005:
Average Adjusted Gross Income (AGI) in 2004: $52,928 (Individual Income Tax Returns)
Here:
$52,928
State:
$55,014
Salary/wage: $48,460 (reported on 76.9% of returns)
Here:
$48,460
State:
$46,010
(% of AGI for various income ranges: 56.3% for AGIs $10k-25k, 71.7% for AGIs $25k-50k, 77.8% for AGIs $50k-75k, 68.5% for AGIs $75k-100k, 64.7% for AGIs over 100k)
Taxable interest for individuals: $1,567 (reported on 58.9% of returns)
This zip code:
$1,567
Colorado:
$2,127
(% of AGI for various income ranges: 2.9% for AGIs $10k-25k, 2.1% for AGIs $25k-50k, 0.9% for AGIs $50k-75k, 1.2% for AGIs $75k-100k, 1.7% for AGIs over 100k)
Taxable dividends: $1,468 (reported on 36.0% of returns)
Here:
$1,468
State:
$3,782
(% of AGI for various income ranges: 1.2% for AGIs $10k-25k, 1.5% for AGIs $25k-50k, 0.6% for AGIs $50k-75k, 1.2% for AGIs $75k-100k, 0.7% for AGIs over 100k)
Net capital gain/loss: +$8,583 (reported on 29.8% of returns)
Here:
+$8,583
State:
+$17,882
(% of AGI for various income ranges: 2.8% for AGIs $10k-25k, 2.1% for AGIs $25k-50k, 0.2% for AGIs $50k-75k, 2.1% for AGIs $75k-100k, 10.2% for AGIs over 100k)
Profit/loss from business: +$8,844 (reported on 30.8% of returns)
Here:
+$8,844
State:
+$11,247
(% of AGI for various income ranges: 14.2% for AGIs $10k-25k, 8.8% for AGIs $25k-50k, 3.4% for AGIs $50k-75k, 8.6% for AGIs $75k-100k, 1.6% for AGIs over 100k)
IRA payment deduction: $3,087 (reported on 2.9% of returns)
80536:
$3,087
Colorado:
$2,947
Total itemized deductions: $19,744 (26% of AGI, reported on 56.6% of returns)
Here:
$19,744
State:
$20,560
Here:
26.2% of AGI
State:
21.4% of AGI
(% of AGI for various income ranges: 31.8% for AGIs $10k-25k, 25.6% for AGIs $25k-50k, 23.0% for AGIs $50k-75k, 21.3% for AGIs $75k-100k, 15.2% for AGIs over 100k)
Charity contributions deductions: $2,120 (3% of AGI, reported on 46.6% of returns)
Here:
$2,120
State:
$3,518
Here:
2.6% of AGI
State:
3.4% of AGI
(% of AGI for various income ranges: 2.4% for AGIs $10k-25k, 2.0% for AGIs $25k-50k, 1.6% for AGIs $50k-75k, 1.9% for AGIs $75k-100k, 1.9% for AGIs over 100k)
Total tax: $7,620 (reported on 80.2% of returns)
80536:
$7,620
State:
$9,173
(% of AGI for various income ranges: 5.2% for AGIs $10k-25k, 7.0% for AGIs $25k-50k, 9.0% for AGIs $50k-75k, 10.8% for AGIs $75k-100k, 15.9% for AGIs over 100k)
Earned income credit: $1,121 (reported on 8.4% of returns)
Here:
$1,121
State:
$1,595
Percentage of individuals using paid preparers for their 2004 taxes: 56.9%
Here:
57%
State:
55%
(% for various income ranges: 53.6% for AGIs below $10k, 54.4% for AGIs $10k-25k, 57.4% for AGIs $25k-50k, 63.9% for AGIs $50k-75k, 59.7% for AGIs $75k-100k, 50.9% for AGIs over 100k)
Likely homosexual households (counted as self-reported same-sex unmarried-partner households)
Lesbian couples: 1.1% of all households
Gay men: 0.0% of all households
Household received Food Stamps/SNAP in the past 12 months: 8 Household did not receive Food Stamps/SNAP in the past 12 months: 1,013
Women who had a birth in the past 12 months: 26 (27 now married, 0 unmarried) Women who did not have a birth in the past 12 months: 509 (286 now married, 220 unmarried)
Housing units in zip code 80536 with a mortgage: 628 (42 second mortgage, 37 both second mortgage and home equity loan) Median monthly owner costs for units with a mortgage: $2,244 Median monthly owner costs for units without a mortgage: $656
Residents with income below the poverty level in 2022:
This zip code:
4.6%
Whole state:
9.4%
Residents with income below 50% of the poverty level in 2022:
This zip code:
2.5%
Whole state:
4.6%
Median number of rooms in houses and condos:
Here:
6.6
State:
6.8
Median number of rooms in apartments:
Here:
5.2
State:
4.0
Notable locations in this zip code not listed on our city pages
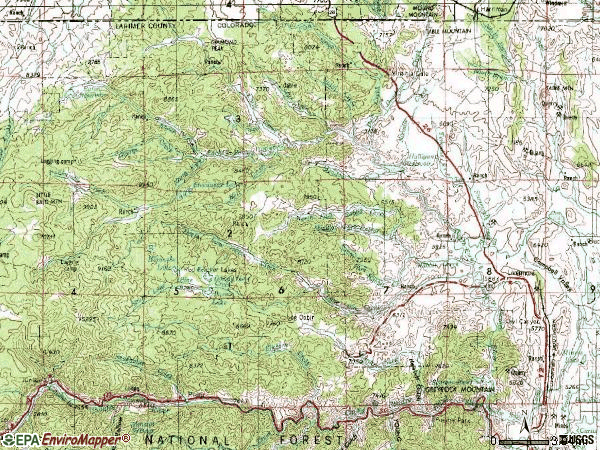
Notable locations in zip code 80536: Stevens Gulch Campground (A), Stove Prairie Landing Campground (B), Upper Landing Campground (C), Eggers Rest Area (D), Mount McConnel Trailhead (E), Trails End (F), Maxwell Ranch (G), Virginia Dale (H), Overland Trail Stage Station (I), Logan Ranch (J), Cherokee Ranch (K), Trail Creek Ranch (L), Spring Hill Ranch (M), Livermore (N), Log Cabin (O), Glacier View Fire District (P), Livermore Fire Protection District Station 2 Cherokee Park (Q). Display/hide their locations on the map
Cemeteries: Elliott Ranch Cemetery (1), Boyd Family Cemetery (2), Azuba Batterson Grave (3), Adams Cemetery (4), Abbey of Saint Walburga Cemetery (5), Lamb Family Cemetery (6), Christopher Charles Cradock Grave (7). Display/hide their locations on the map
Lakes and reservoirs: Tibbits Lake (A), Floodwater Retention Reservoir B-5 (B), Upper Stonewall Reservoir (C), Kelsey Lake (D), Halligan Reservoir (E). Display/hide their locations on the map
Creeks: Sheep Creek (A), George Creek (B), Acme Creek (C), Pratt Creek (D), Hanse Creek (E), Willow Creek (F), Fish Creek (G), Mud Creek (H), Divide Creek (I). Display/hide their locations on the map
In group quarters: 41 (-1 institutionalized population)
Size of family households: 508 2-persons, 123 3-persons, 130 4-persons, 35 5-persons, 10 6-persons
Size of nonfamily households: 196 1-person, 12 2-persons, 8 4-persons
490 married couples with children.
0 single-parent households ().
99.2% of residents of 80536 zip code speak English at home.
1.2% of residents speak Spanish at home (100% very well).
0.3% of residents speak other Indo-European language at home (100% very well).
Foreign born population: 14 (0.6%) (100.0% of them are naturalized citizens)
This zip code:
0.6%
Whole state:
9.5%
50%France
38%German
19%English
13%American
7%French
5%Irish
3%Italian
3%Norwegian
Year of entry for the foreign-born population
02010 or later
02000 to 2009
01990 to 1999
49Before 1990
Facilities with environmental interests located in this zip code:
GLACIER VIEW MEADOWS WATER AND SEWER ASSOCIATION INCORPORATED (1417 GREEN MOUNTAIND DRIVE in LIVERMORE, CO)
STATE MASTER (Colorado database) - NPDES-CO0046442, NPDES NON-MAJOR National Pollutant Discharge Elimination System NON-MAJOR (Tracking pollutant discharge elimination systems) - permit Business SIC classification: SEWERAGE SYSTEMS Alternative names: GLACIER VIEW MEADOW W&S ASSN., GLACIER VIEW MEADOWS W&S ASSN.
BIXBY EXCAVATING (11 MI W OF LIVERMORE ON RD 74E in FORT COLLINS, 18.6 MI NW OF, CO)
AIR MINOR (AIRS/AFS) Business SIC classification: CONSTRUCTION SAND AND GRAVEL
Housing units lacking complete plumbing facilities: 5.2% Housing units lacking complete kitchen facilities: 5.5%
51.9%Bottled, tank, or LP gas
18.4%Wood
15.4%Electricity
11.7%Utility gas
2.7%Other fuel
Population in 1990: 513. Population change in the 1990s: +894 (+174.3%).
Place of birth for U.S.-born residents:
This state: 973
Northeast: 138
Midwest: 697
South: 240
West: 362
27% of the 80536 zip code residents lived in the same house 5 years ago. Out of people who lived in different houses, 47% lived in this county. Out of people who lived in different counties, 50% lived in Colorado.
95% of the 80536 zip code residents lived in the same house 1 year ago. Out of people who lived in different houses, 93% moved from different county within same state. Out of people who lived in different houses, 23% moved from different state.
Private vs. public school enrollment:
Students in private schools in grades 1 to 8 (elementary and middle school): 33
Here:
27.5%
Colorado:
11.4%
Students in private schools in grades 9 to 12 (high school): 36
Here:
28.8%
Colorado:
8.5%
Students in private undergraduate colleges: 8
Here:
53.4%
Colorado:
14.0%
Occupation by median earnings in the past 12 months ($)
213,121Sales and related occupations
77,980Management occupations
75,296Installation, maintenance, and repair occupations
73,718Architecture and engineering occupations
73,375Health diagnosing and treating practitioners and other technical occupations
65,440Life, physical, and social science occupations
Companies with federal contracts located in this zip code:
NELSON, LANCE (450 MOUNT BLANC RD in LIVERMORE, CO; small business)
$13,538 with Department of Defense for Miscellaneous Printed Matter. Signed on 2005-09-14. Completion date: 2005-10-18.
Top industries in this zip code by the number of employees in 2005:
Mining: Crushed and Broken Limestone Mining and Quarrying (20-49 employees: 1 establishment)
Other Services (except Public Administration): Religious Organizations (10-19: 1, 1-4: 1)
Construction: New Single-Family Housing Construction (except Operative Builders) (5-9: 1, 1-4: 3)
Other Services (except Public Administration): Other Similar Organizations (except Business, Professional, Labor, and Political Organizations) (5-9: 1, 1-4: 1)
Accommodation and Food Services: Full-Service Restaurants (5-9: 1, 1-4: 1)
Health Care and Social Assistance: Offices of Physicians (except Mental Health Specialists) (5-9: 1)
Utilities: Water Supply and Irrigation Systems (5-9: 1)
Real Estate and Rental and Leasing: Offices of Real Estate Agents and Brokers (5-9: 1)
Accommodation and Food Services: Recreational and Vacation Camps (except Campgrounds) (1-4: 3)
People in group quarters in 2010:
22 people in other noninstitutional facilities
People in group quarters in 2000:
21 people in other group homes
Fatal accident statistics in 2014:
Fatal accident count: 2
Vehicles involved in fatal accidents: 3
Fatal accidents caused by drunken drivers: 0
Fatalities: 3
Persons involved in fatal accidents: 6
Pedestrians involved in fatal accidents: 0
Fatal accident statistics in 2013:
Fatal accident count: 1
Vehicles involved in fatal accidents: 1
Fatal accidents caused by drunken drivers: 1
Fatalities: 1
Persons involved in fatal accidents: 2
Pedestrians involved in fatal accidents: 0
Home Mortgage Disclosure Act Aggregated Statistics For Year 2009 (Based on 4 partial tracts)
A) FHA, FSA/RHS & VA Home Purchase Loans
B) Conventional Home Purchase Loans
C) Refinancings
D) Home Improvement Loans
F) Non-occupant Loans on < 5 Family Dwellings (A B C & D)
G) Loans On Manufactured Home Dwelling (A B C & D)
Number
Average Value
Number
Average Value
Number
Average Value
Number
Average Value
Number
Average Value
Number
Average Value
LOANS ORIGINATED
80
$199,991
98
$248,562
474
$240,711
11
$169,324
73
$183,041
14
$138,064
APPLICATIONS APPROVED, NOT ACCEPTED
5
$196,202
8
$267,142
42
$259,744
1
$157,640
8
$190,498
2
$131,880
APPLICATIONS DENIED
13
$199,668
14
$195,386
117
$251,423
5
$116,628
17
$180,852
6
$126,102
APPLICATIONS WITHDRAWN
13
$189,488
16
$298,754
93
$222,884
6
$167,987
10
$169,963
4
$104,785
FILES CLOSED FOR INCOMPLETENESS
0
$0
3
$311,267
17
$244,525
1
$103,290
0
$0
0
$0
Aggregated Statistics For Year 2008 (Based on 4 partial tracts)
A) FHA, FSA/RHS & VA Home Purchase Loans
B) Conventional Home Purchase Loans
C) Refinancings
D) Home Improvement Loans
F) Non-occupant Loans on < 5 Family Dwellings (A B C & D)
G) Loans On Manufactured Home Dwelling (A B C & D)
Number
Average Value
Number
Average Value
Number
Average Value
Number
Average Value
Number
Average Value
Number
Average Value
LOANS ORIGINATED
50
$199,030
149
$252,725
223
$232,647
16
$91,641
65
$178,320
8
$167,595
APPLICATIONS APPROVED, NOT ACCEPTED
1
$240,430
13
$230,687
31
$236,915
2
$24,325
4
$278,515
3
$113,550
APPLICATIONS DENIED
8
$201,924
27
$265,449
120
$225,116
19
$57,618
17
$199,769
7
$118,533
APPLICATIONS WITHDRAWN
6
$214,232
18
$194,921
57
$222,082
3
$59,817
6
$209,780
3
$158,840
FILES CLOSED FOR INCOMPLETENESS
0
$0
0
$0
11
$304,102
2
$165,285
1
$167,130
0
$0
Aggregated Statistics For Year 2007 (Based on 4 partial tracts)
A) FHA, FSA/RHS & VA Home Purchase Loans
B) Conventional Home Purchase Loans
C) Refinancings
D) Home Improvement Loans
F) Non-occupant Loans on < 5 Family Dwellings (A B C & D)
G) Loans On Manufactured Home Dwelling (A B C & D)
Number
Average Value
Number
Average Value
Number
Average Value
Number
Average Value
Number
Average Value
Number
Average Value
LOANS ORIGINATED
18
$194,503
295
$199,363
249
$212,495
31
$77,691
92
$183,614
17
$135,246
APPLICATIONS APPROVED, NOT ACCEPTED
2
$188,490
29
$199,052
55
$223,089
6
$156,107
10
$163,449
2
$148,855
APPLICATIONS DENIED
4
$201,020
38
$188,849
191
$200,875
27
$89,498
24
$181,899
13
$164,334
APPLICATIONS WITHDRAWN
1
$117,550
24
$217,263
60
$207,305
4
$150,295
9
$195,316
1
$231,750
FILES CLOSED FOR INCOMPLETENESS
0
$0
3
$277,087
22
$249,896
1
$177,430
0
$0
0
$0
Aggregated Statistics For Year 2006 (Based on 4 partial tracts)
A) FHA, FSA/RHS & VA Home Purchase Loans
B) Conventional Home Purchase Loans
C) Refinancings
D) Home Improvement Loans
F) Non-occupant Loans on < 5 Family Dwellings (A B C & D)
G) Loans On Manufactured Home Dwelling (A B C & D)
Number
Average Value
Number
Average Value
Number
Average Value
Number
Average Value
Number
Average Value
Number
Average Value
LOANS ORIGINATED
19
$191,886
368
$184,602
352
$210,977
34
$64,816
133
$166,837
13
$137,962
APPLICATIONS APPROVED, NOT ACCEPTED
0
$0
34
$203,265
56
$229,203
7
$55,879
13
$218,122
4
$95,410
APPLICATIONS DENIED
3
$137,563
63
$226,670
223
$243,435
30
$121,904
26
$210,854
16
$131,746
APPLICATIONS WITHDRAWN
2
$142,550
51
$200,924
122
$212,687
8
$83,414
14
$142,153
2
$191,775
FILES CLOSED FOR INCOMPLETENESS
0
$0
9
$224,872
14
$269,689
0
$0
2
$146,980
0
$0
Aggregated Statistics For Year 2005 (Based on 4 partial tracts)
A) FHA, FSA/RHS & VA Home Purchase Loans
B) Conventional Home Purchase Loans
C) Refinancings
D) Home Improvement Loans
F) Non-occupant Loans on < 5 Family Dwellings (A B C & D)
G) Loans On Manufactured Home Dwelling (A B C & D)
Number
Average Value
Number
Average Value
Number
Average Value
Number
Average Value
Number
Average Value
Number
Average Value
LOANS ORIGINATED
24
$175,600
429
$171,066
374
$215,052
27
$105,002
109
$161,335
14
$131,695
APPLICATIONS APPROVED, NOT ACCEPTED
2
$197,725
30
$169,881
55
$231,442
4
$78,202
13
$211,318
4
$94,008
APPLICATIONS DENIED
4
$158,380
73
$174,325
244
$213,552
29
$102,010
23
$183,133
17
$152,026
APPLICATIONS WITHDRAWN
3
$216,193
80
$184,373
142
$217,723
7
$163,947
21
$200,055
8
$183,984
FILES CLOSED FOR INCOMPLETENESS
1
$153,140
7
$158,631
39
$253,391
2
$50,445
3
$196,460
0
$0
Aggregated Statistics For Year 2004 (Based on 4 partial tracts)
A) FHA, FSA/RHS & VA Home Purchase Loans
B) Conventional Home Purchase Loans
C) Refinancings
D) Home Improvement Loans
F) Non-occupant Loans on < 5 Family Dwellings (A B C & D)
G) Loans On Manufactured Home Dwelling (A B C & D)
Number
Average Value
Number
Average Value
Number
Average Value
Number
Average Value
Number
Average Value
Number
Average Value
LOANS ORIGINATED
31
$183,618
356
$184,250
405
$212,149
30
$61,905
98
$156,486
16
$115,901
APPLICATIONS APPROVED, NOT ACCEPTED
0
$0
41
$179,579
61
$206,558
5
$51,102
10
$208,150
6
$116,240
APPLICATIONS DENIED
3
$166,923
69
$183,653
206
$212,123
23
$64,691
22
$182,507
24
$99,312
APPLICATIONS WITHDRAWN
2
$178,135
42
$185,179
128
$228,421
5
$76,416
13
$154,844
2
$114,940
FILES CLOSED FOR INCOMPLETENESS
0
$0
4
$180,535
36
$237,989
1
$168,780
2
$155,795
0
$0
Aggregated Statistics For Year 2003 (Based on 4 partial tracts)
A) FHA, FSA/RHS & VA Home Purchase Loans
B) Conventional Home Purchase Loans
C) Refinancings
D) Home Improvement Loans
F) Non-occupant Loans on < 5 Family Dwellings (A B C & D)
Number
Average Value
Number
Average Value
Number
Average Value
Number
Average Value
Number
Average Value
LOANS ORIGINATED
26
$169,458
241
$196,130
876
$200,974
22
$43,971
104
$162,061
APPLICATIONS APPROVED, NOT ACCEPTED
0
$0
26
$164,250
96
$182,821
4
$54,782
8
$150,364
APPLICATIONS DENIED
3
$223,097
49
$152,825
227
$209,518
15
$38,519
17
$144,962
APPLICATIONS WITHDRAWN
2
$138,275
27
$218,174
149
$184,109
2
$111,175
11
$131,674
FILES CLOSED FOR INCOMPLETENESS
0
$0
5
$148,782
24
$197,240
1
$32,270
2
$113,595
Aggregated Statistics For Year 2002 (Based on 4 partial tracts)
A) FHA, FSA/RHS & VA Home Purchase Loans
B) Conventional Home Purchase Loans
C) Refinancings
D) Home Improvement Loans
F) Non-occupant Loans on < 5 Family Dwellings (A B C & D)
Number
Average Value
Number
Average Value
Number
Average Value
Number
Average Value
Number
Average Value
LOANS ORIGINATED
25
$163,659
266
$186,401
705
$197,160
32
$34,545
81
$154,142
APPLICATIONS APPROVED, NOT ACCEPTED
2
$129,265
33
$174,111
98
$190,320
9
$39,634
6
$207,355
APPLICATIONS DENIED
3
$144,063
48
$137,841
174
$174,133
12
$25,524
8
$173,145
APPLICATIONS WITHDRAWN
1
$122,510
20
$199,730
122
$174,784
5
$42,068
7
$134,231
FILES CLOSED FOR INCOMPLETENESS
0
$0
7
$241,966
46
$209,628
0
$0
2
$220,970
Aggregated Statistics For Year 2001 (Based on 4 partial tracts)
A) FHA, FSA/RHS & VA Home Purchase Loans
B) Conventional Home Purchase Loans
C) Refinancings
D) Home Improvement Loans
F) Non-occupant Loans on < 5 Family Dwellings (A B C & D)
Number
Average Value
Number
Average Value
Number
Average Value
Number
Average Value
Number
Average Value
LOANS ORIGINATED
35
$151,993
294
$160,817
521
$181,218
38
$33,694
66
$144,367
APPLICATIONS APPROVED, NOT ACCEPTED
2
$148,405
35
$154,406
60
$145,705
6
$44,063
6
$154,083
APPLICATIONS DENIED
2
$115,820
69
$80,738
146
$158,767
18
$41,986
10
$125,703
APPLICATIONS WITHDRAWN
2
$129,030
33
$172,277
91
$166,932
7
$49,666
5
$129,474
FILES CLOSED FOR INCOMPLETENESS
1
$216,190
10
$156,248
31
$189,386
4
$27,585
2
$129,370
Aggregated Statistics For Year 2000 (Based on 4 partial tracts)
A) FHA, FSA/RHS & VA Home Purchase Loans
B) Conventional Home Purchase Loans
C) Refinancings
D) Home Improvement Loans
F) Non-occupant Loans on < 5 Family Dwellings (A B C & D)
Number
Average Value
Number
Average Value
Number
Average Value
Number
Average Value
Number
Average Value
LOANS ORIGINATED
24
$130,835
214
$157,767
142
$141,488
51
$25,772
37
$121,683
APPLICATIONS APPROVED, NOT ACCEPTED
0
$0
25
$149,142
36
$130,154
10
$25,015
6
$159,337
APPLICATIONS DENIED
5
$59,092
85
$85,604
98
$131,183
24
$29,479
7
$148,457
APPLICATIONS WITHDRAWN
3
$116,970
20
$144,470
47
$136,193
4
$39,285
3
$70,147
FILES CLOSED FOR INCOMPLETENESS
1
$90,530
5
$185,738
14
$162,026
2
$30,555
1
$148,380
Aggregated Statistics For Year 1999 (Based on 2 partial tracts)
A) FHA, FSA/RHS & VA Home Purchase Loans
B) Conventional Home Purchase Loans
C) Refinancings
D) Home Improvement Loans
F) Non-occupant Loans on < 5 Family Dwellings (A B C & D)
Detailed PMIC statistics for the following Tracts:0024.00
, 0025.00
2002 - 2018 National Fire Incident Reporting System (NFIRS) incidents
Based on the data from the years 2002 - 2018 the average number of fire incidents per year is 27. The highest number of fire incidents - 44 took place in 2016, and the least - 3 in 2002. The data has a growing trend.
When looking into fire subcategories, the most reports belonged to: Outside Fires (65.3%), and Structure Fires (17.9%).
Fire incident types reported to NFIRS in Zip Code 80536


 Nearest zip codes: 80535, 82052, 82059, 80545, 82084, 80512.


 Based on the data from the years 2002 - 2018 the average number of fire incidents per year is 27. The highest number of fire incidents - 44 took place in 2016, and the least - 3 in 2002. The data has a growing trend.
 When looking into fire subcategories, the most reports belonged to: Outside Fires (65.3%), and Structure Fires (17.9%).