Estimated zip code population in 2022: 5,207 Zip code population in 2010: 4,309 Zip code population in 2000: 3,051
Houses and condos: 1,701 Renter-occupied apartments: 292
% of renters here:
17%
State:
34%
March 2022 cost of living index in zip code 80642: 100.7 (near average, U.S. average is 100)
Land area: 95.0 sq. mi. Water area: 1.4 sq. mi.
Population density: 55 people per square mile
(very low).
OSM Map
General Map
Google Map
MSN Map
OSM Map
General Map
Google Map
MSN Map
OSM Map
General Map
Google Map
MSN Map
OSM Map
General Map
Google Map
MSN Map
Please wait while loading the map...
Real estate property taxes paid for housing units in 2022:
This zip code:
0.4% ($2,132)
Colorado:
0.5% ($2,422)
Median real estate property taxes paid for housing units with mortgages in 2022: $2,736 (0.4%) Median real estate property taxes paid for housing units with no mortgage in 2022: $1,430 (0.3%)
Business Search- 14 Million verified businesses
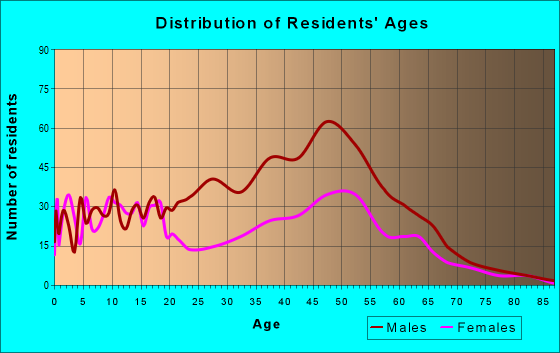
Males: 2,925
(56.2%)
Females: 2,281
(43.8%)
For population 25 years and over in 80642:
High school or higher: 81.6%
Bachelor's degree or higher: 15.3%
Graduate or professional degree: 2.6%
Unemployed: 1.5%
Mean travel time to work (commute): 31.6 minutes
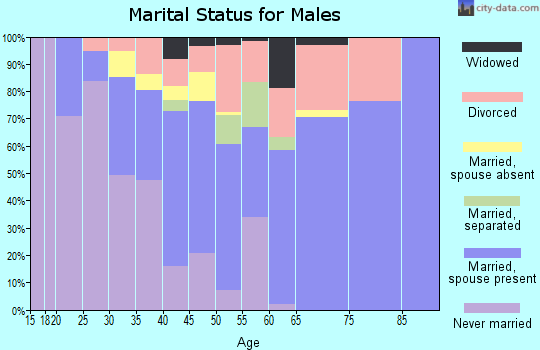
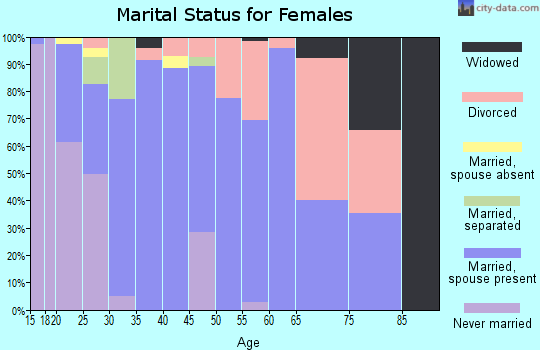
For population 15 years and over in 80642:
Never married: 29.0%
Now married: 57.3%
Separated: 2.1%
Widowed: 4.1%
Divorced: 7.4%
Zip code 80642 compared to state average:
Unemployed percentage below state average.
Black race population percentage significantly below state average.
Renting percentage below state average.
Length of stay since moving in significantly above state average.
Number of college students below state average.
Percentage of population with a bachelor's degree or higher significantly below state average.
Estimated median house/condo value in 2022: $572,138
80642:
$572,138
Colorado:
$531,100
According to our research of Colorado and other state lists, there were 8 registered sex offenders living in 80642 zip code as of April 27, 2024. The ratio of all residents to sex offenders in zip code 80642 is 512 to 1. The ratio of registered sex offenders to all residents in this zip code is near the state average.
Median resident age:
This zip code:
36.1 years
Colorado median age:
37.7 years
Average household size:
This zip code:
3.0 people
Colorado:
2.4 people
Averages for the 2020 tax year for zip code 80642, filed in 2021:
Average Adjusted Gross Income (AGI) in 2020: $98,285 (Individual Income Tax Returns)
Here:
$98,285
State:
$89,260
Salary/wage: $69,691 (reported on 82.5% of returns)
Here:
$69,691
State:
$70,330
(% of AGI for various income ranges: 1436.6% for AGIs below $25k, 3885.9% for AGIs $25k-50k, 6892.4% for AGIs $50k-75k, 10472.5% for AGIs $75k-100k, 23754.0% for AGIs $100k-200k, 62652.5% for AGIs over 200k)
Taxable interest for individuals: $1,449 (reported on 30.8% of returns)
This zip code:
$1,449
Colorado:
$2,176
(% of AGI for various income ranges: 23.1% for AGIs below $25k, 21.6% for AGIs $25k-50k, 23.8% for AGIs $50k-75k, 70.0% for AGIs $75k-100k, 154.5% for AGIs $100k-200k, 802.5% for AGIs over 200k)
Ordinary dividends: $3,294 (reported on 17.1% of returns)
Here:
$3,294
State:
$8,820
(% of AGI for various income ranges: 15.1% for AGIs below $25k, 19.7% for AGIs $25k-50k, 51.0% for AGIs $50k-75k, 63.7% for AGIs $75k-100k, 195.0% for AGIs $100k-200k, 1177.5% for AGIs over 200k)
Net capital gain/loss in AGI: +$18,842 (reported on 14.7% of returns)
Here:
+$18,842
State:
+$37,276
(% of AGI for various income ranges: 10.3% for AGIs below $25k, 27.5% for AGIs $25k-50k, 81.9% for AGIs $50k-75k, 110.0% for AGIs $75k-100k, 671.0% for AGIs $100k-200k, 10067.5% for AGIs over 200k)
Profit/loss from business: +$18,318 (reported on 19.0% of returns)
Here:
+$18,318
State:
+$15,295
(% of AGI for various income ranges: 306.6% for AGIs below $25k, 309.1% for AGIs $25k-50k, 602.4% for AGIs $50k-75k, 331.2% for AGIs $75k-100k, 1189.0% for AGIs $100k-200k, 2730.0% for AGIs over 200k)
Taxable individual retirement arrangement distribution: $20,679 (reported on 6.6% of returns)
80642:
$20,679
Colorado:
$23,785
(% of AGI for various income ranges: 38.3% for AGIs below $25k, 91.2% for AGIs $25k-50k, 241.0% for AGIs $50k-75k, 302.5% for AGIs $75k-100k, 739.5% for AGIs $100k-200k)
Total itemized deductions: $31,197 (reported on 14.7% of returns)
Here:
$31,197
State:
$35,141
(% of AGI for various income ranges: 298.4% for AGIs $25k-50k, 362.9% for AGIs $50k-75k, 830.6% for AGIs $75k-100k, 1968.5% for AGIs $100k-200k, 6720.0% for AGIs over 200k)
Charity contributions: $8,268 (reported on 10.4% of returns)
Here:
$8,268
State:
$12,103
(% of AGI for various income ranges: 55.7% for AGIs $50k-75k, 65.0% for AGIs $75k-100k, 232.5% for AGIs $100k-200k, 2832.5% for AGIs over 200k)
Taxes paid: $7,913 (reported on 14.7% of returns)
80642:
$7,913
State:
$7,710
(% of AGI for various income ranges: 40.9% for AGIs $25k-50k, 84.8% for AGIs $50k-75k, 224.4% for AGIs $75k-100k, 577.0% for AGIs $100k-200k, 1577.5% for AGIs over 200k)
Earned income credit: $2,129 (reported on 10.0% of returns)
Here:
$2,129
State:
$2,053
(% of AGI for various income ranges: 80.9% for AGIs below $25k, 51.2% for AGIs $25k-50k)
Percentage of individuals using paid preparers for their 2020 taxes: 92.9%
Here:
93%
State:
93%
(% for various income ranges: 90.9% for AGIs below $25k, 95.3% for AGIs $25k-50k, 90.6% for AGIs $50k-75k, 92.0% for AGIs $75k-100k, 93.0% for AGIs $100k-200k, 100.0% for AGIs over 200k)
Averages for the 2012 tax year for zip code 80642, filed in 2013:
Average Adjusted Gross Income (AGI) in 2012: $64,057 (Individual Income Tax Returns)
Here:
$64,057
State:
$69,103
Salary/wage: $55,577 (reported on 86.0% of returns)
Here:
$55,577
State:
$54,794
(% of AGI for various income ranges: 75.6% for AGIs below $25k, 82.3% for AGIs $25k-50k, 76.0% for AGIs $50k-75k, 79.6% for AGIs $75k-100k, 79.5% for AGIs $100k-200k, 55.9% for AGIs over 200k)
Taxable interest for individuals: $990 (reported on 29.7% of returns)
This zip code:
$990
Colorado:
$1,971
(% of AGI for various income ranges: 1.0% for AGIs below $25k, 0.2% for AGIs $25k-50k, 0.3% for AGIs $50k-75k, 0.2% for AGIs $75k-100k, 0.6% for AGIs $100k-200k, 0.5% for AGIs over 200k)
Ordinary dividends: $1,115 (reported on 15.1% of returns)
Here:
$1,115
State:
$7,140
(% of AGI for various income ranges: 0.7% for AGIs below $25k, 0.2% for AGIs $25k-50k, 0.2% for AGIs $50k-75k, 0.3% for AGIs $75k-100k, 0.2% for AGIs $100k-200k, 0.4% for AGIs over 200k)
Net capital gain/loss in AGI: +$10,167 (reported on 10.5% of returns)
Here:
+$10,167
State:
+$23,009
(% of AGI for various income ranges: 1.3% for AGIs $100k-200k, 6.8% for AGIs over 200k)
Profit/loss from business: +$9,207 (reported on 16.9% of returns)
Here:
+$9,207
State:
+$13,514
(% of AGI for various income ranges: 6.6% for AGIs below $25k, 4.6% for AGIs $25k-50k, 3.2% for AGIs $50k-75k, 0.5% for AGIs $75k-100k, 2.9% for AGIs $100k-200k)
Taxable individual retirement arrangement distribution: $16,018 (reported on 6.4% of returns)
80642:
$16,018
Colorado:
$17,927
(% of AGI for various income ranges: 2.5% for AGIs below $25k, 1.8% for AGIs $25k-50k, 1.9% for AGIs $50k-75k, 2.5% for AGIs $75k-100k, 1.7% for AGIs $100k-200k)
Total itemized deductions: $22,455 (20% of AGI, reported on 39.0% of returns)
Here:
$22,455
State:
$24,621
Here:
20.5% of AGI
State:
18.5% of AGI
(% of AGI for various income ranges: 10.3% for AGIs below $25k, 8.2% for AGIs $25k-50k, 15.4% for AGIs $50k-75k, 15.5% for AGIs $75k-100k, 16.1% for AGIs $100k-200k, 11.1% for AGIs over 200k)
Charity contributions: $2,813 (reported on 30.8% of returns)
Here:
$2,813
State:
$4,449
(% of AGI for various income ranges: 0.7% for AGIs below $25k, 0.7% for AGIs $25k-50k, 0.9% for AGIs $50k-75k, 1.8% for AGIs $75k-100k, 1.6% for AGIs $100k-200k, 1.5% for AGIs over 200k)
Taxes paid: $6,246 (reported on 39.0% of returns)
80642:
$6,246
State:
$7,641
(% of AGI for various income ranges: 1.0% for AGIs below $25k, 1.5% for AGIs $25k-50k, 3.3% for AGIs $50k-75k, 3.6% for AGIs $75k-100k, 5.0% for AGIs $100k-200k, 4.6% for AGIs over 200k)
Earned income credit: $2,156 (reported on 14.5% of returns)
Here:
$2,156
State:
$2,095
(% of AGI for various income ranges: 5.8% for AGIs below $25k, 1.1% for AGIs $25k-50k)
Percentage of individuals using paid preparers for their 2012 taxes: 59.3%
Here:
59%
State:
49%
(% for various income ranges: 51.8% for AGIs below $25k, 61.1% for AGIs $25k-50k, 68.0% for AGIs $50k-75k, 52.4% for AGIs $75k-100k, 66.7% for AGIs $100k-200k, 71.4% for AGIs over 200k)
Averages for the 2004 tax year for zip code 80642, filed in 2005:
Average Adjusted Gross Income (AGI) in 2004: $46,640 (Individual Income Tax Returns)
Here:
$46,640
State:
$55,014
Salary/wage: $44,867 (reported on 86.9% of returns)
Here:
$44,867
State:
$46,010
(% of AGI for various income ranges: 239.6% for AGIs below $10k, 78.3% for AGIs $10k-25k, 89.5% for AGIs $25k-50k, 84.6% for AGIs $50k-75k, 88.0% for AGIs $75k-100k, 74.5% for AGIs over 100k)
Taxable interest for individuals: $1,163 (reported on 41.7% of returns)
This zip code:
$1,163
Colorado:
$2,127
(% of AGI for various income ranges: 11.8% for AGIs below $10k, 1.2% for AGIs $10k-25k, 1.2% for AGIs $25k-50k, 0.6% for AGIs $50k-75k, 0.8% for AGIs $75k-100k, 1.2% for AGIs over 100k)
Taxable dividends: $747 (reported on 16.7% of returns)
Here:
$747
State:
$3,782
(% of AGI for various income ranges: 1.0% for AGIs below $10k, 0.6% for AGIs $10k-25k, 0.1% for AGIs $25k-50k, 0.4% for AGIs $50k-75k, 0.4% for AGIs $75k-100k, 0.1% for AGIs over 100k)
Net capital gain/loss: +$10,235 (reported on 14.1% of returns)
Here:
+$10,235
State:
+$17,882
(% of AGI for various income ranges: 5.9% for AGIs below $10k, 1.1% for AGIs $10k-25k, 0.2% for AGIs $25k-50k, 0.6% for AGIs $50k-75k, 1.1% for AGIs $75k-100k, 8.6% for AGIs over 100k)
Profit/loss from business: +$10,071 (reported on 19.4% of returns)
Here:
+$10,071
State:
+$11,247
(% of AGI for various income ranges: 41.4% for AGIs below $10k, 11.6% for AGIs $10k-25k, 4.5% for AGIs $25k-50k, 3.1% for AGIs $50k-75k, 2.6% for AGIs $75k-100k, 3.0% for AGIs over 100k)
IRA payment deduction: $2,105 (reported on 1.3% of returns)
80642:
$2,105
Colorado:
$2,947
Total itemized deductions: $19,489 (27% of AGI, reported on 45.6% of returns)
Here:
$19,489
State:
$20,560
Here:
27.3% of AGI
State:
21.4% of AGI
(% of AGI for various income ranges: 44.5% for AGIs below $10k, 14.7% for AGIs $10k-25k, 21.2% for AGIs $25k-50k, 19.8% for AGIs $50k-75k, 20.3% for AGIs $75k-100k, 17.0% for AGIs over 100k)
Charity contributions deductions: $2,156 (3% of AGI, reported on 38.5% of returns)
Here:
$2,156
State:
$3,518
Here:
2.9% of AGI
State:
3.4% of AGI
(% of AGI for various income ranges: 1.1% for AGIs $10k-25k, 1.5% for AGIs $25k-50k, 1.8% for AGIs $50k-75k, 1.5% for AGIs $75k-100k, 2.4% for AGIs over 100k)
Total tax: $6,082 (reported on 74.6% of returns)
80642:
$6,082
State:
$9,173
(% of AGI for various income ranges: 8.5% for AGIs below $10k, 4.8% for AGIs $10k-25k, 5.9% for AGIs $25k-50k, 7.6% for AGIs $50k-75k, 9.4% for AGIs $75k-100k, 15.4% for AGIs over 100k)
Earned income credit: $1,883 (reported on 14.2% of returns)
Here:
$1,883
State:
$1,595
Percentage of individuals using paid preparers for their 2004 taxes: 63.3%
Here:
63%
State:
55%
(% for various income ranges: 57.5% for AGIs below $10k, 63.5% for AGIs $10k-25k, 62.1% for AGIs $25k-50k, 63.4% for AGIs $50k-75k, 67.2% for AGIs $75k-100k, 70.9% for AGIs over 100k)
Likely homosexual households (counted as self-reported same-sex unmarried-partner households)
Lesbian couples: 0.0% of all households
Gay men: 0.7% of all households
Household received Food Stamps/SNAP in the past 12 months: 226 Household did not receive Food Stamps/SNAP in the past 12 months: 1,478
Women who had a birth in the past 12 months: 57 (45 now married, 11 unmarried) Women who did not have a birth in the past 12 months: 1,113 (606 now married, 503 unmarried)
Housing units in zip code 80642 with a mortgage: 861 (51 second mortgage, 50 both second mortgage and home equity loan) Median monthly owner costs for units with a mortgage: $2,321 Median monthly owner costs for units without a mortgage: $554
Residents with income below the poverty level in 2022:
This zip code:
6.9%
Whole state:
9.4%
Residents with income below 50% of the poverty level in 2022:
This zip code:
2.5%
Whole state:
4.6%
Median number of rooms in houses and condos:
Here:
6.1
State:
6.8
Median number of rooms in apartments:
Here:
4.8
State:
4.0
Notable locations in this zip code not listed on our city pages
Notable locations in zip code 80642: Hudson Pullett Farm (A), Rossi Dairy (B), Hudson Fire Protection District Station 1 (C), Hudson Fire Protection District Station 2 (D). Display/hide their locations on the map
Reservoirs: Ireland Number 5 Reservoir (A), Klug Reservoir Number 3 (B), Leemans Lake (C), Horse Creek Reservoir (D), Klug Lake (E), Sequine Reservoir (F), Stybr Reservoir Number 2 (G), Triangle Reservoir Number 1 (H). Display/hide their locations on the map
In group quarters: 77 (-1 institutionalized population)
Size of family households: 478 2-persons, 331 3-persons, 151 4-persons, 286 5-persons, 70 6-persons, 37 7-or-more-persons
Size of nonfamily households: 280 1-person, 12 2-persons, 18 4-persons
647 married couples with children.
143 single-parent households (88 men, 55 women).
75.2% of residents of 80642 zip code speak English at home.
24.2% of residents speak Spanish at home (69% very well, 13% well, 6% not well, 12% not at all).
0.4% of residents speak other Indo-European language at home (100% very well).
0.2% of residents speak other language at home (100% very well).
Foreign born population: 527 (10.1%) (27.5% of them are naturalized citizens)
This zip code:
10.1%
Whole state:
9.5%
80%Honduras
5%Mexico
3%Belize
2%France
1%North Macedonia (Macedonia)
21%German
7%Irish
7%American
6%English
2%Czech
2%Swedish
1%Turkish
Year of entry for the foreign-born population
752010 or later
3152000 to 2009
531990 to 1999
121Before 1990
Major facilities with environmental interests located in this zip code:
CHEMICAL & METAL INDUSTRIES, INC. (23465 CHEM-TECH AVENUE in HUDSON, CO)
STATE MASTER (Colorado database) - RCRAINFO-COR000202697, LQG (Integrated Compliance Information System) - ICIS-08-2005-0156, ENFORCEMENT/COMPLIANCE ACTIVITY FORMAL ENFORCEMENT ACTION (Integrated Compliance Information System) - ICIS-08-2005-0156, ENFORCEMENT/COMPLIANCE ACTIVITY Large Quantity Generators, more that 1000 kg of hazardous waste/month (Resource Conservation and Recovery Act (tracking hazardous waste)) - notification TRI REPORTER (Tracking of toxic chemicals releasing facilities) Business SIC classification: INDUSTRIAL INORGANIC CHEMICALS Business NAICS classification: ALL OTHER BASIC INORGANIC CHEMICAL MANUFACTURING. Organizations: CHEMICAL & METAL INDUSTRIES INC (CONTACT/OPERATOR)
HUDSON BODY SHOP (535 DAHLIA ST in HUDSON, CO)
STATE MASTER (Colorado database) - RCRAINFO-COD982588212, SQG (Resource Conservation and Recovery Act (tracking hazardous waste)) Organizations: NEAL ASPY (CONTACT/OWNER)
HUDSON, TOWN OF (557 ASH STREET in HUDSON, CO)
National Pollutant Discharge Elimination System NON-MAJOR (Tracking pollutant discharge elimination systems) - permit COMMUNITY WATER SYSTEM (SDWIS) - SDWIS-CO0162359 1, WATER TREATMENT PLANT, SDWIS-CO0162359 5, Business SIC classification: SEWERAGE SYSTEMS
HUDSON ELEMENTARY SCHOOL (300 BEECH STREET in HUDSON, CO)
(National Center for Education Statistics) - STATE ID-4148 Organizations: KEENESBURG RE-3(J) (SCHOOL DISTRICT)
HUDSON HEADSTART (3003 BEECH STREET in HUDSON, CO)
(National Center for Education Statistics) - STATE ID-4152 Organizations: KEENESBURG RE-3(J) (SCHOOL DISTRICT)
ACTIVE TRUCK AND AUTO PARTS, INCORPORATED (19640 WELD COUNTY ROAD 28 in HUDSON, CO)
(Resource Conservation and Recovery Act (tracking hazardous waste)) Alternative names: ACTIVE TRUCK SALES & PARTS INC., ACTIVE TRUCK SALES & SERVICE
KERR-MCGEE - BATTERY# 51527 (NWNE SEC 35 T3N R65W in HUDSON, 6.6 MI N OF, CO)
AIR MINOR (AIRS/AFS) CRITERIA AND HAZARDOUS AIR POLLUTANT INVENTORY (Inventory of air pollution sources) Business SIC classification: NATURAL GAS LIQUIDS Alternative names: KERR-MCGEE TANK BATTERY #51527
BUDDY COPELAND TRUCKING (21580 WCR #10 in HUDSON, CO)
(Resource Conservation and Recovery Act (tracking hazardous waste))
KERR-MCGEE - BATTERY# 51487 (NWNE SEC 23 T3N R65W in HUDSON, 8.6 MI N OF, CO)
AIR MINOR (AIRS/AFS) CRITERIA AND HAZARDOUS AIR POLLUTANT INVENTORY (Inventory of air pollution sources) Business SIC classification: NATURAL GAS LIQUIDS Alternative names: KERR-MCGEE TANK BATTERY #51487
KERR-MCGEE - BATTERY# 12063/62378 (NWNW SEC 10 T2N R65W in HUDSON, 5.1 MI N OF, CO)
AIR MINOR (AIRS/AFS) CRITERIA AND HAZARDOUS AIR POLLUTANT INVENTORY (Inventory of air pollution sources) Business SIC classification: NATURAL GAS LIQUIDS Alternative names: KERR-MCGEE TANK BATTERY #12063/62378, KERR-MCGEE TANK BATTERY #62378
KERR-MCGEE - BATTERY# 51529 (NENE SEC 35 T3N R65W in HUDSON, 6.6 MI N OF, CO)
AIR MINOR (AIRS/AFS) CRITERIA AND HAZARDOUS AIR POLLUTANT INVENTORY (Inventory of air pollution sources) Business SIC classification: NATURAL GAS LIQUIDS Alternative names: KERR-MCGEE TANK BATTERY #51529
KERR-MCGEE - BATTERY# 61496 (NENE SEC 34 T2N R65W in HUDSON, 1.4 MI NW OF, CO)
AIR MINOR (AIRS/AFS) CRITERIA AND HAZARDOUS AIR POLLUTANT INVENTORY (Inventory of air pollution sources) Business SIC classification: NATURAL GAS LIQUIDS Alternative names: KERR-MCGEE TANK BATTERY #61496
51.4%Utility gas
28.1%Bottled, tank, or LP gas
10.9%Electricity
5.9%Other fuel
3.0%Wood
0.8%No fuel used
Population in 1990: 2,369. Population change in the 1990s: +682 (+28.8%).
Place of birth for U.S.-born residents:
This state: 3,248
Northeast: 110
Midwest: 434
South: 407
West: 409
49% of the 80642 zip code residents lived in the same house 5 years ago. Out of people who lived in different houses, 44% lived in this county. Out of people who lived in different counties, 50% lived in Colorado.
93% of the 80642 zip code residents lived in the same house 1 year ago. Out of people who lived in different houses, 39% moved from this county. Out of people who lived in different houses, 62% moved from different county within same state. Out of people who lived in different houses, 6% moved from different state.
Private vs. public school enrollment:
Students in private schools in grades 1 to 8 (elementary and middle school): 24
Here:
5.4%
Colorado:
11.4%
Students in private schools in grades 9 to 12 (high school):
Here:
0.0%
Colorado:
8.5%
Students in private undergraduate colleges: 41
Here:
24.5%
Colorado:
14.0%
Occupation by median earnings in the past 12 months ($)
131,674Architecture and engineering occupations
92,209Management occupations
88,698Computer and mathematical occupations
81,332Health diagnosing and treating practitioners and other technical occupations
73,919Installation, maintenance, and repair occupations
63,183Office and administrative support occupations
Companies with federal contracts located in this zip code:
SKATEPARKS INTERNATIONAL INC (13080 CAVANAUGH RD in HUDSON, CO; small business)
$36,702 with Army for Athletic and Sporting Equipment. Taking place in CA. Signed on 2003-09-02. Completion date: 2003-12-01.
Top industries in this zip code by the number of employees in 2005:
Mining: Construction Sand and Gravel Mining (20-49 employees: 1 establishment)
Accommodation and Food Services: Full-Service Restaurants (20-49: 1)
Construction: Plumbing, Heating, and Air-Conditioning Contractors (10-19: 1, 1-4: 4)
Wholesale Trade: Other Chemical and Allied Products Merchant Wholesalers (10-19: 1)
Construction: Drywall and Insulation Contractors (10-19: 1)
People in group quarters in 2010:
871 people in state prisons
Fatal accident statistics in 2014:
Fatal accident count: 1
Vehicles involved in fatal accidents: 1
Fatal accidents caused by drunken drivers: 0
Fatalities: 1
Persons involved in fatal accidents: 1
Pedestrians involved in fatal accidents: 0
Fatal accident statistics in 2012:
Fatal accident count: 1
Vehicles involved in fatal accidents: 1
Fatal accidents caused by drunken drivers: 0
Fatalities: 1
Persons involved in fatal accidents: 2
Pedestrians involved in fatal accidents: 0
Home Mortgage Disclosure Act Aggregated Statistics For Year 2009 (Based on 8 partial tracts)
A) FHA, FSA/RHS & VA Home Purchase Loans
B) Conventional Home Purchase Loans
C) Refinancings
D) Home Improvement Loans
F) Non-occupant Loans on < 5 Family Dwellings (A B C & D)
G) Loans On Manufactured Home Dwelling (A B C & D)
Number
Average Value
Number
Average Value
Number
Average Value
Number
Average Value
Number
Average Value
Number
Average Value
LOANS ORIGINATED
154
$157,833
49
$124,558
232
$204,354
8
$64,149
16
$109,992
30
$105,418
APPLICATIONS APPROVED, NOT ACCEPTED
12
$133,110
12
$155,578
24
$222,652
1
$16,000
2
$161,785
4
$125,325
APPLICATIONS DENIED
30
$157,171
12
$150,129
109
$219,776
10
$60,598
7
$101,039
11
$124,268
APPLICATIONS WITHDRAWN
15
$153,796
7
$160,376
66
$216,931
3
$58,327
3
$137,837
6
$126,268
FILES CLOSED FOR INCOMPLETENESS
5
$137,602
1
$223,160
17
$190,530
3
$12,200
0
$0
3
$41,620
Aggregated Statistics For Year 2008 (Based on 8 partial tracts)
A) FHA, FSA/RHS & VA Home Purchase Loans
B) Conventional Home Purchase Loans
C) Refinancings
D) Home Improvement Loans
F) Non-occupant Loans on < 5 Family Dwellings (A B C & D)
G) Loans On Manufactured Home Dwelling (A B C & D)
Number
Average Value
Number
Average Value
Number
Average Value
Number
Average Value
Number
Average Value
Number
Average Value
LOANS ORIGINATED
96
$158,702
68
$144,220
128
$215,227
14
$57,410
24
$118,659
49
$102,905
APPLICATIONS APPROVED, NOT ACCEPTED
6
$115,292
8
$138,996
27
$191,739
4
$10,328
4
$84,795
6
$127,913
APPLICATIONS DENIED
24
$173,295
25
$139,069
148
$206,167
25
$63,091
14
$140,266
13
$121,988
APPLICATIONS WITHDRAWN
23
$153,395
20
$143,460
46
$212,545
3
$120,080
8
$115,381
8
$118,742
FILES CLOSED FOR INCOMPLETENESS
1
$127,840
1
$180,740
10
$200,046
0
$0
0
$0
1
$141,040
Aggregated Statistics For Year 2007 (Based on 8 partial tracts)
A) FHA, FSA/RHS & VA Home Purchase Loans
B) Conventional Home Purchase Loans
C) Refinancings
D) Home Improvement Loans
E) Loans on Dwellings For 5+ Families
F) Non-occupant Loans on < 5 Family Dwellings (A B C & D)
G) Loans On Manufactured Home Dwelling (A B C & D)
Number
Average Value
Number
Average Value
Number
Average Value
Number
Average Value
Number
Average Value
Number
Average Value
Number
Average Value
LOANS ORIGINATED
88
$152,844
223
$151,768
206
$199,976
34
$62,899
1
$698,970
30
$134,701
54
$121,987
APPLICATIONS APPROVED, NOT ACCEPTED
3
$173,630
32
$162,257
55
$204,724
8
$90,360
0
$0
10
$130,905
10
$126,159
APPLICATIONS DENIED
14
$151,246
89
$152,524
284
$194,060
40
$68,012
0
$0
23
$167,058
45
$127,670
APPLICATIONS WITHDRAWN
5
$149,028
31
$151,387
86
$196,569
6
$107,970
0
$0
5
$234,486
3
$119,260
FILES CLOSED FOR INCOMPLETENESS
0
$0
5
$211,436
27
$219,841
1
$96,010
0
$0
1
$189,480
1
$92,410
Aggregated Statistics For Year 2006 (Based on 8 partial tracts)
A) FHA, FSA/RHS & VA Home Purchase Loans
B) Conventional Home Purchase Loans
C) Refinancings
D) Home Improvement Loans
E) Loans on Dwellings For 5+ Families
F) Non-occupant Loans on < 5 Family Dwellings (A B C & D)
G) Loans On Manufactured Home Dwelling (A B C & D)
Number
Average Value
Number
Average Value
Number
Average Value
Number
Average Value
Number
Average Value
Number
Average Value
Number
Average Value
LOANS ORIGINATED
65
$151,572
315
$139,742
304
$176,941
42
$51,728
1
$961,900
40
$167,751
62
$112,387
APPLICATIONS APPROVED, NOT ACCEPTED
2
$227,020
50
$141,446
69
$181,032
6
$76,127
0
$0
8
$207,840
6
$160,847
APPLICATIONS DENIED
15
$159,737
130
$142,342
335
$179,635
35
$75,955
0
$0
20
$126,486
39
$119,239
APPLICATIONS WITHDRAWN
12
$145,439
84
$133,181
179
$187,588
6
$126,268
0
$0
12
$147,222
5
$136,494
FILES CLOSED FOR INCOMPLETENESS
1
$207,660
12
$149,682
36
$208,164
1
$6,950
0
$0
3
$153,530
0
$0
Aggregated Statistics For Year 2005 (Based on 8 partial tracts)
A) FHA, FSA/RHS & VA Home Purchase Loans
B) Conventional Home Purchase Loans
C) Refinancings
D) Home Improvement Loans
E) Loans on Dwellings For 5+ Families
F) Non-occupant Loans on < 5 Family Dwellings (A B C & D)
G) Loans On Manufactured Home Dwelling (A B C & D)
Number
Average Value
Number
Average Value
Number
Average Value
Number
Average Value
Number
Average Value
Number
Average Value
Number
Average Value
LOANS ORIGINATED
46
$153,759
286
$148,583
428
$170,241
39
$77,716
0
$0
32
$117,867
45
$121,073
APPLICATIONS APPROVED, NOT ACCEPTED
1
$110,400
52
$153,113
106
$161,118
11
$48,124
0
$0
5
$127,996
9
$141,734
APPLICATIONS DENIED
10
$132,965
122
$132,108
377
$178,594
48
$54,752
1
$20,470
13
$107,532
51
$109,333
APPLICATIONS WITHDRAWN
5
$156,094
62
$146,375
234
$189,176
16
$136,379
0
$0
13
$148,739
16
$123,804
FILES CLOSED FOR INCOMPLETENESS
0
$0
11
$138,339
61
$199,632
1
$45,160
0
$0
0
$0
5
$113,548
Aggregated Statistics For Year 2004 (Based on 8 partial tracts)
A) FHA, FSA/RHS & VA Home Purchase Loans
B) Conventional Home Purchase Loans
C) Refinancings
D) Home Improvement Loans
F) Non-occupant Loans on < 5 Family Dwellings (A B C & D)
G) Loans On Manufactured Home Dwelling (A B C & D)
Number
Average Value
Number
Average Value
Number
Average Value
Number
Average Value
Number
Average Value
Number
Average Value
LOANS ORIGINATED
64
$154,398
231
$158,120
503
$179,822
42
$80,339
34
$138,691
53
$127,142
APPLICATIONS APPROVED, NOT ACCEPTED
3
$143,203
37
$154,627
119
$185,795
8
$82,189
3
$144,110
10
$119,751
APPLICATIONS DENIED
22
$154,122
82
$144,308
435
$170,418
44
$47,056
20
$115,313
62
$131,888
APPLICATIONS WITHDRAWN
18
$167,136
45
$144,579
228
$184,321
9
$60,032
6
$141,057
13
$132,725
FILES CLOSED FOR INCOMPLETENESS
1
$206,360
9
$158,783
50
$205,411
4
$106,575
2
$225,375
4
$144,225
Aggregated Statistics For Year 2003 (Based on 8 partial tracts)
A) FHA, FSA/RHS & VA Home Purchase Loans
B) Conventional Home Purchase Loans
C) Refinancings
D) Home Improvement Loans
F) Non-occupant Loans on < 5 Family Dwellings (A B C & D)
Number
Average Value
Number
Average Value
Number
Average Value
Number
Average Value
Number
Average Value
LOANS ORIGINATED
110
$177,068
205
$169,961
876
$171,418
35
$50,202
43
$138,368
APPLICATIONS APPROVED, NOT ACCEPTED
2
$170,885
39
$145,326
126
$181,994
11
$67,278
8
$161,566
APPLICATIONS DENIED
22
$166,806
83
$148,146
399
$171,511
42
$33,296
16
$172,708
APPLICATIONS WITHDRAWN
24
$176,832
43
$179,546
228
$171,383
6
$61,395
11
$187,107
FILES CLOSED FOR INCOMPLETENESS
1
$122,980
6
$179,973
25
$169,552
3
$25,807
1
$85,280
Aggregated Statistics For Year 2002 (Based on 6 partial tracts)
A) FHA, FSA/RHS & VA Home Purchase Loans
B) Conventional Home Purchase Loans
C) Refinancings
D) Home Improvement Loans
E) Loans on Dwellings For 5+ Families
F) Non-occupant Loans on < 5 Family Dwellings (A B C & D)
Number
Average Value
Number
Average Value
Number
Average Value
Number
Average Value
Number
Average Value
Number
Average Value
LOANS ORIGINATED
113
$153,606
148
$164,613
472
$156,875
39
$38,197
0
$0
31
$121,508
APPLICATIONS APPROVED, NOT ACCEPTED
3
$240,363
40
$176,456
78
$159,152
2
$18,700
0
$0
3
$112,270
APPLICATIONS DENIED
8
$129,931
59
$147,594
208
$135,495
45
$29,778
1
$46,390
13
$109,368
APPLICATIONS WITHDRAWN
9
$161,849
25
$174,570
128
$155,806
5
$64,408
0
$0
2
$151,735
FILES CLOSED FOR INCOMPLETENESS
0
$0
10
$168,182
58
$164,896
1
$57,500
0
$0
1
$79,820
Aggregated Statistics For Year 2001 (Based on 6 partial tracts)
A) FHA, FSA/RHS & VA Home Purchase Loans
B) Conventional Home Purchase Loans
C) Refinancings
D) Home Improvement Loans
F) Non-occupant Loans on < 5 Family Dwellings (A B C & D)
Number
Average Value
Number
Average Value
Number
Average Value
Number
Average Value
Number
Average Value
LOANS ORIGINATED
128
$143,597
122
$142,067
390
$152,927
34
$22,414
27
$126,087
APPLICATIONS APPROVED, NOT ACCEPTED
7
$150,559
29
$136,454
62
$142,382
8
$23,140
4
$117,578
APPLICATIONS DENIED
6
$143,913
49
$93,792
180
$119,909
39
$23,674
6
$101,577
APPLICATIONS WITHDRAWN
6
$157,357
17
$149,566
104
$147,836
13
$34,521
2
$136,300
FILES CLOSED FOR INCOMPLETENESS
0
$0
4
$147,290
24
$141,929
2
$56,555
0
$0
Aggregated Statistics For Year 2000 (Based on 6 partial tracts)
A) FHA, FSA/RHS & VA Home Purchase Loans
B) Conventional Home Purchase Loans
C) Refinancings
D) Home Improvement Loans
F) Non-occupant Loans on < 5 Family Dwellings (A B C & D)
Number
Average Value
Number
Average Value
Number
Average Value
Number
Average Value
Number
Average Value
LOANS ORIGINATED
62
$123,985
114
$131,490
147
$126,665
36
$34,567
20
$105,186
APPLICATIONS APPROVED, NOT ACCEPTED
9
$124,706
19
$90,241
37
$95,244
17
$29,940
1
$138,060
APPLICATIONS DENIED
5
$106,374
64
$97,260
109
$110,249
35
$27,887
11
$95,535
APPLICATIONS WITHDRAWN
7
$117,540
15
$109,795
54
$112,893
5
$53,828
3
$132,403
FILES CLOSED FOR INCOMPLETENESS
0
$0
2
$125,075
11
$97,657
2
$20,560
0
$0
Aggregated Statistics For Year 1999 (Based on 3 partial tracts)
A) FHA, FSA/RHS & VA Home Purchase Loans
B) Conventional Home Purchase Loans
C) Refinancings
D) Home Improvement Loans
F) Non-occupant Loans on < 5 Family Dwellings (A B C & D)
2007 - 2018 National Fire Incident Reporting System (NFIRS) incidents
Based on the data from the years 2007 - 2018 the average number of fire incidents per year is 40. The highest number of fire incidents - 71 took place in 2016, and the least - 6 in 2007. The data has a growing trend.
When looking into fire subcategories, the most reports belonged to: Outside Fires (68.9%), and Structure Fires (16.6%).
Fire incident types reported to NFIRS in Zip Code 80642


 Nearest zip codes: 80643, 80603, 80621, 80249, 80601, 80022.


 Based on the data from the years 2007 - 2018 the average number of fire incidents per year is 40. The highest number of fire incidents - 71 took place in 2016, and the least - 6 in 2007. The data has a growing trend.
 When looking into fire subcategories, the most reports belonged to: Outside Fires (68.9%), and Structure Fires (16.6%).